 Email
Email Print
Print


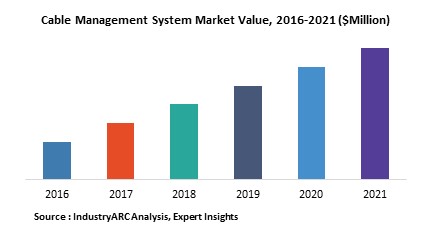
Cable Management System Market - Forecast(2024 - 2030)
Cable Management System market deals with the installation of various cable management tools in order to protect cables for data communication or electrical services in an industry, organization, building or vehicle. A proper deployment or installation of cable management tools helps in traceability of particular connections for their validation in terms of quality and code compliance as stated by the regulatory authorities. Cable Management delivers end-users with different benefits such as reduction labor and operational cost, enhanced safety, increased adaptability and low maintenance.
The global cable management system market has been segmented on the basis of product type, material, industry vertical and different geographical regions. Based on various types, the market is classified into cable tray, raceway, cable ladder, cable conduit, cable trunking, cable gland, cable connector, cable lug &tools, cable chain & reel, and others. Others include product types such as markers and cable tags. By material, the market is characterized into metallic and non-metallic materials type. On the basis of different industry verticals, the market is segmented into supply chain & manufacturing, IT & Telecommunication, logistics and transportation, energy & utility, oil & gas and mining. Geographically, the market is characterized into Americas, Europe, Asia Pacific and rest of the World (RoW). In the APAC region, the market is expected to witness strong progress during the forecast period. This is mainly attributed to the tremendous growth across the construction and IT & Telecommunication sectors.
The tremendously growing construction industry can be seen as the major driver for the cable management system market across the globe. Cable management system has become a perfect alternative for all the organizations that are going through a problem of various financial losses and low productivity. Significant rise of construction industry in BRICS economies has led to high adoption of cable management systems across the world. This is further reinforced by the growing infrastructural and development projects in developing regions with an aim to recover their construction sector. Moreover, the upgradation and renewal of existing communication networks in the matured economies such as the U.S. is contributing to the market’s demand significantly. The growing demand for various bandwidth requirements is identified as the key reason for the cable management system market in IT & Telecommunication sector. However, the constant volatility of raw material prices is projected to be inhibiting the market growth during the forecast period.
Sample companies profiled in this report are:
- Thomas & Betts Corporation (ABB Ltd.)
- Legrand SA
- HellermannTyton Group PLC
- Allied Tube & Conduit (Atkore International Holdings Ltd)
- Cooper Wiring Devices (Eaton Corporation)
- 10+.
1. Cable Management System – Market Overview
2. Executive Summary
3. Cable Management System – Market Landscape
3.1. Market Share Analysis
3.2. Comparative Analysis
3.2.1. Product Benchmarking
3.2.2. End User Profiling
3.2.3. Top 5 Financials Analysis
4. Cable Management System – Market Forces
4.1. Market Drivers
4.2. Market Constraints
4.3. Market Challenges
4.4. Attractiveness of the Cable Management System Industry
4.4.1. Power of Suppliers
4.4.2. Power of Customers
4.4.3. Threat of New Entrants
4.4.4. Threat of Substitution
4.4.5. Degree of Competition
5. Cable Management System Market – Strategic Analysis
5.1. Value Chain Analysis
5.2. Pricing Analysis
5.3. Opportunities Analysis
5.4. Product/Market Life Cycle Analysis
5.5. Suppliers and Distributors
6. Cable Management System Market – By Product Type:
6.1. Cable Tray
6.2. Raceway
6.3. Cable Ladder
6.4. Cable Conduit
6.5. Cable Trunking
6.6. Cable Gland
6.7. Cable Connector
6.8. Cable Lug & Tools
6.9. Cable Chain & Reel
6.10. Others
7. Cable Management System Market – By Material:
7.1. Metallic
7.2. Non-Metallic
8. Cable Management System Market – By Industry Vertical:
8.1. Supply Chain & Manufacturing
8.2. IT & Telecommunication
8.3. Logistics & Transportation
8.4. Energy & Utility
8.5. Oil & Gas
8.6. Mining
9. Cable Management System Market - By Geography:
9.1. Introduction
9.2. Global Study
9.3. Americas
9.3.1. North America
9.3.2. Brazil
9.3.3. Argentina
9.3.4. Others
9.4. Europe
9.4.1. U.K.
9.4.2. France
9.4.3. Germany
9.4.4. Others
9.5. APAC
9.5.1. China
9.5.2. South Korea
9.5.3. Japan
9.5.4. India
9.5.5. Others
9.6. ROW
10. Market Entropy
10.1. New Product Launches
10.2. M&As, Collaborations, JVs and Partnerships
11. Company Profiles
12.1. Abbreviations
12.2. Sources
12.3. Research Methodology
12.4. Bibliography
12.5. Compilation of Expert Insights
12.6. Disclaimer
2. Executive Summary
3. Cable Management System – Market Landscape
3.1. Market Share Analysis
3.2. Comparative Analysis
3.2.1. Product Benchmarking
3.2.2. End User Profiling
3.2.3. Top 5 Financials Analysis
4. Cable Management System – Market Forces
4.1. Market Drivers
4.2. Market Constraints
4.3. Market Challenges
4.4. Attractiveness of the Cable Management System Industry
4.4.1. Power of Suppliers
4.4.2. Power of Customers
4.4.3. Threat of New Entrants
4.4.4. Threat of Substitution
4.4.5. Degree of Competition
5. Cable Management System Market – Strategic Analysis
5.1. Value Chain Analysis
5.2. Pricing Analysis
5.3. Opportunities Analysis
5.4. Product/Market Life Cycle Analysis
5.5. Suppliers and Distributors
6. Cable Management System Market – By Product Type:
6.1. Cable Tray
6.2. Raceway
6.3. Cable Ladder
6.4. Cable Conduit
6.5. Cable Trunking
6.6. Cable Gland
6.7. Cable Connector
6.8. Cable Lug & Tools
6.9. Cable Chain & Reel
6.10. Others
7. Cable Management System Market – By Material:
7.1. Metallic
7.2. Non-Metallic
8. Cable Management System Market – By Industry Vertical:
8.1. Supply Chain & Manufacturing
8.2. IT & Telecommunication
8.3. Logistics & Transportation
8.4. Energy & Utility
8.5. Oil & Gas
8.6. Mining
9. Cable Management System Market - By Geography:
9.1. Introduction
9.2. Global Study
9.3. Americas
9.3.1. North America
9.3.2. Brazil
9.3.3. Argentina
9.3.4. Others
9.4. Europe
9.4.1. U.K.
9.4.2. France
9.4.3. Germany
9.4.4. Others
9.5. APAC
9.5.1. China
9.5.2. South Korea
9.5.3. Japan
9.5.4. India
9.5.5. Others
9.6. ROW
10. Market Entropy
10.1. New Product Launches
10.2. M&As, Collaborations, JVs and Partnerships
11. Company Profiles
11.1. Company 1
11.2. Company 2
11.3. Company 3
11.4. Company 4
11.5. Company 5
11.6. Company 6
11.7. Company 7
11.8. Company 8
11.9. Company 9
11.10. Company 10
*More than 10 Companies are profiled in this Research Report*"*Financials would be provided on a best efforts basis for private companies"
12. Appendix12.1. Abbreviations
12.2. Sources
12.3. Research Methodology
12.4. Bibliography
12.5. Compilation of Expert Insights
12.6. Disclaimer
List of Tables
Table 1: Cable Management System Market Overview 2023-2030
Table 2: Cable Management System Market Leader Analysis 2023-2030 (US$)
Table 3: Cable Management System MarketProduct Analysis 2023-2030 (US$)
Table 4: Cable Management System MarketEnd User Analysis 2023-2030 (US$)
Table 5: Cable Management System MarketPatent Analysis 2013-2023* (US$)
Table 6: Cable Management System MarketFinancial Analysis 2023-2030 (US$)
Table 7: Cable Management System Market Driver Analysis 2023-2030 (US$)
Table 8: Cable Management System MarketChallenges Analysis 2023-2030 (US$)
Table 9: Cable Management System MarketConstraint Analysis 2023-2030 (US$)
Table 10: Cable Management System Market Supplier Bargaining Power Analysis 2023-2030 (US$)
Table 11: Cable Management System Market Buyer Bargaining Power Analysis 2023-2030 (US$)
Table 12: Cable Management System Market Threat of Substitutes Analysis 2023-2030 (US$)
Table 13: Cable Management System Market Threat of New Entrants Analysis 2023-2030 (US$)
Table 14: Cable Management System Market Degree of Competition Analysis 2023-2030 (US$)
Table 15: Cable Management System MarketValue Chain Analysis 2023-2030 (US$)
Table 16: Cable Management System MarketPricing Analysis 2023-2030 (US$)
Table 17: Cable Management System MarketOpportunities Analysis 2023-2030 (US$)
Table 18: Cable Management System MarketProduct Life Cycle Analysis 2023-2030 (US$)
Table 19: Cable Management System MarketSupplier Analysis 2023-2030 (US$)
Table 20: Cable Management System MarketDistributor Analysis 2023-2030 (US$)
Table 21: Cable Management System Market Trend Analysis 2023-2030 (US$)
Table 22: Cable Management System Market Size 2023 (US$)
Table 23: Cable Management System Market Forecast Analysis 2023-2030 (US$)
Table 24: Cable Management System Market Sales Forecast Analysis 2023-2030 (Units)
Table 25: Cable Management System Market, Revenue & Volume,By Product Type, 2023-2030 ($)
Table 26: Cable Management System MarketBy Product Type, Revenue & Volume,By Cable Tray, 2023-2030 ($)
Table 27: Cable Management System MarketBy Product Type, Revenue & Volume,By Raceway, 2023-2030 ($)
Table 28: Cable Management System MarketBy Product Type, Revenue & Volume,By Cable Ladder, 2023-2030 ($)
Table 29: Cable Management System MarketBy Product Type, Revenue & Volume,By Cable Conduit, 2023-2030 ($)
Table 30: Cable Management System MarketBy Product Type, Revenue & Volume,By Cable Trunking, 2023-2030 ($)
Table 31: Cable Management System Market, Revenue & Volume,By Material, 2023-2030 ($)
Table 32: Cable Management System MarketBy Material, Revenue & Volume,By Metallic, 2023-2030 ($)
Table 33: Cable Management System MarketBy Material, Revenue & Volume,By Non-Metallic, 2023-2030 ($)
Table 34: Cable Management System Market, Revenue & Volume,By Industry Vertical, 2023-2030 ($)
Table 35: Cable Management System MarketBy Industry Vertical, Revenue & Volume,By Supply Chain & Manufacturing, 2023-2030 ($)
Table 36: Cable Management System MarketBy Industry Vertical, Revenue & Volume,By IT & Telecommunication, 2023-2030 ($)
Table 37: Cable Management System MarketBy Industry Vertical, Revenue & Volume,By Logistics & Transportation, 2023-2030 ($)
Table 38: Cable Management System MarketBy Industry Vertical, Revenue & Volume,By Energy & Utility, 2023-2030 ($)
Table 39: Cable Management System MarketBy Industry Vertical, Revenue & Volume,By Oil & Gas, 2023-2030 ($)
Table 40: North America Cable Management System Market, Revenue & Volume,By Product Type, 2023-2030 ($)
Table 41: North America Cable Management System Market, Revenue & Volume,By Material, 2023-2030 ($)
Table 42: North America Cable Management System Market, Revenue & Volume,By Industry Vertical, 2023-2030 ($)
Table 43: South america Cable Management System Market, Revenue & Volume,By Product Type, 2023-2030 ($)
Table 44: South america Cable Management System Market, Revenue & Volume,By Material, 2023-2030 ($)
Table 45: South america Cable Management System Market, Revenue & Volume,By Industry Vertical, 2023-2030 ($)
Table 46: Europe Cable Management System Market, Revenue & Volume,By Product Type, 2023-2030 ($)
Table 47: Europe Cable Management System Market, Revenue & Volume,By Material, 2023-2030 ($)
Table 48: Europe Cable Management System Market, Revenue & Volume,By Industry Vertical, 2023-2030 ($)
Table 49: APAC Cable Management System Market, Revenue & Volume,By Product Type, 2023-2030 ($)
Table 50: APAC Cable Management System Market, Revenue & Volume,By Material, 2023-2030 ($)
Table 51: APAC Cable Management System Market, Revenue & Volume,By Industry Vertical, 2023-2030 ($)
Table 52: Middle East & Africa Cable Management System Market, Revenue & Volume,By Product Type, 2023-2030 ($)
Table 53: Middle East & Africa Cable Management System Market, Revenue & Volume,By Material, 2023-2030 ($)
Table 54: Middle East & Africa Cable Management System Market, Revenue & Volume,By Industry Vertical, 2023-2030 ($)
Table 55: Russia Cable Management System Market, Revenue & Volume,By Product Type, 2023-2030 ($)
Table 56: Russia Cable Management System Market, Revenue & Volume,By Material, 2023-2030 ($)
Table 57: Russia Cable Management System Market, Revenue & Volume,By Industry Vertical, 2023-2030 ($)
Table 58: Israel Cable Management System Market, Revenue & Volume,By Product Type, 2023-2030 ($)
Table 59: Israel Cable Management System Market, Revenue & Volume,By Material, 2023-2030 ($)
Table 60: Israel Cable Management System Market, Revenue & Volume,By Industry Vertical, 2023-2030 ($)
Table 61: Top Companies 2023 (US$)Cable Management System Market, Revenue & Volume,,
Table 62: Product Launch 2023-2030Cable Management System Market, Revenue & Volume,,
Table 63: Mergers & Acquistions 2023-2030Cable Management System Market, Revenue & Volume,,
List of Figures
Figure 1: Overview of Cable Management System Market 2023-2030
Figure 2: Market Share Analysis for Cable Management System Market 2023 (US$)
Figure 3: Product Comparison in Cable Management System Market 2023-2030 (US$)
Figure 4: End User Profile for Cable Management System Market 2023-2030 (US$)
Figure 5: Patent Application and Grant in Cable Management System Market 2013-2023* (US$)
Figure 6: Top 5 Companies Financial Analysis in Cable Management System Market 2023-2030 (US$)
Figure 7: Market Entry Strategy in Cable Management System Market 2023-2030
Figure 8: Ecosystem Analysis in Cable Management System Market2023
Figure 9: Average Selling Price in Cable Management System Market 2023-2030
Figure 10: Top Opportunites in Cable Management System Market 2023-2030
Figure 11: Market Life Cycle Analysis in Cable Management System Market
Figure 12: GlobalBy Product TypeCable Management System Market Revenue, 2023-2030 ($)
Figure 13: GlobalBy MaterialCable Management System Market Revenue, 2023-2030 ($)
Figure 14: GlobalBy Industry VerticalCable Management System Market Revenue, 2023-2030 ($)
Figure 15: Global Cable Management System Market - By Geography
Figure 16: Global Cable Management System Market Value & Volume, By Geography, 2023-2030 ($)
Figure 17: Global Cable Management System Market CAGR, By Geography, 2023-2030 (%)
Figure 18: North America Cable Management System Market Value & Volume, 2023-2030 ($)
Figure 19: US Cable Management System Market Value & Volume, 2023-2030 ($)
Figure 20: US GDP and Population, 2023-2030 ($)
Figure 21: US GDP – Composition of 2023, By Sector of Origin
Figure 22: US Export and Import Value & Volume, 2023-2030 ($)
Figure 23: Canada Cable Management System Market Value & Volume, 2023-2030 ($)
Figure 24: Canada GDP and Population, 2023-2030 ($)
Figure 25: Canada GDP – Composition of 2023, By Sector of Origin
Figure 26: Canada Export and Import Value & Volume, 2023-2030 ($)
Figure 27: Mexico Cable Management System Market Value & Volume, 2023-2030 ($)
Figure 28: Mexico GDP and Population, 2023-2030 ($)
Figure 29: Mexico GDP – Composition of 2023, By Sector of Origin
Figure 30: Mexico Export and Import Value & Volume, 2023-2030 ($)
Figure 31: South America Cable Management System MarketSouth America 3D Printing Market Value & Volume, 2023-2030 ($)
Figure 32: Brazil Cable Management System Market Value & Volume, 2023-2030 ($)
Figure 33: Brazil GDP and Population, 2023-2030 ($)
Figure 34: Brazil GDP – Composition of 2023, By Sector of Origin
Figure 35: Brazil Export and Import Value & Volume, 2023-2030 ($)
Figure 36: Venezuela Cable Management System Market Value & Volume, 2023-2030 ($)
Figure 37: Venezuela GDP and Population, 2023-2030 ($)
Figure 38: Venezuela GDP – Composition of 2023, By Sector of Origin
Figure 39: Venezuela Export and Import Value & Volume, 2023-2030 ($)
Figure 40: Argentina Cable Management System Market Value & Volume, 2023-2030 ($)
Figure 41: Argentina GDP and Population, 2023-2030 ($)
Figure 42: Argentina GDP – Composition of 2023, By Sector of Origin
Figure 43: Argentina Export and Import Value & Volume, 2023-2030 ($)
Figure 44: Ecuador Cable Management System Market Value & Volume, 2023-2030 ($)
Figure 45: Ecuador GDP and Population, 2023-2030 ($)
Figure 46: Ecuador GDP – Composition of 2023, By Sector of Origin
Figure 47: Ecuador Export and Import Value & Volume, 2023-2030 ($)
Figure 48: Peru Cable Management System Market Value & Volume, 2023-2030 ($)
Figure 49: Peru GDP and Population, 2023-2030 ($)
Figure 50: Peru GDP – Composition of 2023, By Sector of Origin
Figure 51: Peru Export and Import Value & Volume, 2023-2030 ($)
Figure 52: Colombia Cable Management System Market Value & Volume, 2023-2030 ($)
Figure 53: Colombia GDP and Population, 2023-2030 ($)
Figure 54: Colombia GDP – Composition of 2023, By Sector of Origin
Figure 55: Colombia Export and Import Value & Volume, 2023-2030 ($)
Figure 56: Costa Rica Cable Management System MarketCosta Rica 3D Printing Market Value & Volume, 2023-2030 ($)
Figure 57: Costa Rica GDP and Population, 2023-2030 ($)
Figure 58: Costa Rica GDP – Composition of 2023, By Sector of Origin
Figure 59: Costa Rica Export and Import Value & Volume, 2023-2030 ($)
Figure 60: Europe Cable Management System Market Value & Volume, 2023-2030 ($)
Figure 61: U.K Cable Management System Market Value & Volume, 2023-2030 ($)
Figure 62: U.K GDP and Population, 2023-2030 ($)
Figure 63: U.K GDP – Composition of 2023, By Sector of Origin
Figure 64: U.K Export and Import Value & Volume, 2023-2030 ($)
Figure 65: Germany Cable Management System Market Value & Volume, 2023-2030 ($)
Figure 66: Germany GDP and Population, 2023-2030 ($)
Figure 67: Germany GDP – Composition of 2023, By Sector of Origin
Figure 68: Germany Export and Import Value & Volume, 2023-2030 ($)
Figure 69: Italy Cable Management System Market Value & Volume, 2023-2030 ($)
Figure 70: Italy GDP and Population, 2023-2030 ($)
Figure 71: Italy GDP – Composition of 2023, By Sector of Origin
Figure 72: Italy Export and Import Value & Volume, 2023-2030 ($)
Figure 73: France Cable Management System Market Value & Volume, 2023-2030 ($)
Figure 74: France GDP and Population, 2023-2030 ($)
Figure 75: France GDP – Composition of 2023, By Sector of Origin
Figure 76: France Export and Import Value & Volume, 2023-2030 ($)
Figure 77: Netherlands Cable Management System Market Value & Volume, 2023-2030 ($)
Figure 78: Netherlands GDP and Population, 2023-2030 ($)
Figure 79: Netherlands GDP – Composition of 2023, By Sector of Origin
Figure 80: Netherlands Export and Import Value & Volume, 2023-2030 ($)
Figure 81: Belgium Cable Management System Market Value & Volume, 2023-2030 ($)
Figure 82: Belgium GDP and Population, 2023-2030 ($)
Figure 83: Belgium GDP – Composition of 2023, By Sector of Origin
Figure 84: Belgium Export and Import Value & Volume, 2023-2030 ($)
Figure 85: Spain Cable Management System Market Value & Volume, 2023-2030 ($)
Figure 86: Spain GDP and Population, 2023-2030 ($)
Figure 87: Spain GDP – Composition of 2023, By Sector of Origin
Figure 88: Spain Export and Import Value & Volume, 2023-2030 ($)
Figure 89: Denmark Cable Management System Market Value & Volume, 2023-2030 ($)
Figure 90: Denmark GDP and Population, 2023-2030 ($)
Figure 91: Denmark GDP – Composition of 2023, By Sector of Origin
Figure 92: Denmark Export and Import Value & Volume, 2023-2030 ($)
Figure 93: APAC Cable Management System Market Value & Volume, 2023-2030 ($)
Figure 94: China Cable Management System MarketValue & Volume, 2023-2030
Figure 95: China GDP and Population, 2023-2030 ($)
Figure 96: China GDP – Composition of 2023, By Sector of Origin
Figure 97: China Export and Import Value & Volume, 2023-2030 ($)Cable Management System MarketChina Export and Import Value & Volume, 2023-2030 ($)
Figure 98: Australia Cable Management System Market Value & Volume, 2023-2030 ($)
Figure 99: Australia GDP and Population, 2023-2030 ($)
Figure 100: Australia GDP – Composition of 2023, By Sector of Origin
Figure 101: Australia Export and Import Value & Volume, 2023-2030 ($)
Figure 102: South Korea Cable Management System Market Value & Volume, 2023-2030 ($)
Figure 103: South Korea GDP and Population, 2023-2030 ($)
Figure 104: South Korea GDP – Composition of 2023, By Sector of Origin
Figure 105: South Korea Export and Import Value & Volume, 2023-2030 ($)
Figure 106: India Cable Management System Market Value & Volume, 2023-2030 ($)
Figure 107: India GDP and Population, 2023-2030 ($)
Figure 108: India GDP – Composition of 2023, By Sector of Origin
Figure 109: India Export and Import Value & Volume, 2023-2030 ($)
Figure 110: Taiwan Cable Management System MarketTaiwan 3D Printing Market Value & Volume, 2023-2030 ($)
Figure 111: Taiwan GDP and Population, 2023-2030 ($)
Figure 112: Taiwan GDP – Composition of 2023, By Sector of Origin
Figure 113: Taiwan Export and Import Value & Volume, 2023-2030 ($)
Figure 114: Malaysia Cable Management System MarketMalaysia 3D Printing Market Value & Volume, 2023-2030 ($)
Figure 115: Malaysia GDP and Population, 2023-2030 ($)
Figure 116: Malaysia GDP – Composition of 2023, By Sector of Origin
Figure 117: Malaysia Export and Import Value & Volume, 2023-2030 ($)
Figure 118: Hong Kong Cable Management System MarketHong Kong 3D Printing Market Value & Volume, 2023-2030 ($)
Figure 119: Hong Kong GDP and Population, 2023-2030 ($)
Figure 120: Hong Kong GDP – Composition of 2023, By Sector of Origin
Figure 121: Hong Kong Export and Import Value & Volume, 2023-2030 ($)
Figure 122: Middle East & Africa Cable Management System MarketMiddle East & Africa 3D Printing Market Value & Volume, 2023-2030 ($)
Figure 123: Russia Cable Management System MarketRussia 3D Printing Market Value & Volume, 2023-2030 ($)
Figure 124: Russia GDP and Population, 2023-2030 ($)
Figure 125: Russia GDP – Composition of 2023, By Sector of Origin
Figure 126: Russia Export and Import Value & Volume, 2023-2030 ($)
Figure 127: Israel Cable Management System Market Value & Volume, 2023-2030 ($)
Figure 128: Israel GDP and Population, 2023-2030 ($)
Figure 129: Israel GDP – Composition of 2023, By Sector of Origin
Figure 130: Israel Export and Import Value & Volume, 2023-2030 ($)
Figure 131: Entropy Share, By Strategies, 2023-2030* (%)Cable Management System Market
Figure 132: Developments, 2023-2030*Cable Management System Market
Figure 133: Company 1 Cable Management System Market Net Revenue, By Years, 2023-2030* ($)
Figure 134: Company 1 Cable Management System Market Net Revenue Share, By Business segments, 2023 (%)
Figure 135: Company 1 Cable Management System Market Net Sales Share, By Geography, 2023 (%)
Figure 136: Company 2 Cable Management System Market Net Revenue, By Years, 2023-2030* ($)
Figure 137: Company 2 Cable Management System Market Net Revenue Share, By Business segments, 2023 (%)
Figure 138: Company 2 Cable Management System Market Net Sales Share, By Geography, 2023 (%)
Figure 139: Company 3Cable Management System Market Net Revenue, By Years, 2023-2030* ($)
Figure 140: Company 3Cable Management System Market Net Revenue Share, By Business segments, 2023 (%)
Figure 141: Company 3Cable Management System Market Net Sales Share, By Geography, 2023 (%)
Figure 142: Company 4 Cable Management System Market Net Revenue, By Years, 2023-2030* ($)
Figure 143: Company 4 Cable Management System Market Net Revenue Share, By Business segments, 2023 (%)
Figure 144: Company 4 Cable Management System Market Net Sales Share, By Geography, 2023 (%)
Figure 145: Company 5 Cable Management System Market Net Revenue, By Years, 2023-2030* ($)
Figure 146: Company 5 Cable Management System Market Net Revenue Share, By Business segments, 2023 (%)
Figure 147: Company 5 Cable Management System Market Net Sales Share, By Geography, 2023 (%)
Figure 148: Company 6 Cable Management System Market Net Revenue, By Years, 2023-2030* ($)
Figure 149: Company 6 Cable Management System Market Net Revenue Share, By Business segments, 2023 (%)
Figure 150: Company 6 Cable Management System Market Net Sales Share, By Geography, 2023 (%)
Figure 151: Company 7 Cable Management System Market Net Revenue, By Years, 2023-2030* ($)
Figure 152: Company 7 Cable Management System Market Net Revenue Share, By Business segments, 2023 (%)
Figure 153: Company 7 Cable Management System Market Net Sales Share, By Geography, 2023 (%)
Figure 154: Company 8 Cable Management System Market Net Revenue, By Years, 2023-2030* ($)
Figure 155: Company 8 Cable Management System Market Net Revenue Share, By Business segments, 2023 (%)
Figure 156: Company 8 Cable Management System Market Net Sales Share, By Geography, 2023 (%)
Figure 157: Company 9 Cable Management System Market Net Revenue, By Years, 2023-2030* ($)
Figure 158: Company 9 Cable Management System Market Net Revenue Share, By Business segments, 2023 (%)
Figure 159: Company 9 Cable Management System Market Net Sales Share, By Geography, 2023 (%)
Figure 160: Company 10 Cable Management System Market Net Revenue, By Years, 2023-2030* ($)
Figure 161: Company 10 Cable Management System Market Net Revenue Share, By Business segments, 2023 (%)
Figure 162: Company 10 Cable Management System Market Net Sales Share, By Geography, 2023 (%)
Figure 163: Company 11 Cable Management System Market Net Revenue, By Years, 2023-2030* ($)
Figure 164: Company 11 Cable Management System Market Net Revenue Share, By Business segments, 2023 (%)
Figure 165: Company 11 Cable Management System Market Net Sales Share, By Geography, 2023 (%)
Figure 166: Company 12 Cable Management System Market Net Revenue, By Years, 2023-2030* ($)
Figure 167: Company 12 Cable Management System Market Net Revenue Share, By Business segments, 2023 (%)
Figure 168: Company 12 Cable Management System Market Net Sales Share, By Geography, 2023 (%)
Figure 169: Company 13Cable Management System Market Net Revenue, By Years, 2023-2030* ($)
Figure 170: Company 13Cable Management System Market Net Revenue Share, By Business segments, 2023 (%)
Figure 171: Company 13Cable Management System Market Net Sales Share, By Geography, 2023 (%)
Figure 172: Company 14 Cable Management System Market Net Revenue, By Years, 2023-2030* ($)
Figure 173: Company 14 Cable Management System Market Net Revenue Share, By Business segments, 2023 (%)
Figure 174: Company 14 Cable Management System Market Net Sales Share, By Geography, 2023 (%)
Figure 175: Company 15 Cable Management System Market Net Revenue, By Years, 2023-2030* ($)
Figure 176: Company 15 Cable Management System Market Net Revenue Share, By Business segments, 2023 (%)
Figure 177: Company 15 Cable Management System Market Net Sales Share, By Geography, 2023 (%)