 Email
Email Print
Print


Material Handling Equipment Market - Forecast(2024 - 2030)
Material Handling Equipment Market Overview:
Market Snapshot:

Material Handling Equipment Market - Report Coverage:
For More Details on This Report - Request for Sample
COVID-19 / Ukraine Crisis - Impact Analysis:
- The COVID-19 pandemic has had a significant impact on the material handling equipment market. Initially, the market experienced disruptions in production and supply chains due to lockdowns and restrictions imposed to curb the spread of the virus. However, as businesses adapted to remote work and e-commerce surged, demand for material handling equipment increased, particularly in sectors like logistics, warehousing, and healthcare. Companies focused on enhancing automation and implementing contactless solutions to ensure operational continuity and safety. Additionally, the pandemic accelerated trends like online shopping and omnichannel retailing, driving the need for advanced material handling equipment to support efficient order fulfillment and distribution processes amidst changing consumer behaviors.
- The Russia-Ukraine crisis could impact the material handling equipment market in various ways. Both countries are significant producers of raw materials such as steel and metals, which are essential for manufacturing material handling equipment. Any disruptions in the supply chain due to the conflict could lead to shortages and price volatility in these key materials, affecting production costs and availability of equipment. Moreover, geopolitical tensions may disrupt trade routes and logistics, further complicating supply chains. This instability could prompt manufacturers to explore alternative sourcing strategies or adjust pricing, potentially impacting market dynamics and profitability amidst the uncertainty caused by the crisis.
Key Takeaways:
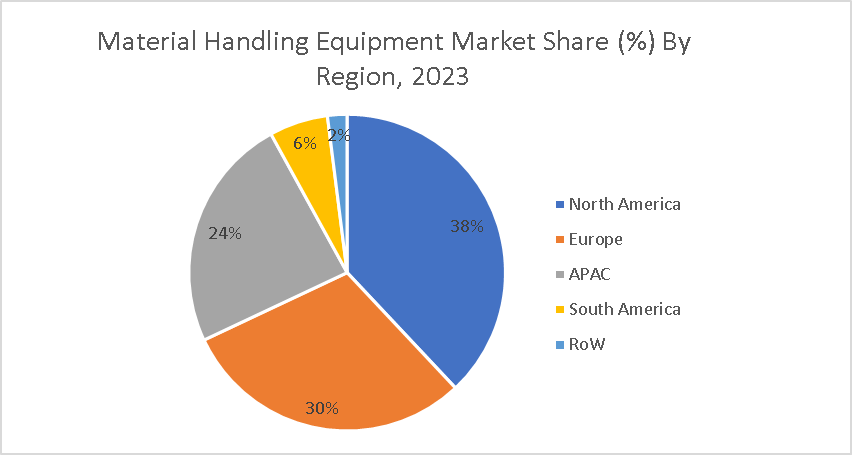
- North America stands as the highest growing geographic market in the material handling equipment market due to several factors. With a robust manufacturing sector, increasing investments in warehouse automation, and a growing e-commerce industry, there's a heightened demand for material handling equipment in the region. Additionally, stringent regulations regarding workplace safety and efficiency further drive the adoption of advanced handling solutions, positioning North America as a key driver of market growth.
- Industrial trucks and lifts emerge as the highest growing equipment type in the material handling equipment market due to their versatility and essential role in various industries. These include forklifts, pallet trucks, reach trucks, and stackers, which are crucial for transporting, lifting, and stacking goods within warehouses, distribution centers, and manufacturing facilities. The increasing adoption of automation and robotics in material handling also drives the demand for advanced industrial trucks and lifts.
- Manufacturing emerges as the highest growing end-use industry in the material handling equipment market due to globalization, automation, and the need for efficiency. Material handling equipment optimizes production processes by facilitating the movement and storage of goods. With increasing demand for diverse products, manufacturers prioritize efficient handling solutions to streamline operations and enhance productivity.
Material Handling Equipment Market Segment Analysis – By Technology
Material Handling Equipment Market Segment Analysis – By Equipment Type
Material Handling Equipment Market Segment Analysis – By End Use Industry
Material Handling Equipment Market Segment Analysis – By Geography
Material Handling Equipment Market Drivers
Focus on Warehouse Optimization
Adoption of Automation and Robotics in Material Handling
Material Handling Equipment Market Challenges
The Rapid Pace of Technological Advancements in Material Handling
Market Landscape
Developments:
- Caterpillar Inc. recently showcased its progress in sustainable solutions at CES 2024 in January. This highlights their focus on electrification and emissions reduction alongside their traditional offerings. With Cat Microgrid technology incorporating solar panels, emphasizes their continued development in clean energy solutions.
- Toyota Industries Corporation recently developed the world's first single-coat hard coating for plastic vehicle windshields that meets international standards. This innovation, announced in late 2023, could improve scratch resistance and durability for plastic windshields, potentially becoming a lighter and more affordable alternative in car manufacturing.
List of Tables
Table 1 Material Handling Equipment Market Overview 2023-2030
Table 2 Material Handling Equipment Market Leader Analysis 2023-2030 (US$)
Table 3 Material Handling Equipment MarketProduct Analysis 2023-2030 (US$)
Table 4 Material Handling Equipment MarketEnd User Analysis 2023-2030 (US$)
Table 5 Material Handling Equipment MarketPatent Analysis 2013-2023* (US$)
Table 6 Material Handling Equipment MarketFinancial Analysis 2023-2030 (US$)
Table 7 Material Handling Equipment Market Driver Analysis 2023-2030 (US$)
Table 8 Material Handling Equipment MarketChallenges Analysis 2023-2030 (US$)
Table 9 Material Handling Equipment MarketConstraint Analysis 2023-2030 (US$)
Table 10 Material Handling Equipment Market Supplier Bargaining Power Analysis 2023-2030 (US$)
Table 11 Material Handling Equipment Market Buyer Bargaining Power Analysis 2023-2030 (US$)
Table 12 Material Handling Equipment Market Threat of Substitutes Analysis 2023-2030 (US$)
Table 13 Material Handling Equipment Market Threat of New Entrants Analysis 2023-2030 (US$)
Table 14 Material Handling Equipment Market Degree of Competition Analysis 2023-2030 (US$)
Table 15 Material Handling Equipment MarketValue Chain Analysis 2023-2030 (US$)
Table 16 Material Handling Equipment MarketPricing Analysis 2023-2030 (US$)
Table 17 Material Handling Equipment MarketOpportunities Analysis 2023-2030 (US$)
Table 18 Material Handling Equipment MarketProduct Life Cycle Analysis 2023-2030 (US$)
Table 19 Material Handling Equipment MarketSupplier Analysis 2023-2030 (US$)
Table 20 Material Handling Equipment MarketDistributor Analysis 2023-2030 (US$)
Table 21 Material Handling Equipment Market Trend Analysis 2023-2030 (US$)
Table 22 Material Handling Equipment Market Size 2023 (US$)
Table 23 Material Handling Equipment Market Forecast Analysis 2023-2030 (US$)
Table 24 Material Handling Equipment Market Sales Forecast Analysis 2023-2030 (Units)
Table 25 Material Handling Equipment Market, Revenue & Volume,By End-use Industry, 2023-2030 ($)
Table 26 Material Handling Equipment MarketBy End-use Industry, Revenue & Volume,By Aerospace, 2023-2030 ($)
Table 27 Material Handling Equipment MarketBy End-use Industry, Revenue & Volume,By Agriculture, 2023-2030 ($)
Table 28 Material Handling Equipment MarketBy End-use Industry, Revenue & Volume,By Air Cargo, 2023-2030 ($)
Table 29 Material Handling Equipment MarketBy End-use Industry, Revenue & Volume,By Automotive, 2023-2030 ($)
Table 30 Material Handling Equipment MarketBy End-use Industry, Revenue & Volume,By Building and Construction, 2023-2030 ($)
Table 31 North America Material Handling Equipment Market, Revenue & Volume,By End-use Industry, 2023-2030 ($)
Table 32 South america Material Handling Equipment Market, Revenue & Volume,By End-use Industry, 2023-2030 ($)
Table 33 Europe Material Handling Equipment Market, Revenue & Volume,By End-use Industry, 2023-2030 ($)
Table 34 APAC Material Handling Equipment Market, Revenue & Volume,By End-use Industry, 2023-2030 ($)
Table 35 Middle East & Africa Material Handling Equipment Market, Revenue & Volume,By End-use Industry, 2023-2030 ($)
Table 36 Russia Material Handling Equipment Market, Revenue & Volume,By End-use Industry, 2023-2030 ($)
Table 37 Israel Material Handling Equipment Market, Revenue & Volume,By End-use Industry, 2023-2030 ($)
Table 38 Top Companies 2023 (US$)Material Handling Equipment Market, Revenue & Volume,,
Table 39 Product Launch 2023-2030Material Handling Equipment Market, Revenue & Volume,,
Table 40 Mergers & Acquistions 2023-2030Material Handling Equipment Market, Revenue & Volume,,
List of Figures
Figure 1 Overview of Material Handling Equipment Market 2023-2030
Figure 2 Market Share Analysis for Material Handling Equipment Market 2023 (US$)
Figure 3 Product Comparison in Material Handling Equipment Market 2023-2030 (US$)
Figure 4 End User Profile for Material Handling Equipment Market 2023-2030 (US$)
Figure 5 Patent Application and Grant in Material Handling Equipment Market 2013-2023* (US$)
Figure 6 Top 5 Companies Financial Analysis in Material Handling Equipment Market 2023-2030 (US$)
Figure 7 Market Entry Strategy in Material Handling Equipment Market 2023-2030
Figure 8 Ecosystem Analysis in Material Handling Equipment Market2023
Figure 9 Average Selling Price in Material Handling Equipment Market 2023-2030
Figure 10 Top Opportunites in Material Handling Equipment Market 2023-2030
Figure 11 Market Life Cycle Analysis in Material Handling Equipment Market
Figure 12 GlobalBy End-use IndustryMaterial Handling Equipment Market Revenue, 2023-2030 ($)
Figure 13 Global Material Handling Equipment Market - By Geography
Figure 14 Global Material Handling Equipment Market Value & Volume, By Geography, 2023-2030 ($)
Figure 15 Global Material Handling Equipment Market CAGR, By Geography, 2023-2030 (%)
Figure 16 North America Material Handling Equipment Market Value & Volume, 2023-2030 ($)
Figure 17 US Material Handling Equipment Market Value & Volume, 2023-2030 ($)
Figure 18 US GDP and Population, 2023-2030 ($)
Figure 19 US GDP – Composition of 2023, By Sector of Origin
Figure 20 US Export and Import Value & Volume, 2023-2030 ($)
Figure 21 Canada Material Handling Equipment Market Value & Volume, 2023-2030 ($)
Figure 22 Canada GDP and Population, 2023-2030 ($)
Figure 23 Canada GDP – Composition of 2023, By Sector of Origin
Figure 24 Canada Export and Import Value & Volume, 2023-2030 ($)
Figure 25 Mexico Material Handling Equipment Market Value & Volume, 2023-2030 ($)
Figure 26 Mexico GDP and Population, 2023-2030 ($)
Figure 27 Mexico GDP – Composition of 2023, By Sector of Origin
Figure 28 Mexico Export and Import Value & Volume, 2023-2030 ($)
Figure 29 South America Material Handling Equipment MarketSouth America 3D Printing Market Value & Volume, 2023-2030 ($)
Figure 30 Brazil Material Handling Equipment Market Value & Volume, 2023-2030 ($)
Figure 31 Brazil GDP and Population, 2023-2030 ($)
Figure 32 Brazil GDP – Composition of 2023, By Sector of Origin
Figure 33 Brazil Export and Import Value & Volume, 2023-2030 ($)
Figure 34 Venezuela Material Handling Equipment Market Value & Volume, 2023-2030 ($)
Figure 35 Venezuela GDP and Population, 2023-2030 ($)
Figure 36 Venezuela GDP – Composition of 2023, By Sector of Origin
Figure 37 Venezuela Export and Import Value & Volume, 2023-2030 ($)
Figure 38 Argentina Material Handling Equipment Market Value & Volume, 2023-2030 ($)
Figure 39 Argentina GDP and Population, 2023-2030 ($)
Figure 40 Argentina GDP – Composition of 2023, By Sector of Origin
Figure 41 Argentina Export and Import Value & Volume, 2023-2030 ($)
Figure 42 Ecuador Material Handling Equipment Market Value & Volume, 2023-2030 ($)
Figure 43 Ecuador GDP and Population, 2023-2030 ($)
Figure 44 Ecuador GDP – Composition of 2023, By Sector of Origin
Figure 45 Ecuador Export and Import Value & Volume, 2023-2030 ($)
Figure 46 Peru Material Handling Equipment Market Value & Volume, 2023-2030 ($)
Figure 47 Peru GDP and Population, 2023-2030 ($)
Figure 48 Peru GDP – Composition of 2023, By Sector of Origin
Figure 49 Peru Export and Import Value & Volume, 2023-2030 ($)
Figure 50 Colombia Material Handling Equipment Market Value & Volume, 2023-2030 ($)
Figure 51 Colombia GDP and Population, 2023-2030 ($)
Figure 52 Colombia GDP – Composition of 2023, By Sector of Origin
Figure 53 Colombia Export and Import Value & Volume, 2023-2030 ($)
Figure 54 Costa Rica Material Handling Equipment MarketCosta Rica 3D Printing Market Value & Volume, 2023-2030 ($)
Figure 55 Costa Rica GDP and Population, 2023-2030 ($)
Figure 56 Costa Rica GDP – Composition of 2023, By Sector of Origin
Figure 57 Costa Rica Export and Import Value & Volume, 2023-2030 ($)
Figure 58 Europe Material Handling Equipment Market Value & Volume, 2023-2030 ($)
Figure 59 U.K Material Handling Equipment Market Value & Volume, 2023-2030 ($)
Figure 60 U.K GDP and Population, 2023-2030 ($)
Figure 61 U.K GDP – Composition of 2023, By Sector of Origin
Figure 62 U.K Export and Import Value & Volume, 2023-2030 ($)
Figure 63 Germany Material Handling Equipment Market Value & Volume, 2023-2030 ($)
Figure 64 Germany GDP and Population, 2023-2030 ($)
Figure 65 Germany GDP – Composition of 2023, By Sector of Origin
Figure 66 Germany Export and Import Value & Volume, 2023-2030 ($)
Figure 67 Italy Material Handling Equipment Market Value & Volume, 2023-2030 ($)
Figure 68 Italy GDP and Population, 2023-2030 ($)
Figure 69 Italy GDP – Composition of 2023, By Sector of Origin
Figure 70 Italy Export and Import Value & Volume, 2023-2030 ($)
Figure 71 France Material Handling Equipment Market Value & Volume, 2023-2030 ($)
Figure 72 France GDP and Population, 2023-2030 ($)
Figure 73 France GDP – Composition of 2023, By Sector of Origin
Figure 74 France Export and Import Value & Volume, 2023-2030 ($)
Figure 75 Netherlands Material Handling Equipment Market Value & Volume, 2023-2030 ($)
Figure 76 Netherlands GDP and Population, 2023-2030 ($)
Figure 77 Netherlands GDP – Composition of 2023, By Sector of Origin
Figure 78 Netherlands Export and Import Value & Volume, 2023-2030 ($)
Figure 79 Belgium Material Handling Equipment Market Value & Volume, 2023-2030 ($)
Figure 80 Belgium GDP and Population, 2023-2030 ($)
Figure 81 Belgium GDP – Composition of 2023, By Sector of Origin
Figure 82 Belgium Export and Import Value & Volume, 2023-2030 ($)
Figure 83 Spain Material Handling Equipment Market Value & Volume, 2023-2030 ($)
Figure 84 Spain GDP and Population, 2023-2030 ($)
Figure 85 Spain GDP – Composition of 2023, By Sector of Origin
Figure 86 Spain Export and Import Value & Volume, 2023-2030 ($)
Figure 87 Denmark Material Handling Equipment Market Value & Volume, 2023-2030 ($)
Figure 88 Denmark GDP and Population, 2023-2030 ($)
Figure 89 Denmark GDP – Composition of 2023, By Sector of Origin
Figure 90 Denmark Export and Import Value & Volume, 2023-2030 ($)
Figure 91 APAC Material Handling Equipment Market Value & Volume, 2023-2030 ($)
Figure 92 China Material Handling Equipment MarketValue & Volume, 2023-2030
Figure 93 China GDP and Population, 2023-2030 ($)
Figure 94 China GDP – Composition of 2023, By Sector of Origin
Figure 95 China Export and Import Value & Volume, 2023-2030 ($)Material Handling Equipment MarketChina Export and Import Value & Volume, 2023-2030 ($)
Figure 96 Australia Material Handling Equipment Market Value & Volume, 2023-2030 ($)
Figure 97 Australia GDP and Population, 2023-2030 ($)
Figure 98 Australia GDP – Composition of 2023, By Sector of Origin
Figure 99 Australia Export and Import Value & Volume, 2023-2030 ($)
Figure 100 South Korea Material Handling Equipment Market Value & Volume, 2023-2030 ($)
Figure 101 South Korea GDP and Population, 2023-2030 ($)
Figure 102 South Korea GDP – Composition of 2023, By Sector of Origin
Figure 103 South Korea Export and Import Value & Volume, 2023-2030 ($)
Figure 104 India Material Handling Equipment Market Value & Volume, 2023-2030 ($)
Figure 105 India GDP and Population, 2023-2030 ($)
Figure 106 India GDP – Composition of 2023, By Sector of Origin
Figure 107 India Export and Import Value & Volume, 2023-2030 ($)
Figure 108 Taiwan Material Handling Equipment MarketTaiwan 3D Printing Market Value & Volume, 2023-2030 ($)
Figure 109 Taiwan GDP and Population, 2023-2030 ($)
Figure 110 Taiwan GDP – Composition of 2023, By Sector of Origin
Figure 111 Taiwan Export and Import Value & Volume, 2023-2030 ($)
Figure 112 Malaysia Material Handling Equipment MarketMalaysia 3D Printing Market Value & Volume, 2023-2030 ($)
Figure 113 Malaysia GDP and Population, 2023-2030 ($)
Figure 114 Malaysia GDP – Composition of 2023, By Sector of Origin
Figure 115 Malaysia Export and Import Value & Volume, 2023-2030 ($)
Figure 116 Hong Kong Material Handling Equipment MarketHong Kong 3D Printing Market Value & Volume, 2023-2030 ($)
Figure 117 Hong Kong GDP and Population, 2023-2030 ($)
Figure 118 Hong Kong GDP – Composition of 2023, By Sector of Origin
Figure 119 Hong Kong Export and Import Value & Volume, 2023-2030 ($)
Figure 120 Middle East & Africa Material Handling Equipment MarketMiddle East & Africa 3D Printing Market Value & Volume, 2023-2030 ($)
Figure 121 Russia Material Handling Equipment MarketRussia 3D Printing Market Value & Volume, 2023-2030 ($)
Figure 122 Russia GDP and Population, 2023-2030 ($)
Figure 123 Russia GDP – Composition of 2023, By Sector of Origin
Figure 124 Russia Export and Import Value & Volume, 2023-2030 ($)
Figure 125 Israel Material Handling Equipment Market Value & Volume, 2023-2030 ($)
Figure 126 Israel GDP and Population, 2023-2030 ($)
Figure 127 Israel GDP – Composition of 2023, By Sector of Origin
Figure 128 Israel Export and Import Value & Volume, 2023-2030 ($)
Figure 129 Entropy Share, By Strategies, 2023-2030* (%)Material Handling Equipment Market
Figure 130 Developments, 2023-2030*Material Handling Equipment Market
Figure 131 Company 1 Material Handling Equipment Market Net Revenue, By Years, 2023-2030* ($)
Figure 132 Company 1 Material Handling Equipment Market Net Revenue Share, By Business segments, 2023 (%)
Figure 133 Company 1 Material Handling Equipment Market Net Sales Share, By Geography, 2023 (%)
Figure 134 Company 2 Material Handling Equipment Market Net Revenue, By Years, 2023-2030* ($)
Figure 135 Company 2 Material Handling Equipment Market Net Revenue Share, By Business segments, 2023 (%)
Figure 136 Company 2 Material Handling Equipment Market Net Sales Share, By Geography, 2023 (%)
Figure 137 Company 3Material Handling Equipment Market Net Revenue, By Years, 2023-2030* ($)
Figure 138 Company 3Material Handling Equipment Market Net Revenue Share, By Business segments, 2023 (%)
Figure 139 Company 3Material Handling Equipment Market Net Sales Share, By Geography, 2023 (%)
Figure 140 Company 4 Material Handling Equipment Market Net Revenue, By Years, 2023-2030* ($)
Figure 141 Company 4 Material Handling Equipment Market Net Revenue Share, By Business segments, 2023 (%)
Figure 142 Company 4 Material Handling Equipment Market Net Sales Share, By Geography, 2023 (%)
Figure 143 Company 5 Material Handling Equipment Market Net Revenue, By Years, 2023-2030* ($)
Figure 144 Company 5 Material Handling Equipment Market Net Revenue Share, By Business segments, 2023 (%)
Figure 145 Company 5 Material Handling Equipment Market Net Sales Share, By Geography, 2023 (%)
Figure 146 Company 6 Material Handling Equipment Market Net Revenue, By Years, 2023-2030* ($)
Figure 147 Company 6 Material Handling Equipment Market Net Revenue Share, By Business segments, 2023 (%)
Figure 148 Company 6 Material Handling Equipment Market Net Sales Share, By Geography, 2023 (%)
Figure 149 Company 7 Material Handling Equipment Market Net Revenue, By Years, 2023-2030* ($)
Figure 150 Company 7 Material Handling Equipment Market Net Revenue Share, By Business segments, 2023 (%)
Figure 151 Company 7 Material Handling Equipment Market Net Sales Share, By Geography, 2023 (%)
Figure 152 Company 8 Material Handling Equipment Market Net Revenue, By Years, 2023-2030* ($)
Figure 153 Company 8 Material Handling Equipment Market Net Revenue Share, By Business segments, 2023 (%)
Figure 154 Company 8 Material Handling Equipment Market Net Sales Share, By Geography, 2023 (%)
Figure 155 Company 9 Material Handling Equipment Market Net Revenue, By Years, 2023-2030* ($)
Figure 156 Company 9 Material Handling Equipment Market Net Revenue Share, By Business segments, 2023 (%)
Figure 157 Company 9 Material Handling Equipment Market Net Sales Share, By Geography, 2023 (%)
Figure 158 Company 10 Material Handling Equipment Market Net Revenue, By Years, 2023-2030* ($)
Figure 159 Company 10 Material Handling Equipment Market Net Revenue Share, By Business segments, 2023 (%)
Figure 160 Company 10 Material Handling Equipment Market Net Sales Share, By Geography, 2023 (%)
Figure 161 Company 11 Material Handling Equipment Market Net Revenue, By Years, 2023-2030* ($)
Figure 162 Company 11 Material Handling Equipment Market Net Revenue Share, By Business segments, 2023 (%)
Figure 163 Company 11 Material Handling Equipment Market Net Sales Share, By Geography, 2023 (%)
Figure 164 Company 12 Material Handling Equipment Market Net Revenue, By Years, 2023-2030* ($)
Figure 165 Company 12 Material Handling Equipment Market Net Revenue Share, By Business segments, 2023 (%)
Figure 166 Company 12 Material Handling Equipment Market Net Sales Share, By Geography, 2023 (%)
Figure 167 Company 13Material Handling Equipment Market Net Revenue, By Years, 2023-2030* ($)
Figure 168 Company 13Material Handling Equipment Market Net Revenue Share, By Business segments, 2023 (%)
Figure 169 Company 13Material Handling Equipment Market Net Sales Share, By Geography, 2023 (%)
Figure 170 Company 14 Material Handling Equipment Market Net Revenue, By Years, 2023-2030* ($)
Figure 171 Company 14 Material Handling Equipment Market Net Revenue Share, By Business segments, 2023 (%)
Figure 172 Company 14 Material Handling Equipment Market Net Sales Share, By Geography, 2023 (%)
Figure 173 Company 15 Material Handling Equipment Market Net Revenue, By Years, 2023-2030* ($)
Figure 174 Company 15 Material Handling Equipment Market Net Revenue Share, By Business segments, 2023 (%)
Figure 175 Company 15 Material Handling Equipment Market Net Sales Share, By Geography, 2023 (%)