 Email
Email Print
Print


4K Display Resolution Market Analysis - Forecast(2024 - 2030)
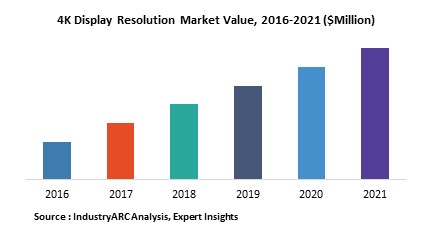
4K display resolution has 4,000 pixels of horizontal resolution Because of the high level of resolution, 4K products are used in aerospace & defense, healthcare, education, advertisement and in general consumer electronics. The high resolution allows individuals to view content in high detail. Looking at the advertising sector, 4K resolution displays are primarily used by many luxury brands for their advertisement purposes. The high resolution in the healthcare sector allows professionals to view medical images in high content where each and every section of the image is present in high quality. The chances of any blurred images are next to nil through 4K resolution and this is extremely important for viewing medical images. 4K TVs are present in the market today for general TV viewing purposes, however because of the high cost of the display, sales of 4K TVs are still in the early growth stages. Moreover, 4K content needs to be streamed in order to fully realize the potential of a 4K display which at the current stage is also in the early nascent stages.
The 4K Display Resolutions market can be segmented by the following products Smartphones, Tablets, PCs, Digital Cameras, TVs, Monitors, Others. In terms of applications, the 4K resolution display market has been segmented across the following Consumer Electronics, Gaming and Entertainment, Retail, Education, Healthcare, Aerospace and Defense, Others.
The Americas is expected to be the highest contributor to the market in the coming years, however, countries such as Japan and Korea in the APAC region are expected to see a very high penetration in the coming years. These two countries in particular have always been early adopters of high resolution display technology. Furthermore, the key companies which manufacture these displays are from the APAC region. The market has been segmented based on the following geographies APAC, Europe, Middle East and Africa, North America, South America.
The market consists of participants that have been operating in the display market for quite some time and already have a good stronghold over the overall display market.
Some of players operating in the market are listed below:
- AU Optronics Corp
- EIZO Corporation
- LG Electronics
- Panasonic Corporation
- Samsung Electronics Co., Ltd.
1. 4K Display Resolution Market - Overview
1.1. Definitions and Scope
2. 4K Display Resolution Market - Executive summary
2.1. Market Revenue, Market Size and Key Trends by Company
2.2. Key Trends by type of Application
2.3. Key Trends segmented by Geography
3. 4K Display Resolution Market
3.1. Comparative analysis
3.1.1. Product Benchmarking - Top 10 companies
3.1.2. Top 5 Financials Analysis
3.1.3. Market Value split by Top 10 companies
3.1.4. Patent Analysis - Top 10 companies
3.1.5. Pricing Analysis
4. 4K Display Resolution Market – Startup companies Scenario Premium
4.1. Top 10 startup company Analysis by
4.1.1. Investment
4.1.2. Revenue
4.1.3. Market Shares
4.1.4. Market Size and Application Analysis
4.1.5. Venture Capital and Funding Scenario
5. 4K Display Resolution Market – Industry Market Entry Scenario Premium
5.1. Regulatory Framework Overview
5.2. New Business and Ease of Doing business index
5.3. Case studies of successful ventures
5.4. Customer Analysis – Top 10 companies
6. 4K Display Resolution Market Forces
6.1. Drivers
6.2. Constraints
6.3. Challenges
6.4. Porters five force model
6.4.1. Bargaining power of suppliers
6.4.2. Bargaining powers of customers
6.4.3. Threat of new entrants
6.4.4. Rivalry among existing players
6.4.5. Threat of substitutes
7. 4K Display Resolution Market - Strategic analysis
7.1. Value chain analysis
7.2. Opportunities analysis
7.3. Product life cycle
7.4. Suppliers and distributors Market Share
8. 4K Display Resolution Market – By Resolution (Market Size -$Million / $Billion)
8.1. Market Size and Market Share Analysis
8.2. Application Revenue and Trend Research
8.3. Product Segment Analysis
8.3.1. 3840 X2160
8.3.2. 4096x2160
8.3.3. 3996x2160
8.3.4. 5120x3200
8.3.5. 5120x2160
8.3.6. Others
9. 4K Display Resolution Market – By Product (Market Size -$Million / $Billion)
9.1. Smartphones
9.2. Tablets
9.3. PCs
9.4. Digital Cameras
9.5. TVs
9.6. Monitors
9.7. Others
10. 4K Display Resolution Market – By Application (Market Size -$Million / $Billion)
10.1. Consumer Electronics
10.2. Gaming and Entertainment
10.3. Retail
10.4. Education
10.5. Healthcare
10.6. Aerospace and Defense
10.7. Others
11. 4K Display Resolution - By Geography (Market Size -$Million / $Billion)
11.1. 4K Display Resolution Market - North America Segment Research
11.2. North America Market Research (Million / $Billion)
11.2.1. Segment type Size and Market Size Analysis
11.2.2. Revenue and Trends
11.2.3. Application Revenue and Trends by type of Application
11.2.4. Company Revenue and Product Analysis
11.2.5. North America Product type and Application Market Size
11.2.5.1. U.S.
11.2.5.2. Canada
11.2.5.3. Mexico
11.2.5.4. Rest of North America
11.3. 4K Display Resolution - South America Segment Research
11.4. South America Market Research (Market Size -$Million / $Billion)
11.4.1. Segment type Size and Market Size Analysis
11.4.2. Revenue and Trends
11.4.3. Application Revenue and Trends by type of Application
11.4.4. Company Revenue and Product Analysis
11.4.5. South America Product type and Application Market Size
11.4.5.1. Brazil
11.4.5.2. Venezuela
11.4.5.3. Argentina
11.4.5.4. Ecuador
11.4.5.5. Peru
11.4.5.6. Colombia
11.4.5.7. Costa Rica
11.4.5.8. Rest of South America
11.5. 4K Display Resolution - Europe Segment Research
11.6. Europe Market Research (Market Size -$Million / $Billion)
11.6.1. Segment type Size and Market Size Analysis
11.6.2. Revenue and Trends
11.6.3. Application Revenue and Trends by type of Application
11.6.4. Company Revenue and Product Analysis
11.6.5. Europe Segment Product type and Application Market Size
11.6.5.1. U.K
11.6.5.2. Germany
11.6.5.3. Italy
11.6.5.4. France
11.6.5.5. Netherlands
11.6.5.6. Belgium
11.6.5.7. Spain
11.6.5.8. Denmark
11.6.5.9. Rest of Europe
11.7. 4K Display Resolution – APAC Segment Research
11.8. APAC Market Research (Market Size -$Million / $Billion)
11.8.1. Segment type Size and Market Size Analysis
11.8.2. Revenue and Trends
11.8.3. Application Revenue and Trends by type of Application
11.8.4. Company Revenue and Product Analysis
11.8.5. APAC Segment – Product type and Application Market Size
11.8.5.1. China
11.8.5.2. Australia
11.8.5.3. Japan
11.8.5.4. South Korea
11.8.5.5. India
11.8.5.6. Taiwan
11.8.5.7. Malaysia
12. 4K Display Resolution Market - Entropy
12.1. New product launches
12.2. M&A's, collaborations, JVs and partnerships
13. 4K Display Resolution Market – Industry / Segment Competition landscape Premium
13.1. Market Share Analysis
13.1.1. Market Share by Country- Top companies
13.1.2. Market Share by Region- Top 10 companies
13.1.3. Market Share by type of Application – Top 10 companies
13.1.4. Market Share by type of Product / Product category- Top 10 companies
13.1.5. Market Share at global level- Top 10 companies
13.1.6. Best Practises for companies
14. 4K Display Resolution Market – Key Company List by Country Premium
15. 4K Display Resolution Market Company Analysis
15.1. Market Share, Company Revenue, Products, M&A, Developments
15.2. AU Optronics Corp
15.3. EIZO Corporation
15.4. LG Electronics
15.5. Panasonic Corporation
15.6. Samsung Electronics Co., Ltd
15.7. Company 6
15.8. Company 7
15.9. Company 8
15.10. Company 9
14.11. Company 10
14.12. Company 11
14.13. Company 12
14.14. Company 13
14.15. Company 14 and more
"*Financials would be provided on a best efforts basis for private companies"
16. 4K Display Resolution Market - Appendix
16.1. Abbreviations
16.2. Sources
17. 4K Display Resolution Market - Methodology
17.1. Research Methodology
17.1.1. Company Expert Interviews
17.1.2. Industry Databases
17.1.3. Associations
17.1.4. Company News
17.1.5. Company Annual Reports
17.1.6. Application Trends
17.1.7. New Products and Product database
17.1.8. Company Transcripts
17.1.9. R&D Trends
17.1.10. Key Opinion Leaders Interviews
17.1.11. Supply and Demand Trends
List of Tables
Table1 4K Display Resolution Market Overview 2023-2030
Table2 4K Display Resolution Market Leader Analysis 2023-2030 (US$)
Table3 4K Display Resolution MarketProduct Analysis 2023-2030 (US$)
Table4 4K Display Resolution MarketEnd User Analysis 2023-2030 (US$)
Table5 4K Display Resolution MarketPatent Analysis 2013-2023* (US$)
Table6 4K Display Resolution MarketFinancial Analysis 2023-2030 (US$)
Table7 4K Display Resolution Market Driver Analysis 2023-2030 (US$)
Table8 4K Display Resolution MarketChallenges Analysis 2023-2030 (US$)
Table9 4K Display Resolution MarketConstraint Analysis 2023-2030 (US$)
Table10 4K Display Resolution Market Supplier Bargaining Power Analysis 2023-2030 (US$)
Table11 4K Display Resolution Market Buyer Bargaining Power Analysis 2023-2030 (US$)
Table12 4K Display Resolution Market Threat of Substitutes Analysis 2023-2030 (US$)
Table13 4K Display Resolution Market Threat of New Entrants Analysis 2023-2030 (US$)
Table14 4K Display Resolution Market Degree of Competition Analysis 2023-2030 (US$)
Table15 4K Display Resolution MarketValue Chain Analysis 2023-2030 (US$)
Table16 4K Display Resolution MarketPricing Analysis 2023-2030 (US$)
Table17 4K Display Resolution MarketOpportunities Analysis 2023-2030 (US$)
Table18 4K Display Resolution MarketProduct Life Cycle Analysis 2023-2030 (US$)
Table19 4K Display Resolution MarketSupplier Analysis 2023-2030 (US$)
Table20 4K Display Resolution MarketDistributor Analysis 2023-2030 (US$)
Table21 4K Display Resolution Market Trend Analysis 2023-2030 (US$)
Table22 4K Display Resolution Market Size 2023 (US$)
Table23 4K Display Resolution Market Forecast Analysis 2023-2030 (US$)
Table24 4K Display Resolution Market Sales Forecast Analysis 2023-2030 (Units)
Table25 4K Display Resolution Market, Revenue & Volume,By Resolution, 2023-2030 ($)
Table26 4K Display Resolution MarketBy Resolution, Revenue & Volume,By 3840 X2160 , 2023-2030 ($)
Table27 4K Display Resolution MarketBy Resolution, Revenue & Volume,By 4096x2160, 2023-2030 ($)
Table28 4K Display Resolution MarketBy Resolution, Revenue & Volume,By 3996x2160, 2023-2030 ($)
Table29 4K Display Resolution MarketBy Resolution, Revenue & Volume,By 5120x3200, 2023-2030 ($)
Table30 4K Display Resolution MarketBy Resolution, Revenue & Volume,By 5120x2160, 2023-2030 ($)
Table31 4K Display Resolution Market, Revenue & Volume,By Product, 2023-2030 ($)
Table32 4K Display Resolution MarketBy Product, Revenue & Volume,By Smartphones, 2023-2030 ($)
Table33 4K Display Resolution MarketBy Product, Revenue & Volume,By Tablets, 2023-2030 ($)
Table34 4K Display Resolution MarketBy Product, Revenue & Volume,By PCs, 2023-2030 ($)
Table35 4K Display Resolution MarketBy Product, Revenue & Volume,By Digital Cameras, 2023-2030 ($)
Table36 4K Display Resolution MarketBy Product, Revenue & Volume,By TVs, 2023-2030 ($)
Table37 4K Display Resolution Market, Revenue & Volume,By Application, 2023-2030 ($)
Table38 4K Display Resolution MarketBy Application, Revenue & Volume,By Consumer Electronics, 2023-2030 ($)
Table39 4K Display Resolution MarketBy Application, Revenue & Volume,By Gaming and Entertainment, 2023-2030 ($)
Table40 4K Display Resolution MarketBy Application, Revenue & Volume,By Retail, 2023-2030 ($)
Table41 4K Display Resolution MarketBy Application, Revenue & Volume,By Education, 2023-2030 ($)
Table42 4K Display Resolution MarketBy Application, Revenue & Volume,By Healthcare, 2023-2030 ($)
Table43 North America 4K Display Resolution Market, Revenue & Volume,By Resolution, 2023-2030 ($)
Table44 North America 4K Display Resolution Market, Revenue & Volume,By Product, 2023-2030 ($)
Table45 North America 4K Display Resolution Market, Revenue & Volume,By Application, 2023-2030 ($)
Table46 South america 4K Display Resolution Market, Revenue & Volume,By Resolution, 2023-2030 ($)
Table47 South america 4K Display Resolution Market, Revenue & Volume,By Product, 2023-2030 ($)
Table48 South america 4K Display Resolution Market, Revenue & Volume,By Application, 2023-2030 ($)
Table49 Europe 4K Display Resolution Market, Revenue & Volume,By Resolution, 2023-2030 ($)
Table50 Europe 4K Display Resolution Market, Revenue & Volume,By Product, 2023-2030 ($)
Table51 Europe 4K Display Resolution Market, Revenue & Volume,By Application, 2023-2030 ($)
Table52 APAC 4K Display Resolution Market, Revenue & Volume,By Resolution, 2023-2030 ($)
Table53 APAC 4K Display Resolution Market, Revenue & Volume,By Product, 2023-2030 ($)
Table54 APAC 4K Display Resolution Market, Revenue & Volume,By Application, 2023-2030 ($)
Table55 Middle East & Africa 4K Display Resolution Market, Revenue & Volume,By Resolution, 2023-2030 ($)
Table56 Middle East & Africa 4K Display Resolution Market, Revenue & Volume,By Product, 2023-2030 ($)
Table57 Middle East & Africa 4K Display Resolution Market, Revenue & Volume,By Application, 2023-2030 ($)
Table58 Russia 4K Display Resolution Market, Revenue & Volume,By Resolution, 2023-2030 ($)
Table59 Russia 4K Display Resolution Market, Revenue & Volume,By Product, 2023-2030 ($)
Table60 Russia 4K Display Resolution Market, Revenue & Volume,By Application, 2023-2030 ($)
Table61 Israel 4K Display Resolution Market, Revenue & Volume,By Resolution, 2023-2030 ($)
Table62 Israel 4K Display Resolution Market, Revenue & Volume,By Product, 2023-2030 ($)
Table63 Israel 4K Display Resolution Market, Revenue & Volume,By Application, 2023-2030 ($)
Table64 Top Companies 2023 (US$)4K Display Resolution Market, Revenue & Volume,,
Table65 Product Launch 2023-20304K Display Resolution Market, Revenue & Volume,,
Table66 Mergers & Acquistions 2023-20304K Display Resolution Market, Revenue & Volume,,
List of Figures
Figure 1 Overview of 4K Display Resolution Market 2023-2030
Figure 2 Market Share Analysis for 4K Display Resolution Market 2023 (US$)
Figure 3 Product Comparison in 4K Display Resolution Market 2023-2030 (US$)
Figure 4 End User Profile for 4K Display Resolution Market 2023-2030 (US$)
Figure 5 Patent Application and Grant in 4K Display Resolution Market 2013-2023* (US$)
Figure 6 Top 5 Companies Financial Analysis in 4K Display Resolution Market 2023-2030 (US$)
Figure 7 Market Entry Strategy in 4K Display Resolution Market 2023-2030
Figure 8 Ecosystem Analysis in 4K Display Resolution Market2023
Figure 9 Average Selling Price in 4K Display Resolution Market 2023-2030
Figure 10 Top Opportunites in 4K Display Resolution Market 2023-2030
Figure 11 Market Life Cycle Analysis in 4K Display Resolution Market
Figure 12 GlobalBy Resolution4K Display Resolution Market Revenue, 2023-2030 ($)
Figure 13 GlobalBy Product4K Display Resolution Market Revenue, 2023-2030 ($)
Figure 14 GlobalBy Application4K Display Resolution Market Revenue, 2023-2030 ($)
Figure 15 Global 4K Display Resolution Market - By Geography
Figure 16 Global 4K Display Resolution Market Value & Volume, By Geography, 2023-2030 ($)
Figure 17 Global 4K Display Resolution Market CAGR, By Geography, 2023-2030 (%)
Figure 18 North America 4K Display Resolution Market Value & Volume, 2023-2030 ($)
Figure 19 US 4K Display Resolution Market Value & Volume, 2023-2030 ($)
Figure 20 US GDP and Population, 2023-2030 ($)
Figure 21 US GDP – Composition of 2023, By Sector of Origin
Figure 22 US Export and Import Value & Volume, 2023-2030 ($)
Figure 23 Canada 4K Display Resolution Market Value & Volume, 2023-2030 ($)
Figure 24 Canada GDP and Population, 2023-2030 ($)
Figure 25 Canada GDP – Composition of 2023, By Sector of Origin
Figure 26 Canada Export and Import Value & Volume, 2023-2030 ($)
Figure 27 Mexico 4K Display Resolution Market Value & Volume, 2023-2030 ($)
Figure 28 Mexico GDP and Population, 2023-2030 ($)
Figure 29 Mexico GDP – Composition of 2023, By Sector of Origin
Figure 30 Mexico Export and Import Value & Volume, 2023-2030 ($)
Figure 31 South America 4K Display Resolution MarketSouth America 3D Printing Market Value & Volume, 2023-2030 ($)
Figure 32 Brazil 4K Display Resolution Market Value & Volume, 2023-2030 ($)
Figure 33 Brazil GDP and Population, 2023-2030 ($)
Figure 34 Brazil GDP – Composition of 2023, By Sector of Origin
Figure 35 Brazil Export and Import Value & Volume, 2023-2030 ($)
Figure 36 Venezuela 4K Display Resolution Market Value & Volume, 2023-2030 ($)
Figure 37 Venezuela GDP and Population, 2023-2030 ($)
Figure 38 Venezuela GDP – Composition of 2023, By Sector of Origin
Figure 39 Venezuela Export and Import Value & Volume, 2023-2030 ($)
Figure 40 Argentina 4K Display Resolution Market Value & Volume, 2023-2030 ($)
Figure 41 Argentina GDP and Population, 2023-2030 ($)
Figure 42 Argentina GDP – Composition of 2023, By Sector of Origin
Figure 43 Argentina Export and Import Value & Volume, 2023-2030 ($)
Figure 44 Ecuador 4K Display Resolution Market Value & Volume, 2023-2030 ($)
Figure 45 Ecuador GDP and Population, 2023-2030 ($)
Figure 46 Ecuador GDP – Composition of 2023, By Sector of Origin
Figure 47 Ecuador Export and Import Value & Volume, 2023-2030 ($)
Figure 48 Peru 4K Display Resolution Market Value & Volume, 2023-2030 ($)
Figure 49 Peru GDP and Population, 2023-2030 ($)
Figure 50 Peru GDP – Composition of 2023, By Sector of Origin
Figure 51 Peru Export and Import Value & Volume, 2023-2030 ($)
Figure 52 Colombia 4K Display Resolution Market Value & Volume, 2023-2030 ($)
Figure 53 Colombia GDP and Population, 2023-2030 ($)
Figure 54 Colombia GDP – Composition of 2023, By Sector of Origin
Figure 55 Colombia Export and Import Value & Volume, 2023-2030 ($)
Figure 56 Costa Rica 4K Display Resolution MarketCosta Rica 3D Printing Market Value & Volume, 2023-2030 ($)
Figure 57 Costa Rica GDP and Population, 2023-2030 ($)
Figure 58 Costa Rica GDP – Composition of 2023, By Sector of Origin
Figure 59 Costa Rica Export and Import Value & Volume, 2023-2030 ($)
Figure 60 Europe 4K Display Resolution Market Value & Volume, 2023-2030 ($)
Figure 61 U.K 4K Display Resolution Market Value & Volume, 2023-2030 ($)
Figure 62 U.K GDP and Population, 2023-2030 ($)
Figure 63 U.K GDP – Composition of 2023, By Sector of Origin
Figure 64 U.K Export and Import Value & Volume, 2023-2030 ($)
Figure 65 Germany 4K Display Resolution Market Value & Volume, 2023-2030 ($)
Figure 66 Germany GDP and Population, 2023-2030 ($)
Figure 67 Germany GDP – Composition of 2023, By Sector of Origin
Figure 68 Germany Export and Import Value & Volume, 2023-2030 ($)
Figure 69 Italy 4K Display Resolution Market Value & Volume, 2023-2030 ($)
Figure 70 Italy GDP and Population, 2023-2030 ($)
Figure 71 Italy GDP – Composition of 2023, By Sector of Origin
Figure 72 Italy Export and Import Value & Volume, 2023-2030 ($)
Figure 73 France 4K Display Resolution Market Value & Volume, 2023-2030 ($)
Figure 74 France GDP and Population, 2023-2030 ($)
Figure 75 France GDP – Composition of 2023, By Sector of Origin
Figure 76 France Export and Import Value & Volume, 2023-2030 ($)
Figure 77 Netherlands 4K Display Resolution Market Value & Volume, 2023-2030 ($)
Figure 78 Netherlands GDP and Population, 2023-2030 ($)
Figure 79 Netherlands GDP – Composition of 2023, By Sector of Origin
Figure 80 Netherlands Export and Import Value & Volume, 2023-2030 ($)
Figure 81 Belgium 4K Display Resolution Market Value & Volume, 2023-2030 ($)
Figure 82 Belgium GDP and Population, 2023-2030 ($)
Figure 83 Belgium GDP – Composition of 2023, By Sector of Origin
Figure 84 Belgium Export and Import Value & Volume, 2023-2030 ($)
Figure 85 Spain 4K Display Resolution Market Value & Volume, 2023-2030 ($)
Figure 86 Spain GDP and Population, 2023-2030 ($)
Figure 87 Spain GDP – Composition of 2023, By Sector of Origin
Figure 88 Spain Export and Import Value & Volume, 2023-2030 ($)
Figure 89 Denmark 4K Display Resolution Market Value & Volume, 2023-2030 ($)
Figure 90 Denmark GDP and Population, 2023-2030 ($)
Figure 91 Denmark GDP – Composition of 2023, By Sector of Origin
Figure 92 Denmark Export and Import Value & Volume, 2023-2030 ($)
Figure 93 APAC 4K Display Resolution Market Value & Volume, 2023-2030 ($)
Figure 94 China 4K Display Resolution MarketValue & Volume, 2023-2030
Figure 95 China GDP and Population, 2023-2030 ($)
Figure 96 China GDP – Composition of 2023, By Sector of Origin
Figure 97 China Export and Import Value & Volume, 2023-2030 ($)4K Display Resolution MarketChina Export and Import Value & Volume, 2023-2030 ($)
Figure 98 Australia 4K Display Resolution Market Value & Volume, 2023-2030 ($)
Figure 99 Australia GDP and Population, 2023-2030 ($)
Figure 100 Australia GDP – Composition of 2023, By Sector of Origin
Figure 101 Australia Export and Import Value & Volume, 2023-2030 ($)
Figure 102 South Korea 4K Display Resolution Market Value & Volume, 2023-2030 ($)
Figure 103 South Korea GDP and Population, 2023-2030 ($)
Figure 104 South Korea GDP – Composition of 2023, By Sector of Origin
Figure 105 South Korea Export and Import Value & Volume, 2023-2030 ($)
Figure 106 India 4K Display Resolution Market Value & Volume, 2023-2030 ($)
Figure 107 India GDP and Population, 2023-2030 ($)
Figure 108 India GDP – Composition of 2023, By Sector of Origin
Figure 109 India Export and Import Value & Volume, 2023-2030 ($)
Figure 110 Taiwan 4K Display Resolution MarketTaiwan 3D Printing Market Value & Volume, 2023-2030 ($)
Figure 111 Taiwan GDP and Population, 2023-2030 ($)
Figure 112 Taiwan GDP – Composition of 2023, By Sector of Origin
Figure 113 Taiwan Export and Import Value & Volume, 2023-2030 ($)
Figure 114 Malaysia 4K Display Resolution MarketMalaysia 3D Printing Market Value & Volume, 2023-2030 ($)
Figure 115 Malaysia GDP and Population, 2023-2030 ($)
Figure 116 Malaysia GDP – Composition of 2023, By Sector of Origin
Figure 117 Malaysia Export and Import Value & Volume, 2023-2030 ($)
Figure 118 Hong Kong 4K Display Resolution MarketHong Kong 3D Printing Market Value & Volume, 2023-2030 ($)
Figure 119 Hong Kong GDP and Population, 2023-2030 ($)
Figure 120 Hong Kong GDP – Composition of 2023, By Sector of Origin
Figure 121 Hong Kong Export and Import Value & Volume, 2023-2030 ($)
Figure 122 Middle East & Africa 4K Display Resolution MarketMiddle East & Africa 3D Printing Market Value & Volume, 2023-2030 ($)
Figure 123 Russia 4K Display Resolution MarketRussia 3D Printing Market Value & Volume, 2023-2030 ($)
Figure 124 Russia GDP and Population, 2023-2030 ($)
Figure 125 Russia GDP – Composition of 2023, By Sector of Origin
Figure 126 Russia Export and Import Value & Volume, 2023-2030 ($)
Figure 127 Israel 4K Display Resolution Market Value & Volume, 2023-2030 ($)
Figure 128 Israel GDP and Population, 2023-2030 ($)
Figure 129 Israel GDP – Composition of 2023, By Sector of Origin
Figure 130 Israel Export and Import Value & Volume, 2023-2030 ($)
Figure 131 Entropy Share, By Strategies, 2023-2030* (%)4K Display Resolution Market
Figure 132 Developments, 2023-2030*4K Display Resolution Market
Figure 133 Company 1 4K Display Resolution Market Net Revenue, By Years, 2023-2030* ($)
Figure 134 Company 1 4K Display Resolution Market Net Revenue Share, By Business segments, 2023 (%)
Figure 135 Company 1 4K Display Resolution Market Net Sales Share, By Geography, 2023 (%)
Figure 136 Company 2 4K Display Resolution Market Net Revenue, By Years, 2023-2030* ($)
Figure 137 Company 2 4K Display Resolution Market Net Revenue Share, By Business segments, 2023 (%)
Figure 138 Company 2 4K Display Resolution Market Net Sales Share, By Geography, 2023 (%)
Figure 139 Company 34K Display Resolution Market Net Revenue, By Years, 2023-2030* ($)
Figure 140 Company 34K Display Resolution Market Net Revenue Share, By Business segments, 2023 (%)
Figure 141 Company 34K Display Resolution Market Net Sales Share, By Geography, 2023 (%)
Figure 142 Company 4 4K Display Resolution Market Net Revenue, By Years, 2023-2030* ($)
Figure 143 Company 4 4K Display Resolution Market Net Revenue Share, By Business segments, 2023 (%)
Figure 144 Company 4 4K Display Resolution Market Net Sales Share, By Geography, 2023 (%)
Figure 145 Company 5 4K Display Resolution Market Net Revenue, By Years, 2023-2030* ($)
Figure 146 Company 5 4K Display Resolution Market Net Revenue Share, By Business segments, 2023 (%)
Figure 147 Company 5 4K Display Resolution Market Net Sales Share, By Geography, 2023 (%)
Figure 148 Company 6 4K Display Resolution Market Net Revenue, By Years, 2023-2030* ($)
Figure 149 Company 6 4K Display Resolution Market Net Revenue Share, By Business segments, 2023 (%)
Figure 150 Company 6 4K Display Resolution Market Net Sales Share, By Geography, 2023 (%)
Figure 151 Company 7 4K Display Resolution Market Net Revenue, By Years, 2023-2030* ($)
Figure 152 Company 7 4K Display Resolution Market Net Revenue Share, By Business segments, 2023 (%)
Figure 153 Company 7 4K Display Resolution Market Net Sales Share, By Geography, 2023 (%)
Figure 154 Company 8 4K Display Resolution Market Net Revenue, By Years, 2023-2030* ($)
Figure 155 Company 8 4K Display Resolution Market Net Revenue Share, By Business segments, 2023 (%)
Figure 156 Company 8 4K Display Resolution Market Net Sales Share, By Geography, 2023 (%)
Figure 157 Company 9 4K Display Resolution Market Net Revenue, By Years, 2023-2030* ($)
Figure 158 Company 9 4K Display Resolution Market Net Revenue Share, By Business segments, 2023 (%)
Figure 159 Company 9 4K Display Resolution Market Net Sales Share, By Geography, 2023 (%)
Figure 160 Company 10 4K Display Resolution Market Net Revenue, By Years, 2023-2030* ($)
Figure 161 Company 10 4K Display Resolution Market Net Revenue Share, By Business segments, 2023 (%)
Figure 162 Company 10 4K Display Resolution Market Net Sales Share, By Geography, 2023 (%)
Figure 163 Company 11 4K Display Resolution Market Net Revenue, By Years, 2023-2030* ($)
Figure 164 Company 11 4K Display Resolution Market Net Revenue Share, By Business segments, 2023 (%)
Figure 165 Company 11 4K Display Resolution Market Net Sales Share, By Geography, 2023 (%)
Figure 166 Company 12 4K Display Resolution Market Net Revenue, By Years, 2023-2030* ($)
Figure 167 Company 12 4K Display Resolution Market Net Revenue Share, By Business segments, 2023 (%)
Figure 168 Company 12 4K Display Resolution Market Net Sales Share, By Geography, 2023 (%)
Figure 169 Company 134K Display Resolution Market Net Revenue, By Years, 2023-2030* ($)
Figure 170 Company 134K Display Resolution Market Net Revenue Share, By Business segments, 2023 (%)
Figure 171 Company 134K Display Resolution Market Net Sales Share, By Geography, 2023 (%)
Figure 172 Company 14 4K Display Resolution Market Net Revenue, By Years, 2023-2030* ($)
Figure 173 Company 14 4K Display Resolution Market Net Revenue Share, By Business segments, 2023 (%)
Figure 174 Company 14 4K Display Resolution Market Net Sales Share, By Geography, 2023 (%)
Figure 175 Company 15 4K Display Resolution Market Net Revenue, By Years, 2023-2030* ($)
Figure 176 Company 15 4K Display Resolution Market Net Revenue Share, By Business segments, 2023 (%)
Figure 177 Company 15 4K Display Resolution Market Net Sales Share, By Geography, 2023 (%)