 Email
Email Print
Print


Passive Infrared Sensors Market - Forecast(2024 - 2030)
Passive Infrared Sensors Market Overview:
Passive Infrared Sensors Market size is forecast to reach $1.3 Billion by 2030, after growing at a CAGR of 15% during 2024-2030. This growth is driven as the passive infrared (PIR) sensors market faces the expansion of application areas. PIR sensors are increasingly deployed across diverse domains, including security alarms and automatic lighting systems. Their ability to detect the presence of humans, animals, and objects in proximity, coupled with features like low energy consumption, reliability, and day-and-night motion detection, enhances their appeal. Moreover, their cost-effectiveness and compact design contribute to their growing adoption in various sectors, reflecting a trend towards broader utilization of PIR sensors beyond traditional applications.
Additionally, the increasing demand from the consumer electronics industry and ongoing technological advancements. The rapid expansion of consumer electronics has spurred the need for PIR sensors in gadgets and appliances for both residential and commercial use. And continuous technological advancements in PIR sensor technology have broadened their applications to include gas analysis, fire detection, motion sensors, and non-contact temperature measurement. These trends reflect the growing importance of PIR sensors across various industries, fueling market growth and innovation in sensor technology.
Market Snapshot:

Passive Infrared Sensors Market - Report Coverage:
The “Passive Infrared Sensors Market Report - Forecast (2024-2030)” by IndustryARC, covers an in-depth analysis of the following segments in the Passive Infrared Sensors Market.
By Type: Wired PIR Sensors, Wireless PIR Sensors.
By Coverage Range: Short-Range PIR Sensors, Medium-Range PIR Sensors, Long-Range PIR Sensors
By Technology: Single Element PIR Sensors, Dual Element PIR Sensors, Quad Element PIR Sensors, Others
By Application: Residential, Commercial, Industrial, Automotive, Aerospace and Defense, Healthcare, Others
By End Use Industry: Building Automation, Security and Surveillance, Lighting Control, HVAC Control, Energy Management, Consumer Electronics, Automotive, Others.
By Geography: North America, South America, Europe, APAC, and RoW.
COVID-19 / Ukraine Crisis - Impact Analysis:
- The COVID-19 pandemic has had a mixed impact on the passive infrared (PIR) sensors market. While the initial lockdowns and disruptions to manufacturing and supply chains temporarily slowed market growth, the subsequent shift towards remote working, e-learning, and increased emphasis on contactless solutions have accelerated the adoption of PIR sensors in various applications such as occupancy sensing, security, and healthcare. Additionally, the pandemic has heightened awareness about the importance of hygiene and safety, leading to increased demand for PIR sensors in touchless faucets, automatic doors, and occupancy monitoring systems, driving market growth amidst the crisis.
- The Russia-Ukraine crisis has impacted the passive infrared (PIR) sensors market through disruptions in the global supply chain and fluctuations in raw material prices. Both countries are significant producers of materials used in sensor manufacturing. Any disruption in the supply of these materials could lead to shortages and price hikes, affecting production and pricing in the PIR sensors market. Additionally, geopolitical tensions may create uncertainty in the business environment, influencing investment decisions and market growth. Manufacturers should closely monitor the situation and adapt their strategies to mitigate potential risks posed by the Russia-Ukraine crisis
Key Takeaways:
- Asia Pacific stands as the highest growing geographical market in the passive infrared (PIR) sensors segment due to rapid urbanization, industrialization, and smart infrastructure developments. Countries like China, India, and Southeast Asian nations drive the demand for PIR sensors across various sectors. With increasing investments in smart homes, building automation, and IoT technologies, coupled with rising concerns about safety and security, Asia Pacific presents lucrative opportunities for PIR sensor manufacturers and suppliers.
- Wireless PIR sensors emerge as the fastest-growing type in the passive infrared (PIR) sensors market due to their flexibility and ease of installation. With the increasing adoption of smart home and IoT technologies, wireless PIR sensors offer convenient solutions for motion detection, security, and automation without the need for complex wiring. As consumers and businesses seek seamless integration and scalability, the demand for wireless PIR sensors continues to rise, driving market growth.
- Security and surveillance emerge as the fastest-growing end-use industry in the passive infrared (PIR) sensors market due to increasing concerns about safety and security. PIR sensors play a crucial role in intrusion detection, motion sensing, and occupancy detection in security systems. With advancements in sensor technology and rising demand for reliable security solutions, the security and surveillance sector presents significant growth opportunities for PIR sensor manufacturers.
Passive Infrared Sensors Market Segment Analysis – By Type
Wireless passive infrared (PIR) sensors are witnessing remarkable growth with a CAGR of 16.1% during forecast period 2024-2030 in the passive infrared sensors market due to their flexibility, ease of installation, and scalability. As the demand for smart home systems, building automation, and IoT solutions continues to rise, wireless PIR sensors offer a convenient solution for occupancy detection, security monitoring, and energy management without the need for complex wiring. Moreover, advancements in wireless communication technologies, such as Bluetooth Low Energy (BLE) and Zigbee, enable seamless integration of wireless PIR sensors with smart home platforms and IoT ecosystems. Furthermore, wireless PIR sensors cater to a wide range of applications, including residential, commercial, and industrial sectors, driving their adoption across diverse end-user segments. Their ability to provide real-time data, remote monitoring, and easy expansion make them an attractive choice for modern building management systems. With the ongoing trend toward wireless connectivity and smart automation, wireless PIR sensors are poised to experience continued growth and dominance in the passive infrared sensors market.
Passive Infrared Sensors Market Segment Analysis – By Coverage Range
Short-range passive infrared (PIR) sensors are experiencing significant growth with a CAGR of 15.8% during forecast period 2024-2030 in the market due to their versatility and applicability in various sectors. These sensors are commonly used for indoor applications such as occupancy sensing, security systems, and lighting control. As the demand for smart homes, smart buildings, and IoT devices rises, short-range PIR sensors play a crucial role in enabling automated systems to respond to human presence and movement accurately. Moreover, short-range PIR sensors are preferred for their cost-effectiveness, compact size, and low power consumption, making them suitable for integration into a wide range of consumer electronics and industrial applications. Their ability to detect motion within a limited distance provides reliable detection in confined spaces, enhancing safety and security measures. Additionally, advancements in sensor technology, including improved sensitivity, accuracy, and response time, further drive the adoption of short-range PIR sensors, positioning them as the highest-growing coverage range in the passive infrared sensors market.
Passive Infrared Sensors Market Segment Analysis – By Technology
Dual-element passive infrared (PIR) sensors are experiencing robust growth in the passive infrared sensors market with a CAGR of 16% during the forecast period 2024-2030. Unlike single-element sensors, dual-element PIR sensors employ two sensing elements arranged in a differential configuration, offering enhanced sensitivity and accuracy. This technology type is witnessing high demand due to its improved performance in detecting human presence while minimizing false alarms caused by environmental factors. Dual-element PIR sensors are widely used in security systems, smart lighting, and occupancy detection applications where reliability and precision are paramount. Moreover, advancements in dual-element PIR sensor technology, such as improved signal processing algorithms and integration with IoT platforms, further drive market growth. Additionally, the expansion of smart home and building automation systems, coupled with stringent safety and security regulations, fuels the adoption of dual-element PIR sensors. With their superior performance and versatility, dual-element PIR sensors are poised to continue dominating the market and meet the evolving demands of various industries and applications.
Passive Infrared Sensors Market Segment Analysis – By Application
Industrial applications emerge as the highest-growing segment in the passive infrared (PIR) sensors market with a CAGR of 16.3% during the forecast period 2024-2030 due to several compelling factors. PIR sensors find extensive use in industrial settings for occupancy sensing, motion detection, and automation of various processes. Industries increasingly deploy PIR sensors to enhance operational efficiency, productivity, and worker safety. These sensors are integral to industrial automation systems, enabling real-time monitoring of machinery and equipment, as well as detecting human presence in hazardous environments to prevent accidents. Additionally, PIR sensors facilitate energy management by controlling lighting and HVAC systems based on occupancy patterns in factories and warehouses, contributing to cost savings and sustainability efforts. With ongoing advancements in sensor technology and the rise of Industry 4.0 initiatives, the demand for PIR sensors in industrial applications is expected to continue growing, making it a key driver in the overall expansion of the PIR sensors market.
Passive Infrared Sensors Market Segment Analysis – By End Use Industry
Security and surveillance emerge as the highest-growing end-use industry with a CAGR of 16.45 during the forecast period 2024-2030 in the passive infrared (PIR) sensors market due to escalating security concerns globally. PIR sensors play a pivotal role in intruder detection, motion sensing, and occupancy monitoring, making them indispensable components in security systems. With increasing instances of theft, vandalism, and unauthorized access, demand for robust security solutions continues to surge, driving the adoption of PIR sensors. Moreover, advancements in sensor technology have enhanced the capabilities of PIR sensors, enabling them to provide accurate detection while minimizing false alarms. This reliability, coupled with cost-effectiveness and ease of installation, further accelerates their adoption in security applications. Furthermore, the integration of PIR sensors with other technologies like video surveillance, access control, and IoT platforms enhances overall security system effectiveness, driving market growth. With ongoing urbanization, commercialization, and infrastructure development, the demand for security and surveillance solutions, and consequently PIR sensors, is expected to continue rising, solidifying its position as a key growth driver in the market.
Passive Infrared Sensors Market Segment Analysis – By Geography
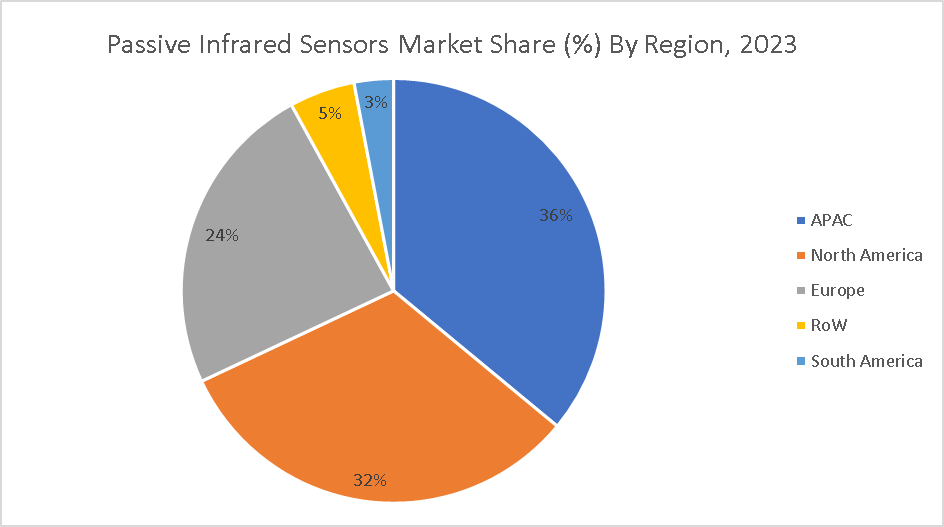
Asia Pacific dominated the passive infrared (PIR) sensors segment with a market share of 36% in 2023 due to several key factors. Rapid urbanization, industrialization, and infrastructure development in countries like China, India, and Southeast Asian nations are driving the demand for PIR sensors across various sectors. The region's expanding consumer electronics industry, coupled with increasing investments in smart homes, building automation, and IoT technologies, fuels market growth. Additionally, rising concerns about safety, security, and energy efficiency drive the adoption of PIR sensors in security systems, smart lighting, and HVAC control applications. Moreover, government initiatives promoting smart city development and energy efficiency further boost market expansion in Asia Pacific. With a growing population and rising disposable incomes, the demand for PIR sensors for both residential and commercial applications is expected to continue increasing, making Asia Pacific a lucrative market for PIR sensor manufacturers and suppliers.
For More Details on This Report - Request for Sample
Passive Infrared Sensors Market Drivers
Increasing Demand for Smart Homes and Building Automation
The increasing demand for smart homes and building automation systems is a significant driver in the passive infrared (PIR) sensors market. As consumers seek to enhance convenience, comfort, and energy efficiency in their living and working spaces, the adoption of PIR sensors for occupancy detection, lighting control, and HVAC (heating, ventilation, and air conditioning) optimization is rising. PIR sensors play a crucial role in smart home ecosystems by detecting human presence and activities, enabling automated actions such as turning on lights, adjusting thermostats, and activating security systems. Moreover, in commercial buildings, PIR sensors contribute to energy savings and operational efficiency by controlling lighting and HVAC systems based on occupancy patterns. The proliferation of connected devices, coupled with advancements in sensor technology and the integration of PIR sensors with smart home platforms, further accelerates market growth in this segment.
Implementation in Automotive Safety Systems
Implementation in automotive safety systems serves as a major market driver in the passive infrared (PIR) sensors market. PIR sensors are integral components of advanced driver assistance systems (ADAS) and automotive safety systems. These sensors enable critical functions such as occupant detection, driver monitoring, and pedestrian detection. With the increasing emphasis on road safety and the development of autonomous vehicles, the demand for PIR sensors in the automotive sector is on the rise. PIR sensors play a crucial role in enhancing vehicle safety by detecting occupants within the vehicle, monitoring driver attention and fatigue levels, and assisting in collision avoidance systems. As automotive manufacturers strive to meet stringent safety standards and enhance the capabilities of their vehicles, the integration of PIR sensors in automotive safety systems continues to drive market growth in the passive infrared sensors market.
Passive Infrared Sensors Market Challenges
False Alarms and Environmental Interference
False alarms and environmental interference pose significant challenges in the passive infrared (PIR) sensors market. PIR sensors detect infrared radiation emitted by objects in their field of view, but they can also be triggered by environmental factors like changes in temperature, movement of objects such as curtains or foliage, or the presence of pets. These false triggers can lead to unnecessary alerts, reduced system reliability, and increased maintenance costs. Addressing false alarms while maintaining sensitivity to human movement is crucial, particularly in security and surveillance applications where accuracy is paramount. Manufacturers must invest in advanced algorithms, signal processing techniques, and sensor design improvements to differentiate between genuine threats and false triggers effectively. By enhancing the reliability and usability of PIR sensors, the market can overcome this challenge and unlock their full potential in various applications.
Market Landscape
Product/Service launches, approvals, patents and events, acquisitions, partnerships and collaborations are key strategies adopted by players in the Passive Infrared Sensors Market. The top 10 companies in this industry are: Honeywell International Inc., Panasonic Corporation, Murata Manufacturing Co., Ltd., Texas Instruments Inc., Johnson Controls International plc, Enerlites, Inc., Pyreos Limited, Excelitas Technologies Corp., Amphenol Corporation, Nicera Philippines, Inc.
Developments:
- In January 2022, Honeywell International Inc launched a new facility in Saudi Arabia to produce Callidus flare technology, reducing emissions for the petrochemical industry. They also opened a separate facility to manufacture gas detection equipment. More recently, in September, Honeywell launched a new software suite to optimize data center efficiency. These developments highlight Honeywell's focus on both environmental solutions and building technology advancements.
- Johnson Controls recently opened their largest OpenBlue Innovation Center in India on July 2023. This center showcases their OpenBlue suite, which uses AI and cloud technology to create smart, sustainable buildings. Visitors can experience a virtual reality tour of net-zero buildings and see demonstrations of access control, fire safety, and digital twin technology. This focus on net-zero buildings highlights Johnson Controls' commitment to sustainable innovation.
For more Electronics related reports, please click here
- Passive Infrared Sensors Market - Overview
- Definitions and Scope
- Passive Infrared Sensors Market - Executive Summary
- Key Trends by Type
- Key Trends by Indication
- Key Trends by End User
- Key Trends by Intake Method
- Key Trends by Distribution Channel
- Key Trends by Geography
- Passive Infrared Sensors Market - Comparative Analysis
- Company Benchmarking - Key Companies
- Global Financial Analysis - Key Companies
- Market Share Analysis - Key Companies
- Patent Analysis
- Pricing Analysis
- Passive Infrared Sensors Market - Start-up Companies
- Key Start-up Company Analysis by
- Investment
- Revenue
- Venture Capital and Funding Scenario
- Key Start-up Company Analysis by
- Passive Infrared Sensors Market – Market Entry
- Regulatory Framework Overview
- New Business and Ease of Doing Business Index
- Case Studies of Successful Ventures
- Passive Infrared Sensors Market - Forces
- Market Drivers
- Market Constraints
- Market Challenges
- Porter's Five Force Model
- Bargaining Power of Suppliers
- Bargaining Powers of Customers
- Threat of New Entrants
- Rivalry Among Existing Players
- Threat of Substitutes
- Passive Infrared Sensors Market – Strategic Analysis
- Value Chain Analysis
- Opportunities Analysis
- Market Life Cycle
- Passive Infrared Sensors Market – By Type (Market Size – $Million/$Billion)
- Wired PIR Sensors
- Wireless PIR Sensors
- Passive Infrared Sensors Market – By Coverage Range (Market Size – $Million/$Billion)
- Short-Range PIR Sensors
- Medium-Range PIR Sensors
- Long-Range PIR Sensors
- Passive Infrared Sensors Market – By Technology (Market Size – $Million/$Billion)
- Single Element PIR Sensors
- Dual Element PIR Sensors
- Quad Element PIR Sensors
- Others
- Passive Infrared Sensors Market – By Application (Market Size – $Million/$Billion)
- Residential
- Commercial
- Industrial
- Automotive
- Aerospace and Defense
- Healthcare
- Others
- Passive Infrared Sensors Market – By End-User Industry (Market Size – $Million/$Billion)
- Building Automation
- Security and Surveillance
- Lighting Control
- HVAC Control
- Energy Management
- Consumer Electronics
- Automotive
- Others
- Passive Infrared Sensors Market – by Geography (Market Size – $Million/$Billion)
- North America
- The U.S.
- Canada
- Mexico
- Europe
- UK
- Germany
- France
- Italy
- Spain
- Russia
- Rest of Europe
- Asia-Pacific
- China
- India
- Japan
- South Korea
- Australia & New Zealand
- Rest of Asia-Pacific
- South America
- Brazil
- Argentina
- Chile
- Colombia
- Rest of South America
- Rest of the World
- Middle East
- Africa
- North America
- Passive Infrared Sensors Market – Entropy
- Passive Infrared Sensors Market – Industry/Segment Competition Landscape
- Market Share Analysis
- Market Share by Product Type – Key Companies
- Market Share by Region – Key Companies
- Market Share by Country – Key Companies
- Competition Matrix
- Best Practices for Companies
- Market Share Analysis
- Passive Infrared Sensors Market – Key Company List by Country Premium
- Passive Infrared Sensors Market - Company Analysis
- Honeywell International Inc.
- Panasonic Corporation
- Murata Manufacturing Co., Ltd.
- Texas Instruments Incorporated
- Johnson Controls International plc
- Enerlites, Inc.
- Pyreos Limited
- Excelitas Technologies Corp.
- Amphenol Corporation
- Nicera Philippines, Inc.
- Others
- "Financials to the Private Companies would be provided on best-effort basis."
Connect with our experts to get customized reports that best suit your requirements. Our reports include global-level data, niche markets and competitive landscape.
List of Tables
Table 1 Passive Infrared Sensors Market Overview 2023-2030
Table 2 Passive Infrared Sensors Market Leader Analysis 2023-2030 (US$)
Table 3 Passive Infrared Sensors MarketProduct Analysis 2023-2030 (US$)
Table 4 Passive Infrared Sensors MarketEnd User Analysis 2023-2030 (US$)
Table 5 Passive Infrared Sensors MarketPatent Analysis 2013-2023* (US$)
Table 6 Passive Infrared Sensors MarketFinancial Analysis 2023-2030 (US$)
Table 7 Passive Infrared Sensors Market Driver Analysis 2023-2030 (US$)
Table 8 Passive Infrared Sensors MarketChallenges Analysis 2023-2030 (US$)
Table 9 Passive Infrared Sensors MarketConstraint Analysis 2023-2030 (US$)
Table 10 Passive Infrared Sensors Market Supplier Bargaining Power Analysis 2023-2030 (US$)
Table 11 Passive Infrared Sensors Market Buyer Bargaining Power Analysis 2023-2030 (US$)
Table 12 Passive Infrared Sensors Market Threat of Substitutes Analysis 2023-2030 (US$)
Table 13 Passive Infrared Sensors Market Threat of New Entrants Analysis 2023-2030 (US$)
Table 14 Passive Infrared Sensors Market Degree of Competition Analysis 2023-2030 (US$)
Table 15 Passive Infrared Sensors MarketValue Chain Analysis 2023-2030 (US$)
Table 16 Passive Infrared Sensors MarketPricing Analysis 2023-2030 (US$)
Table 17 Passive Infrared Sensors MarketOpportunities Analysis 2023-2030 (US$)
Table 18 Passive Infrared Sensors MarketProduct Life Cycle Analysis 2023-2030 (US$)
Table 19 Passive Infrared Sensors MarketSupplier Analysis 2023-2030 (US$)
Table 20 Passive Infrared Sensors MarketDistributor Analysis 2023-2030 (US$)
Table 21 Passive Infrared Sensors Market Trend Analysis 2023-2030 (US$)
Table 22 Passive Infrared Sensors Market Size 2023 (US$)
Table 23 Passive Infrared Sensors Market Forecast Analysis 2023-2030 (US$)
Table 24 Passive Infrared Sensors Market Sales Forecast Analysis 2023-2030 (Units)
Table 25 Passive Infrared Sensors Market, Revenue & Volume,By Device, 2023-2030 ($)
Table 26 Passive Infrared Sensors MarketBy Device, Revenue & Volume,By Smoke detector, 2023-2030 ($)
Table 27 Passive Infrared Sensors MarketBy Device, Revenue & Volume,By Motion controller, 2023-2030 ($)
Table 28 Passive Infrared Sensors MarketBy Device, Revenue & Volume,By Heat detector, 2023-2030 ($)
Table 29 Passive Infrared Sensors Market, Revenue & Volume,By Range, 2023-2030 ($)
Table 30 Passive Infrared Sensors MarketBy Range, Revenue & Volume,By Short wave, 2023-2030 ($)
Table 31 Passive Infrared Sensors MarketBy Range, Revenue & Volume,By Passive infrared sensor, 2023-2030 ($)
Table 32 Passive Infrared Sensors MarketBy Range, Revenue & Volume,By Mid wave passive infrared sensor, 2023-2030 ($)
Table 33 Passive Infrared Sensors MarketBy Range, Revenue & Volume,By Long wave passive infrared sensor, 2023-2030 ($)
Table 34 Passive Infrared Sensors Market, Revenue & Volume,By Application, 2023-2030 ($)
Table 35 Passive Infrared Sensors MarketBy Application, Revenue & Volume,By Consumer electronics, 2023-2030 ($)
Table 36 Passive Infrared Sensors MarketBy Application, Revenue & Volume,By Defense and aerospace, 2023-2030 ($)
Table 37 Passive Infrared Sensors MarketBy Application, Revenue & Volume,By Healthcare , 2023-2030 ($)
Table 38 Passive Infrared Sensors MarketBy Application, Revenue & Volume,By Industrial, 2023-2030 ($)
Table 39 Passive Infrared Sensors MarketBy Application, Revenue & Volume,By Automotive, 2023-2030 ($)
Table 40 North America Passive Infrared Sensors Market, Revenue & Volume,By Device, 2023-2030 ($)
Table 41 North America Passive Infrared Sensors Market, Revenue & Volume,By Range, 2023-2030 ($)
Table 42 North America Passive Infrared Sensors Market, Revenue & Volume,By Application, 2023-2030 ($)
Table 43 South america Passive Infrared Sensors Market, Revenue & Volume,By Device, 2023-2030 ($)
Table 44 South america Passive Infrared Sensors Market, Revenue & Volume,By Range, 2023-2030 ($)
Table 45 South america Passive Infrared Sensors Market, Revenue & Volume,By Application, 2023-2030 ($)
Table 46 Europe Passive Infrared Sensors Market, Revenue & Volume,By Device, 2023-2030 ($)
Table 47 Europe Passive Infrared Sensors Market, Revenue & Volume,By Range, 2023-2030 ($)
Table 48 Europe Passive Infrared Sensors Market, Revenue & Volume,By Application, 2023-2030 ($)
Table 49 APAC Passive Infrared Sensors Market, Revenue & Volume,By Device, 2023-2030 ($)
Table 50 APAC Passive Infrared Sensors Market, Revenue & Volume,By Range, 2023-2030 ($)
Table 51 APAC Passive Infrared Sensors Market, Revenue & Volume,By Application, 2023-2030 ($)
Table 52 Middle East & Africa Passive Infrared Sensors Market, Revenue & Volume,By Device, 2023-2030 ($)
Table 53 Middle East & Africa Passive Infrared Sensors Market, Revenue & Volume,By Range, 2023-2030 ($)
Table 54 Middle East & Africa Passive Infrared Sensors Market, Revenue & Volume,By Application, 2023-2030 ($)
Table 55 Russia Passive Infrared Sensors Market, Revenue & Volume,By Device, 2023-2030 ($)
Table 56 Russia Passive Infrared Sensors Market, Revenue & Volume,By Range, 2023-2030 ($)
Table 57 Russia Passive Infrared Sensors Market, Revenue & Volume,By Application, 2023-2030 ($)
Table 58 Israel Passive Infrared Sensors Market, Revenue & Volume,By Device, 2023-2030 ($)
Table 59 Israel Passive Infrared Sensors Market, Revenue & Volume,By Range, 2023-2030 ($)
Table 60 Israel Passive Infrared Sensors Market, Revenue & Volume,By Application, 2023-2030 ($)
Table 61 Top Companies 2023 (US$)Passive Infrared Sensors Market, Revenue & Volume,,
Table 62 Product Launch 2023-2030Passive Infrared Sensors Market, Revenue & Volume,,
Table 63 Mergers & Acquistions 2023-2030Passive Infrared Sensors Market, Revenue & Volume,,
List of Figures
Figure 1 Overview of Passive Infrared Sensors Market 2023-2030
Figure 2 Market Share Analysis for Passive Infrared Sensors Market 2023 (US$)
Figure 3 Product Comparison in Passive Infrared Sensors Market 2023-2030 (US$)
Figure 4 End User Profile for Passive Infrared Sensors Market 2023-2030 (US$)
Figure 5 Patent Application and Grant in Passive Infrared Sensors Market 2013-2023* (US$)
Figure 6 Top 5 Companies Financial Analysis in Passive Infrared Sensors Market 2023-2030 (US$)
Figure 7 Market Entry Strategy in Passive Infrared Sensors Market 2023-2030
Figure 8 Ecosystem Analysis in Passive Infrared Sensors Market2023
Figure 9 Average Selling Price in Passive Infrared Sensors Market 2023-2030
Figure 10 Top Opportunites in Passive Infrared Sensors Market 2023-2030
Figure 11 Market Life Cycle Analysis in Passive Infrared Sensors Market
Figure 12 GlobalBy DevicePassive Infrared Sensors Market Revenue, 2023-2030 ($)
Figure 13 GlobalBy RangePassive Infrared Sensors Market Revenue, 2023-2030 ($)
Figure 14 GlobalBy ApplicationPassive Infrared Sensors Market Revenue, 2023-2030 ($)
Figure 15 Global Passive Infrared Sensors Market - By Geography
Figure 16 Global Passive Infrared Sensors Market Value & Volume, By Geography, 2023-2030 ($)
Figure 17 Global Passive Infrared Sensors Market CAGR, By Geography, 2023-2030 (%)
Figure 18 North America Passive Infrared Sensors Market Value & Volume, 2023-2030 ($)
Figure 19 US Passive Infrared Sensors Market Value & Volume, 2023-2030 ($)
Figure 20 US GDP and Population, 2023-2030 ($)
Figure 21 US GDP – Composition of 2023, By Sector of Origin
Figure 22 US Export and Import Value & Volume, 2023-2030 ($)
Figure 23 Canada Passive Infrared Sensors Market Value & Volume, 2023-2030 ($)
Figure 24 Canada GDP and Population, 2023-2030 ($)
Figure 25 Canada GDP – Composition of 2023, By Sector of Origin
Figure 26 Canada Export and Import Value & Volume, 2023-2030 ($)
Figure 27 Mexico Passive Infrared Sensors Market Value & Volume, 2023-2030 ($)
Figure 28 Mexico GDP and Population, 2023-2030 ($)
Figure 29 Mexico GDP – Composition of 2023, By Sector of Origin
Figure 30 Mexico Export and Import Value & Volume, 2023-2030 ($)
Figure 31 South America Passive Infrared Sensors MarketSouth America 3D Printing Market Value & Volume, 2023-2030 ($)
Figure 32 Brazil Passive Infrared Sensors Market Value & Volume, 2023-2030 ($)
Figure 33 Brazil GDP and Population, 2023-2030 ($)
Figure 34 Brazil GDP – Composition of 2023, By Sector of Origin
Figure 35 Brazil Export and Import Value & Volume, 2023-2030 ($)
Figure 36 Venezuela Passive Infrared Sensors Market Value & Volume, 2023-2030 ($)
Figure 37 Venezuela GDP and Population, 2023-2030 ($)
Figure 38 Venezuela GDP – Composition of 2023, By Sector of Origin
Figure 39 Venezuela Export and Import Value & Volume, 2023-2030 ($)
Figure 40 Argentina Passive Infrared Sensors Market Value & Volume, 2023-2030 ($)
Figure 41 Argentina GDP and Population, 2023-2030 ($)
Figure 42 Argentina GDP – Composition of 2023, By Sector of Origin
Figure 43 Argentina Export and Import Value & Volume, 2023-2030 ($)
Figure 44 Ecuador Passive Infrared Sensors Market Value & Volume, 2023-2030 ($)
Figure 45 Ecuador GDP and Population, 2023-2030 ($)
Figure 46 Ecuador GDP – Composition of 2023, By Sector of Origin
Figure 47 Ecuador Export and Import Value & Volume, 2023-2030 ($)
Figure 48 Peru Passive Infrared Sensors Market Value & Volume, 2023-2030 ($)
Figure 49 Peru GDP and Population, 2023-2030 ($)
Figure 50 Peru GDP – Composition of 2023, By Sector of Origin
Figure 51 Peru Export and Import Value & Volume, 2023-2030 ($)
Figure 52 Colombia Passive Infrared Sensors Market Value & Volume, 2023-2030 ($)
Figure 53 Colombia GDP and Population, 2023-2030 ($)
Figure 54 Colombia GDP – Composition of 2023, By Sector of Origin
Figure 55 Colombia Export and Import Value & Volume, 2023-2030 ($)
Figure 56 Costa Rica Passive Infrared Sensors MarketCosta Rica 3D Printing Market Value & Volume, 2023-2030 ($)
Figure 57 Costa Rica GDP and Population, 2023-2030 ($)
Figure 58 Costa Rica GDP – Composition of 2023, By Sector of Origin
Figure 59 Costa Rica Export and Import Value & Volume, 2023-2030 ($)
Figure 60 Europe Passive Infrared Sensors Market Value & Volume, 2023-2030 ($)
Figure 61 U.K Passive Infrared Sensors Market Value & Volume, 2023-2030 ($)
Figure 62 U.K GDP and Population, 2023-2030 ($)
Figure 63 U.K GDP – Composition of 2023, By Sector of Origin
Figure 64 U.K Export and Import Value & Volume, 2023-2030 ($)
Figure 65 Germany Passive Infrared Sensors Market Value & Volume, 2023-2030 ($)
Figure 66 Germany GDP and Population, 2023-2030 ($)
Figure 67 Germany GDP – Composition of 2023, By Sector of Origin
Figure 68 Germany Export and Import Value & Volume, 2023-2030 ($)
Figure 69 Italy Passive Infrared Sensors Market Value & Volume, 2023-2030 ($)
Figure 70 Italy GDP and Population, 2023-2030 ($)
Figure 71 Italy GDP – Composition of 2023, By Sector of Origin
Figure 72 Italy Export and Import Value & Volume, 2023-2030 ($)
Figure 73 France Passive Infrared Sensors Market Value & Volume, 2023-2030 ($)
Figure 74 France GDP and Population, 2023-2030 ($)
Figure 75 France GDP – Composition of 2023, By Sector of Origin
Figure 76 France Export and Import Value & Volume, 2023-2030 ($)
Figure 77 Netherlands Passive Infrared Sensors Market Value & Volume, 2023-2030 ($)
Figure 78 Netherlands GDP and Population, 2023-2030 ($)
Figure 79 Netherlands GDP – Composition of 2023, By Sector of Origin
Figure 80 Netherlands Export and Import Value & Volume, 2023-2030 ($)
Figure 81 Belgium Passive Infrared Sensors Market Value & Volume, 2023-2030 ($)
Figure 82 Belgium GDP and Population, 2023-2030 ($)
Figure 83 Belgium GDP – Composition of 2023, By Sector of Origin
Figure 84 Belgium Export and Import Value & Volume, 2023-2030 ($)
Figure 85 Spain Passive Infrared Sensors Market Value & Volume, 2023-2030 ($)
Figure 86 Spain GDP and Population, 2023-2030 ($)
Figure 87 Spain GDP – Composition of 2023, By Sector of Origin
Figure 88 Spain Export and Import Value & Volume, 2023-2030 ($)
Figure 89 Denmark Passive Infrared Sensors Market Value & Volume, 2023-2030 ($)
Figure 90 Denmark GDP and Population, 2023-2030 ($)
Figure 91 Denmark GDP – Composition of 2023, By Sector of Origin
Figure 92 Denmark Export and Import Value & Volume, 2023-2030 ($)
Figure 93 APAC Passive Infrared Sensors Market Value & Volume, 2023-2030 ($)
Figure 94 China Passive Infrared Sensors MarketValue & Volume, 2023-2030
Figure 95 China GDP and Population, 2023-2030 ($)
Figure 96 China GDP – Composition of 2023, By Sector of Origin
Figure 97 China Export and Import Value & Volume, 2023-2030 ($)Passive Infrared Sensors MarketChina Export and Import Value & Volume, 2023-2030 ($)
Figure 98 Australia Passive Infrared Sensors Market Value & Volume, 2023-2030 ($)
Figure 99 Australia GDP and Population, 2023-2030 ($)
Figure 100 Australia GDP – Composition of 2023, By Sector of Origin
Figure 101 Australia Export and Import Value & Volume, 2023-2030 ($)
Figure 102 South Korea Passive Infrared Sensors Market Value & Volume, 2023-2030 ($)
Figure 103 South Korea GDP and Population, 2023-2030 ($)
Figure 104 South Korea GDP – Composition of 2023, By Sector of Origin
Figure 105 South Korea Export and Import Value & Volume, 2023-2030 ($)
Figure 106 India Passive Infrared Sensors Market Value & Volume, 2023-2030 ($)
Figure 107 India GDP and Population, 2023-2030 ($)
Figure 108 India GDP – Composition of 2023, By Sector of Origin
Figure 109 India Export and Import Value & Volume, 2023-2030 ($)
Figure 110 Taiwan Passive Infrared Sensors MarketTaiwan 3D Printing Market Value & Volume, 2023-2030 ($)
Figure 111 Taiwan GDP and Population, 2023-2030 ($)
Figure 112 Taiwan GDP – Composition of 2023, By Sector of Origin
Figure 113 Taiwan Export and Import Value & Volume, 2023-2030 ($)
Figure 114 Malaysia Passive Infrared Sensors MarketMalaysia 3D Printing Market Value & Volume, 2023-2030 ($)
Figure 115 Malaysia GDP and Population, 2023-2030 ($)
Figure 116 Malaysia GDP – Composition of 2023, By Sector of Origin
Figure 117 Malaysia Export and Import Value & Volume, 2023-2030 ($)
Figure 118 Hong Kong Passive Infrared Sensors MarketHong Kong 3D Printing Market Value & Volume, 2023-2030 ($)
Figure 119 Hong Kong GDP and Population, 2023-2030 ($)
Figure 120 Hong Kong GDP – Composition of 2023, By Sector of Origin
Figure 121 Hong Kong Export and Import Value & Volume, 2023-2030 ($)
Figure 122 Middle East & Africa Passive Infrared Sensors MarketMiddle East & Africa 3D Printing Market Value & Volume, 2023-2030 ($)
Figure 123 Russia Passive Infrared Sensors MarketRussia 3D Printing Market Value & Volume, 2023-2030 ($)
Figure 124 Russia GDP and Population, 2023-2030 ($)
Figure 125 Russia GDP – Composition of 2023, By Sector of Origin
Figure 126 Russia Export and Import Value & Volume, 2023-2030 ($)
Figure 127 Israel Passive Infrared Sensors Market Value & Volume, 2023-2030 ($)
Figure 128 Israel GDP and Population, 2023-2030 ($)
Figure 129 Israel GDP – Composition of 2023, By Sector of Origin
Figure 130 Israel Export and Import Value & Volume, 2023-2030 ($)
Figure 131 Entropy Share, By Strategies, 2023-2030* (%)Passive Infrared Sensors Market
Figure 132 Developments, 2023-2030*Passive Infrared Sensors Market
Figure 133 Company 1 Passive Infrared Sensors Market Net Revenue, By Years, 2023-2030* ($)
Figure 134 Company 1 Passive Infrared Sensors Market Net Revenue Share, By Business segments, 2023 (%)
Figure 135 Company 1 Passive Infrared Sensors Market Net Sales Share, By Geography, 2023 (%)
Figure 136 Company 2 Passive Infrared Sensors Market Net Revenue, By Years, 2023-2030* ($)
Figure 137 Company 2 Passive Infrared Sensors Market Net Revenue Share, By Business segments, 2023 (%)
Figure 138 Company 2 Passive Infrared Sensors Market Net Sales Share, By Geography, 2023 (%)
Figure 139 Company 3Passive Infrared Sensors Market Net Revenue, By Years, 2023-2030* ($)
Figure 140 Company 3Passive Infrared Sensors Market Net Revenue Share, By Business segments, 2023 (%)
Figure 141 Company 3Passive Infrared Sensors Market Net Sales Share, By Geography, 2023 (%)
Figure 142 Company 4 Passive Infrared Sensors Market Net Revenue, By Years, 2023-2030* ($)
Figure 143 Company 4 Passive Infrared Sensors Market Net Revenue Share, By Business segments, 2023 (%)
Figure 144 Company 4 Passive Infrared Sensors Market Net Sales Share, By Geography, 2023 (%)
Figure 145 Company 5 Passive Infrared Sensors Market Net Revenue, By Years, 2023-2030* ($)
Figure 146 Company 5 Passive Infrared Sensors Market Net Revenue Share, By Business segments, 2023 (%)
Figure 147 Company 5 Passive Infrared Sensors Market Net Sales Share, By Geography, 2023 (%)
Figure 148 Company 6 Passive Infrared Sensors Market Net Revenue, By Years, 2023-2030* ($)
Figure 149 Company 6 Passive Infrared Sensors Market Net Revenue Share, By Business segments, 2023 (%)
Figure 150 Company 6 Passive Infrared Sensors Market Net Sales Share, By Geography, 2023 (%)
Figure 151 Company 7 Passive Infrared Sensors Market Net Revenue, By Years, 2023-2030* ($)
Figure 152 Company 7 Passive Infrared Sensors Market Net Revenue Share, By Business segments, 2023 (%)
Figure 153 Company 7 Passive Infrared Sensors Market Net Sales Share, By Geography, 2023 (%)
Figure 154 Company 8 Passive Infrared Sensors Market Net Revenue, By Years, 2023-2030* ($)
Figure 155 Company 8 Passive Infrared Sensors Market Net Revenue Share, By Business segments, 2023 (%)
Figure 156 Company 8 Passive Infrared Sensors Market Net Sales Share, By Geography, 2023 (%)
Figure 157 Company 9 Passive Infrared Sensors Market Net Revenue, By Years, 2023-2030* ($)
Figure 158 Company 9 Passive Infrared Sensors Market Net Revenue Share, By Business segments, 2023 (%)
Figure 159 Company 9 Passive Infrared Sensors Market Net Sales Share, By Geography, 2023 (%)
Figure 160 Company 10 Passive Infrared Sensors Market Net Revenue, By Years, 2023-2030* ($)
Figure 161 Company 10 Passive Infrared Sensors Market Net Revenue Share, By Business segments, 2023 (%)
Figure 162 Company 10 Passive Infrared Sensors Market Net Sales Share, By Geography, 2023 (%)
Figure 163 Company 11 Passive Infrared Sensors Market Net Revenue, By Years, 2023-2030* ($)
Figure 164 Company 11 Passive Infrared Sensors Market Net Revenue Share, By Business segments, 2023 (%)
Figure 165 Company 11 Passive Infrared Sensors Market Net Sales Share, By Geography, 2023 (%)
Figure 166 Company 12 Passive Infrared Sensors Market Net Revenue, By Years, 2023-2030* ($)
Figure 167 Company 12 Passive Infrared Sensors Market Net Revenue Share, By Business segments, 2023 (%)
Figure 168 Company 12 Passive Infrared Sensors Market Net Sales Share, By Geography, 2023 (%)
Figure 169 Company 13Passive Infrared Sensors Market Net Revenue, By Years, 2023-2030* ($)
Figure 170 Company 13Passive Infrared Sensors Market Net Revenue Share, By Business segments, 2023 (%)
Figure 171 Company 13Passive Infrared Sensors Market Net Sales Share, By Geography, 2023 (%)
Figure 172 Company 14 Passive Infrared Sensors Market Net Revenue, By Years, 2023-2030* ($)
Figure 173 Company 14 Passive Infrared Sensors Market Net Revenue Share, By Business segments, 2023 (%)
Figure 174 Company 14 Passive Infrared Sensors Market Net Sales Share, By Geography, 2023 (%)
Figure 175 Company 15 Passive Infrared Sensors Market Net Revenue, By Years, 2023-2030* ($)
Figure 176 Company 15 Passive Infrared Sensors Market Net Revenue Share, By Business segments, 2023 (%)
Figure 177 Company 15 Passive Infrared Sensors Market Net Sales Share, By Geography, 2023 (%)