 Email
Email Print
Print


Advanced Functional Materials Market - Forecast(2024 - 2030)
Advanced Functional Materials Market - Overview
The Advanced Functional Materials Market size is estimated to reach more than US$190 billion by 2030, after growing at a CAGR 5% during the forecast period 2024-2030. The production of handy and portable devices is gaining momentum in the industry as advanced functional materials are commonly used in the devices to minimize the total power consumption of miniature electronics. Nanotechnology integration is revolutionizing the development of advanced functional materials, allowing for precise manipulation and control at the nanoscale level. This trend encompasses the synthesis of nanomaterials such as carbon nanotubes, graphene, and quantum dots, which exhibit exceptional properties like high strength, conductivity, and optical characteristic. Industries ranging from electronics and healthcare to energy and aerospace are leveraging nanotechnology to enhance the performance and functionality of their products. For instance, in the electronics sector, nanomaterials are enabling the production of smaller, more efficient devices with enhanced computing capabilities and improved energy efficiency. Similarly, in healthcare, nanomaterials are facilitating advancements in drug delivery systems, medical imaging, and diagnostics, leading to more effective treatments and improved patient outcomes. Another prominent trend in the advanced functional materials market is the increasing emphasis on sustainability and eco-friendly solutions. With growing environmental concerns and stringent regulations regarding carbon emissions and waste management, businesses are shifting towards sustainable materials and manufacturing processes.
Market Snapshot:

Report Coverage
The report: “Advanced Functional Materials Market – Forecast (2024-2030)”, by IndustryARC, covers an in-depth analysis of the following segments of the Advanced Functional Materials Acid Industry.
By Type: Composites, Ceramics, Energy Materials, Nanomaterials, Conductive Polymers, and Others.
By End Use: Automotive, Medical, Industrial, Aerospace and Defense, Energy and Power, and others.
By Geography: North America (the USA, Canada and Mexico), Europe (UK, Germany, France, Italy, Russia, Spain, and the Rest of Europe), Asia-Pacific (China, Japan, India, South Korea, Australia and New Zealand, and Rest of APAC), South America (Brazil, Argentina, Colombia, and Rest of South America), Rest of the World (Middle-East and Africa)
Key Takeaways
- Development in the use of nanotechnology is expected to bring diverse prospects for business growth in the coming years.
- With the growing consumption in electronics and automotive from countries such as China, India and other developing countries, the demand of advanced functional material tends to upsurge.
- In November and December 2022, new research facilities were launched at Oxford University to develop next-generation advanced functional materials. This indicates a strong focus on innovation and advancement in this area.
For More Details on This Report - Request for Sample
Advanced Functional Materials Market Segment Analysis- By Type
Nanomaterials segment is dominating and accounting with the highest share in the market. Nanomaterials include nanoparticles, nanofibers, nanotubes, nano clays, and nanowires among others. In the automotive and aviation industries, nanomaterials, especially carbon nanomaterials, are increasingly used due to their thermal conductivity, electrical conductivity, durability, high strength and elasticity, high aspect ratio, field emissions and high absorbent properties. Furthermore, the growing usage of nanomaterials in nanomedicine field of healthcare industry tends to increase the growth of advanced functional materials market.
Advanced Functional Materials Market Segment Analysis- By End Use
Electronics & electrical industry is one of the main advanced functional material users. With advanced functional ceramics, conductive polymers and nanomaterials being a significant contributor to this market. In the electronics and electrical industry, advanced practical ceramics exhibit piezoelectric, mechanical, semiconducting, and conducting characteristics that make them viable for use in applications such as mobile phones and computers. India is one of the largest consumer electronics markets in Asia Pacific Region and is home to considerable talent for electronic chip design and embedded software. According to India Brand Equity Foundation, India has committed to reach US$ 300 billion worth of electronics manufacturing and exports of US$ 120 billion by 2025-26. In addition. R&D investments in specialized product production using innovative dimensional composites for aerospace and automobiles are expected to open up a new gateway for experienced players in the materials industry. Growing the use of innovative functional composites assembled by mixing two or more materials maintains the distinctive properties that market participants are creating.
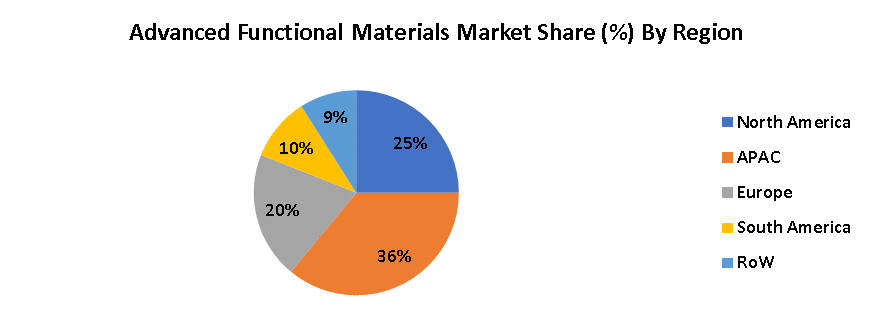
Advanced Functional Materials Market Segment Analysis- Geography
Asia-Pacific region was the largest market for advanced functional materials. The largest chunk of consumption in the region was China. China has the largest manufacturing base of electronics in the world and provides tough competition to existing upstream manufacturers such as South Korea, Singapore and Japan. One of the country's leading industries is the Chinese aerospace industry, and the government is investing heavily in the industry to expand domestic manufacturing capacity. In addition, with the consistent growth of China's and other developing countries' electrical and electronics, aerospace and other industries. According to India Brand Equity Foundation, The Indian aerospace & defence (A&D) market is projected to reach ~US$ 70 billion by 2030, driven by the burgeoning demand for advanced infrastructure and government thrust.
Drivers – Advanced Functional Materials Market
Growing demand in healthcare and medical industries.
The variety of applications of advanced functional materials in the medical and healthcare sectors has been expanded by technical developments in the versatile substrate market. For instance, specialized functional components, such as hip joint reconstruction, bone fixing plates, bone grafts, and bone cement, are commonly used in orthopaedic applications. Advanced functional materials often allow integrated systems to be mounted, thus expanding their use in MRI scanners, mammography plates, tables, X-ray couches, C scanners, and surgical target instruments. In addition, in the production of prosthetic and orthotic devices, innovative functional technologies such as composites and nanomaterials are rapidly replacing conventional materials such as wood, rubber, and aluminium. In order to fuel the development of the advanced functional materials industry, technical developments in medical and diagnostic instruments would be a critical consideration.
Challenges – Advanced Functional Materials Market
Lack of expansion capacities
The lack of expansion capability to satisfy consumer demand, combined with technological enhancement, is projected to impede the development of advanced functional content market participants. Also, the manufacturing process in order to produce advanced functional materials is bit expensive, owning to this, only few manufacturers have the capability to deal with production and demand requirements. Due to the availability of few manufacturers, the cost of advanced functional materials tends to be high, which also becomes the major factor that constraints the growth of the market.
Market Landscape
Technology launches, acquisitions and R&D activities are key strategies adopted by players in the Advanced Functional Materials Acid market. In 2023, the market of Advanced Functional Materials Acid has been consolidated by the top five players accounting for xx% of the share. Key companies of this market are
- 3M
- 3A Composites
- Hexcel Corporation
- BASF SE
- CeramTec GmbH
- Arkema
- Henkel AG & Co. KGaA
- Convestro AG
- Kyocera Corporation
- Sumitomo Chemical Co., Ltd.
Developments:
- In February 2023, Kuraray partnered with PTT Global Chemical (GC) and Sumitomo Corporation to enhance industrial capabilities in Thailand. This collaboration led to the establishment of Kuraray GC Advanced Materials, a joint venture aimed at manufacturing and selling butadiene derivatives.
- In September 2022, Henkel acquired NBD Nanotechnologies, a US-based advanced materials start-up, for an undisclosed sum. NBD Nano is headquartered in Boston, Massachusetts.
For more Chemicals and Materials Market reports, please click here
1. Advanced Functional Materials Market- Market Overview
1.1 Definitions and Scope
2. Advanced Functional Materials Market- Executive Summary
2.1 Market Revenue, Market Size and Key Trends by Company
2.2 Key Trends by Type
2.3 Key Trends by End-Use
2.4 Key Trends by Geography
3. Advanced Functional Materials Market- Landscape
3.1 Comparative analysis
3.1.1 Market Share Analysis- Top Companies
3.1.2 Product Benchmarking- Top Companies
3.1.3 Top 5 Financials Analysis
3.1.4Patent Analysis- Top Companies
3.1.5Pricing Analysis
4. Advanced Functional Materials Market- Startup Companies Scenario
4.1 Top startup company Analysis by
4.1.1 Investment
4.1.2 Revenue
4.1.3 Market Shares
4.1.4 Market Size and Application Analysis
4.1.5 Venture Capital and Funding Scenario
5. Advanced Functional Materials Market– Industry Market Entry Scenario Premium
5.1 Regulatory Framework Overview
5.2 New Business and Ease of Doing business index
5.3 Case studies of successful ventures
5.4 Customer Analysis - Top companies
6. Advanced Functional Materials Market- Market Forces
6.1 Market Drivers
6.2 Market Constraints
6.3 Porters five force model
6.3.1 Bargaining power of suppliers
6.3.2 Bargaining powers of customers
6.3.3 Threat of new entrants
6.3.4 Rivalry among existing players
6.3.5 Threat of substitutes
7. Advanced Functional Materials Market-Strategic analysis
7.1 Value chain analysis
7.2 Opportunities analysis
7.3 Market life cycle
7.4 Suppliers and distributors Analysis
8. Advanced Functional Materials Market– By Type (Market Size -$Million)
8.1 Composites
8.1.1 Metal Matrix Composites
8.1.2 Fibre Reinforced Plastics
8.2 Ceramics
8.3 Energy Materials
8.4 Nanomaterials
8.5 Conductive Polymers
8.6 Others
9. Advanced Functional Materials Market– By End Use (Market Size -$Million)
9.1 Automotive
9.2 Medical
9.3 Industrial
9.4 Aerospace and Defense
9.5 Energy and Power
9.6 Others
10. Advanced Functional Materials Market- By Geography (Market Size -$Million)
10.1 North America
10.1.1U.S.
10.1.2 Canada
10.1.3 Mexico
10.2 South America
10.2.1 Brazil
10.2.2 Argentina
10.2.3 Colombia
10.2.4 Rest of South America
10.3 Europe
10.3.1 U.K
10.3.2 Germany
10.3.3 Italy
10.3.4 France
10.3.5 Russia
10.3.6 Spain
10.3.7 Rest of Europe
10.4 Asia Pacific
10.4.1 China
10.4.2 Japan
10.4.3 Australia and New Zealand
10.4.4 South Korea
10.4.5 India
10.4.6 Rest of APAC
10.5 ROW
10.5.1 Middle East
10.5.2 Africa
11. Advanced Functional Materials Market- Entropy
11.1 New Product Launches
11.2 M&A’s, Collaborations, JVs and Partnerships
12. Market Share Analysis
12.1 Market Share by Country- Top companies
12.2 Market Share by Region- Top companies
12.3 Market Share by type of Product / Product category- Top companies
12.4 Market Share at global level- Top companies
12.5 Best Practices for companies
13. Advanced Functional Materials Market- List of Key Companies by Country
14. Advanced Functional Materials Market- Company Analysis
14.1 Market Share, Company Revenue, Products, M&A, Developments
14.2 3M
14.3 3A Composites
14.4 Hexcel Corporation
14.5 BASF SE
14.6 CeramTec GmbH
14.7 Arkema
14.8 Henkel AG & Co. KGaA
14.9 Convestro AG
14.10 Kyocera Corporation
14.11 Sumitomo Chemical Co., Ltd.
"*Financials would be provided on a best-efforts basis for private companies"
Connect with our experts to get customized reports that best suit your requirements. Our reports include global-level data, niche markets and competitive landscape.
List of Tables
Table 1 Advanced Functional Market Overview 2023-2030
Table 2 Advanced Functional Market Leader Analysis 2023-2030 (US$)
Table 3 Advanced Functional MarketProduct Analysis 2023-2030 (US$)
Table 4 Advanced Functional MarketEnd User Analysis 2023-2030 (US$)
Table 5 Advanced Functional MarketPatent Analysis 2013-2023* (US$)
Table 6 Advanced Functional MarketFinancial Analysis 2023-2030 (US$)
Table 7 Advanced Functional Market Driver Analysis 2023-2030 (US$)
Table 8 Advanced Functional MarketChallenges Analysis 2023-2030 (US$)
Table 9 Advanced Functional MarketConstraint Analysis 2023-2030 (US$)
Table 10 Advanced Functional Market Supplier Bargaining Power Analysis 2023-2030 (US$)
Table 11 Advanced Functional Market Buyer Bargaining Power Analysis 2023-2030 (US$)
Table 12 Advanced Functional Market Threat of Substitutes Analysis 2023-2030 (US$)
Table 13 Advanced Functional Market Threat of New Entrants Analysis 2023-2030 (US$)
Table 14 Advanced Functional Market Degree of Competition Analysis 2023-2030 (US$)
Table 15 Advanced Functional MarketValue Chain Analysis 2023-2030 (US$)
Table 16 Advanced Functional MarketPricing Analysis 2023-2030 (US$)
Table 17 Advanced Functional MarketOpportunities Analysis 2023-2030 (US$)
Table 18 Advanced Functional MarketProduct Life Cycle Analysis 2023-2030 (US$)
Table 19 Advanced Functional MarketSupplier Analysis 2023-2030 (US$)
Table 20 Advanced Functional MarketDistributor Analysis 2023-2030 (US$)
Table 21 Advanced Functional Market Trend Analysis 2023-2030 (US$)
Table 22 Advanced Functional Market Size 2023 (US$)
Table 23 Advanced Functional Market Forecast Analysis 2023-2030 (US$)
Table 24 Advanced Functional Market Sales Forecast Analysis 2023-2030 (Units)
Table 25 Advanced Functional Market, Revenue & Volume,By Type, 2023-2030 ($)
Table 26 Advanced Functional MarketBy Type, Revenue & Volume,By Advanced Functional Ceramics, 2023-2030 ($)
Table 27 Advanced Functional MarketBy Type, Revenue & Volume,By Advanced Functional Composites, 2023-2030 ($)
Table 28 Advanced Functional MarketBy Type, Revenue & Volume,By Advanced Energy Materials, 2023-2030 ($)
Table 29 Advanced Functional MarketBy Type, Revenue & Volume,By Nanomaterials, 2023-2030 ($)
Table 30 Advanced Functional MarketBy Type, Revenue & Volume,By Conductive Polymers, 2023-2030 ($)
Table 31 Advanced Functional Market, Revenue & Volume,By Application, 2023-2030 ($)
Table 32 Advanced Functional MarketBy Application, Revenue & Volume,By Electrical & Electronics, 2023-2030 ($)
Table 33 Advanced Functional MarketBy Application, Revenue & Volume,By Chemicals & Materials, 2023-2030 ($)
Table 34 Advanced Functional MarketBy Application, Revenue & Volume,By Automotive & Transportation, 2023-2030 ($)
Table 35 Advanced Functional MarketBy Application, Revenue & Volume,By Medical, Healthcare & Pharmaceutical, 2023-2030 ($)
Table 36 Advanced Functional MarketBy Application, Revenue & Volume,By Energy & Power, 2023-2030 ($)
Table 37 North America Advanced Functional Market, Revenue & Volume,By Type, 2023-2030 ($)
Table 38 North America Advanced Functional Market, Revenue & Volume,By Application, 2023-2030 ($)
Table 39 South america Advanced Functional Market, Revenue & Volume,By Type, 2023-2030 ($)
Table 40 South america Advanced Functional Market, Revenue & Volume,By Application, 2023-2030 ($)
Table 41 Europe Advanced Functional Market, Revenue & Volume,By Type, 2023-2030 ($)
Table 42 Europe Advanced Functional Market, Revenue & Volume,By Application, 2023-2030 ($)
Table 43 APAC Advanced Functional Market, Revenue & Volume,By Type, 2023-2030 ($)
Table 44 APAC Advanced Functional Market, Revenue & Volume,By Application, 2023-2030 ($)
Table 45 Middle East & Africa Advanced Functional Market, Revenue & Volume,By Type, 2023-2030 ($)
Table 46 Middle East & Africa Advanced Functional Market, Revenue & Volume,By Application, 2023-2030 ($)
Table 47 Russia Advanced Functional Market, Revenue & Volume,By Type, 2023-2030 ($)
Table 48 Russia Advanced Functional Market, Revenue & Volume,By Application, 2023-2030 ($)
Table 49 Israel Advanced Functional Market, Revenue & Volume,By Type, 2023-2030 ($)
Table 50 Israel Advanced Functional Market, Revenue & Volume,By Application, 2023-2030 ($)
Table 51 Top Companies 2023 (US$)Advanced Functional Market, Revenue & Volume,,
Table 52 Product Launch 2023-2030Advanced Functional Market, Revenue & Volume,,
Table 53 Mergers & Acquistions 2023-2030Advanced Functional Market, Revenue & Volume,,
List of Figures
Figure 1 Overview of Advanced Functional Market 2023-2030
Figure 2 Market Share Analysis for Advanced Functional Market 2023 (US$)
Figure 3 Product Comparison in Advanced Functional Market 2023-2030 (US$)
Figure 4 End User Profile for Advanced Functional Market 2023-2030 (US$)
Figure 5 Patent Application and Grant in Advanced Functional Market 2013-2023* (US$)
Figure 6 Top 5 Companies Financial Analysis in Advanced Functional Market 2023-2030 (US$)
Figure 7 Market Entry Strategy in Advanced Functional Market 2023-2030
Figure 8 Ecosystem Analysis in Advanced Functional Market2023
Figure 9 Average Selling Price in Advanced Functional Market 2023-2030
Figure 10 Top Opportunites in Advanced Functional Market 2023-2030
Figure 11 Market Life Cycle Analysis in Advanced Functional Market
Figure 12 GlobalBy TypeAdvanced Functional Market Revenue, 2023-2030 ($)
Figure 13 GlobalBy ApplicationAdvanced Functional Market Revenue, 2023-2030 ($)
Figure 14 Global Advanced Functional Market - By Geography
Figure 15 Global Advanced Functional Market Value & Volume, By Geography, 2023-2030 ($)
Figure 16 Global Advanced Functional Market CAGR, By Geography, 2023-2030 (%)
Figure 17 North America Advanced Functional Market Value & Volume, 2023-2030 ($)
Figure 18 US Advanced Functional Market Value & Volume, 2023-2030 ($)
Figure 19 US GDP and Population, 2023-2030 ($)
Figure 20 US GDP – Composition of 2023, By Sector of Origin
Figure 21 US Export and Import Value & Volume, 2023-2030 ($)
Figure 22 Canada Advanced Functional Market Value & Volume, 2023-2030 ($)
Figure 23 Canada GDP and Population, 2023-2030 ($)
Figure 24 Canada GDP – Composition of 2023, By Sector of Origin
Figure 25 Canada Export and Import Value & Volume, 2023-2030 ($)
Figure 26 Mexico Advanced Functional Market Value & Volume, 2023-2030 ($)
Figure 27 Mexico GDP and Population, 2023-2030 ($)
Figure 28 Mexico GDP – Composition of 2023, By Sector of Origin
Figure 29 Mexico Export and Import Value & Volume, 2023-2030 ($)
Figure 30 South America Advanced Functional MarketSouth America 3D Printing Market Value & Volume, 2023-2030 ($)
Figure 31 Brazil Advanced Functional Market Value & Volume, 2023-2030 ($)
Figure 32 Brazil GDP and Population, 2023-2030 ($)
Figure 33 Brazil GDP – Composition of 2023, By Sector of Origin
Figure 34 Brazil Export and Import Value & Volume, 2023-2030 ($)
Figure 35 Venezuela Advanced Functional Market Value & Volume, 2023-2030 ($)
Figure 36 Venezuela GDP and Population, 2023-2030 ($)
Figure 37 Venezuela GDP – Composition of 2023, By Sector of Origin
Figure 38 Venezuela Export and Import Value & Volume, 2023-2030 ($)
Figure 39 Argentina Advanced Functional Market Value & Volume, 2023-2030 ($)
Figure 40 Argentina GDP and Population, 2023-2030 ($)
Figure 41 Argentina GDP – Composition of 2023, By Sector of Origin
Figure 42 Argentina Export and Import Value & Volume, 2023-2030 ($)
Figure 43 Ecuador Advanced Functional Market Value & Volume, 2023-2030 ($)
Figure 44 Ecuador GDP and Population, 2023-2030 ($)
Figure 45 Ecuador GDP – Composition of 2023, By Sector of Origin
Figure 46 Ecuador Export and Import Value & Volume, 2023-2030 ($)
Figure 47 Peru Advanced Functional Market Value & Volume, 2023-2030 ($)
Figure 48 Peru GDP and Population, 2023-2030 ($)
Figure 49 Peru GDP – Composition of 2023, By Sector of Origin
Figure 50 Peru Export and Import Value & Volume, 2023-2030 ($)
Figure 51 Colombia Advanced Functional Market Value & Volume, 2023-2030 ($)
Figure 52 Colombia GDP and Population, 2023-2030 ($)
Figure 53 Colombia GDP – Composition of 2023, By Sector of Origin
Figure 54 Colombia Export and Import Value & Volume, 2023-2030 ($)
Figure 55 Costa Rica Advanced Functional MarketCosta Rica 3D Printing Market Value & Volume, 2023-2030 ($)
Figure 56 Costa Rica GDP and Population, 2023-2030 ($)
Figure 57 Costa Rica GDP – Composition of 2023, By Sector of Origin
Figure 58 Costa Rica Export and Import Value & Volume, 2023-2030 ($)
Figure 59 Europe Advanced Functional Market Value & Volume, 2023-2030 ($)
Figure 60 U.K Advanced Functional Market Value & Volume, 2023-2030 ($)
Figure 61 U.K GDP and Population, 2023-2030 ($)
Figure 62 U.K GDP – Composition of 2023, By Sector of Origin
Figure 63 U.K Export and Import Value & Volume, 2023-2030 ($)
Figure 64 Germany Advanced Functional Market Value & Volume, 2023-2030 ($)
Figure 65 Germany GDP and Population, 2023-2030 ($)
Figure 66 Germany GDP – Composition of 2023, By Sector of Origin
Figure 67 Germany Export and Import Value & Volume, 2023-2030 ($)
Figure 68 Italy Advanced Functional Market Value & Volume, 2023-2030 ($)
Figure 69 Italy GDP and Population, 2023-2030 ($)
Figure 70 Italy GDP – Composition of 2023, By Sector of Origin
Figure 71 Italy Export and Import Value & Volume, 2023-2030 ($)
Figure 72 France Advanced Functional Market Value & Volume, 2023-2030 ($)
Figure 73 France GDP and Population, 2023-2030 ($)
Figure 74 France GDP – Composition of 2023, By Sector of Origin
Figure 75 France Export and Import Value & Volume, 2023-2030 ($)
Figure 76 Netherlands Advanced Functional Market Value & Volume, 2023-2030 ($)
Figure 77 Netherlands GDP and Population, 2023-2030 ($)
Figure 78 Netherlands GDP – Composition of 2023, By Sector of Origin
Figure 79 Netherlands Export and Import Value & Volume, 2023-2030 ($)
Figure 80 Belgium Advanced Functional Market Value & Volume, 2023-2030 ($)
Figure 81 Belgium GDP and Population, 2023-2030 ($)
Figure 82 Belgium GDP – Composition of 2023, By Sector of Origin
Figure 83 Belgium Export and Import Value & Volume, 2023-2030 ($)
Figure 84 Spain Advanced Functional Market Value & Volume, 2023-2030 ($)
Figure 85 Spain GDP and Population, 2023-2030 ($)
Figure 86 Spain GDP – Composition of 2023, By Sector of Origin
Figure 87 Spain Export and Import Value & Volume, 2023-2030 ($)
Figure 88 Denmark Advanced Functional Market Value & Volume, 2023-2030 ($)
Figure 89 Denmark GDP and Population, 2023-2030 ($)
Figure 90 Denmark GDP – Composition of 2023, By Sector of Origin
Figure 91 Denmark Export and Import Value & Volume, 2023-2030 ($)
Figure 92 APAC Advanced Functional Market Value & Volume, 2023-2030 ($)
Figure 93 China Advanced Functional MarketValue & Volume, 2023-2030
Figure 94 China GDP and Population, 2023-2030 ($)
Figure 95 China GDP – Composition of 2023, By Sector of Origin
Figure 96 China Export and Import Value & Volume, 2023-2030 ($)Advanced Functional MarketChina Export and Import Value & Volume, 2023-2030 ($)
Figure 97 Australia Advanced Functional Market Value & Volume, 2023-2030 ($)
Figure 98 Australia GDP and Population, 2023-2030 ($)
Figure 99 Australia GDP – Composition of 2023, By Sector of Origin
Figure 100 Australia Export and Import Value & Volume, 2023-2030 ($)
Figure 101 South Korea Advanced Functional Market Value & Volume, 2023-2030 ($)
Figure 102 South Korea GDP and Population, 2023-2030 ($)
Figure 103 South Korea GDP – Composition of 2023, By Sector of Origin
Figure 104 South Korea Export and Import Value & Volume, 2023-2030 ($)
Figure 105 India Advanced Functional Market Value & Volume, 2023-2030 ($)
Figure 106 India GDP and Population, 2023-2030 ($)
Figure 107 India GDP – Composition of 2023, By Sector of Origin
Figure 108 India Export and Import Value & Volume, 2023-2030 ($)
Figure 109 Taiwan Advanced Functional MarketTaiwan 3D Printing Market Value & Volume, 2023-2030 ($)
Figure 110 Taiwan GDP and Population, 2023-2030 ($)
Figure 111 Taiwan GDP – Composition of 2023, By Sector of Origin
Figure 112 Taiwan Export and Import Value & Volume, 2023-2030 ($)
Figure 113 Malaysia Advanced Functional MarketMalaysia 3D Printing Market Value & Volume, 2023-2030 ($)
Figure 114 Malaysia GDP and Population, 2023-2030 ($)
Figure 115 Malaysia GDP – Composition of 2023, By Sector of Origin
Figure 116 Malaysia Export and Import Value & Volume, 2023-2030 ($)
Figure 117 Hong Kong Advanced Functional MarketHong Kong 3D Printing Market Value & Volume, 2023-2030 ($)
Figure 118 Hong Kong GDP and Population, 2023-2030 ($)
Figure 119 Hong Kong GDP – Composition of 2023, By Sector of Origin
Figure 120 Hong Kong Export and Import Value & Volume, 2023-2030 ($)
Figure 121 Middle East & Africa Advanced Functional MarketMiddle East & Africa 3D Printing Market Value & Volume, 2023-2030 ($)
Figure 122 Russia Advanced Functional MarketRussia 3D Printing Market Value & Volume, 2023-2030 ($)
Figure 123 Russia GDP and Population, 2023-2030 ($)
Figure 124 Russia GDP – Composition of 2023, By Sector of Origin
Figure 125 Russia Export and Import Value & Volume, 2023-2030 ($)
Figure 126 Israel Advanced Functional Market Value & Volume, 2023-2030 ($)
Figure 127 Israel GDP and Population, 2023-2030 ($)
Figure 128 Israel GDP – Composition of 2023, By Sector of Origin
Figure 129 Israel Export and Import Value & Volume, 2023-2030 ($)
Figure 130 Entropy Share, By Strategies, 2023-2030* (%)Advanced Functional Market
Figure 131 Developments, 2023-2030*Advanced Functional Market
Figure 132 Company 1 Advanced Functional Market Net Revenue, By Years, 2023-2030* ($)
Figure 133 Company 1 Advanced Functional Market Net Revenue Share, By Business segments, 2023 (%)
Figure 134 Company 1 Advanced Functional Market Net Sales Share, By Geography, 2023 (%)
Figure 135 Company 2 Advanced Functional Market Net Revenue, By Years, 2023-2030* ($)
Figure 136 Company 2 Advanced Functional Market Net Revenue Share, By Business segments, 2023 (%)
Figure 137 Company 2 Advanced Functional Market Net Sales Share, By Geography, 2023 (%)
Figure 138 Company 3Advanced Functional Market Net Revenue, By Years, 2023-2030* ($)
Figure 139 Company 3Advanced Functional Market Net Revenue Share, By Business segments, 2023 (%)
Figure 140 Company 3Advanced Functional Market Net Sales Share, By Geography, 2023 (%)
Figure 141 Company 4 Advanced Functional Market Net Revenue, By Years, 2023-2030* ($)
Figure 142 Company 4 Advanced Functional Market Net Revenue Share, By Business segments, 2023 (%)
Figure 143 Company 4 Advanced Functional Market Net Sales Share, By Geography, 2023 (%)
Figure 144 Company 5 Advanced Functional Market Net Revenue, By Years, 2023-2030* ($)
Figure 145 Company 5 Advanced Functional Market Net Revenue Share, By Business segments, 2023 (%)
Figure 146 Company 5 Advanced Functional Market Net Sales Share, By Geography, 2023 (%)
Figure 147 Company 6 Advanced Functional Market Net Revenue, By Years, 2023-2030* ($)
Figure 148 Company 6 Advanced Functional Market Net Revenue Share, By Business segments, 2023 (%)
Figure 149 Company 6 Advanced Functional Market Net Sales Share, By Geography, 2023 (%)
Figure 150 Company 7 Advanced Functional Market Net Revenue, By Years, 2023-2030* ($)
Figure 151 Company 7 Advanced Functional Market Net Revenue Share, By Business segments, 2023 (%)
Figure 152 Company 7 Advanced Functional Market Net Sales Share, By Geography, 2023 (%)
Figure 153 Company 8 Advanced Functional Market Net Revenue, By Years, 2023-2030* ($)
Figure 154 Company 8 Advanced Functional Market Net Revenue Share, By Business segments, 2023 (%)
Figure 155 Company 8 Advanced Functional Market Net Sales Share, By Geography, 2023 (%)
Figure 156 Company 9 Advanced Functional Market Net Revenue, By Years, 2023-2030* ($)
Figure 157 Company 9 Advanced Functional Market Net Revenue Share, By Business segments, 2023 (%)
Figure 158 Company 9 Advanced Functional Market Net Sales Share, By Geography, 2023 (%)
Figure 159 Company 10 Advanced Functional Market Net Revenue, By Years, 2023-2030* ($)
Figure 160 Company 10 Advanced Functional Market Net Revenue Share, By Business segments, 2023 (%)
Figure 161 Company 10 Advanced Functional Market Net Sales Share, By Geography, 2023 (%)
Figure 162 Company 11 Advanced Functional Market Net Revenue, By Years, 2023-2030* ($)
Figure 163 Company 11 Advanced Functional Market Net Revenue Share, By Business segments, 2023 (%)
Figure 164 Company 11 Advanced Functional Market Net Sales Share, By Geography, 2023 (%)
Figure 165 Company 12 Advanced Functional Market Net Revenue, By Years, 2023-2030* ($)
Figure 166 Company 12 Advanced Functional Market Net Revenue Share, By Business segments, 2023 (%)
Figure 167 Company 12 Advanced Functional Market Net Sales Share, By Geography, 2023 (%)
Figure 168 Company 13Advanced Functional Market Net Revenue, By Years, 2023-2030* ($)
Figure 169 Company 13Advanced Functional Market Net Revenue Share, By Business segments, 2023 (%)
Figure 170 Company 13Advanced Functional Market Net Sales Share, By Geography, 2023 (%)
Figure 171 Company 14 Advanced Functional Market Net Revenue, By Years, 2023-2030* ($)
Figure 172 Company 14 Advanced Functional Market Net Revenue Share, By Business segments, 2023 (%)
Figure 173 Company 14 Advanced Functional Market Net Sales Share, By Geography, 2023 (%)
Figure 174 Company 15 Advanced Functional Market Net Revenue, By Years, 2023-2030* ($)
Figure 175 Company 15 Advanced Functional Market Net Revenue Share, By Business segments, 2023 (%)
Figure 176 Company 15 Advanced Functional Market Net Sales Share, By Geography, 2023 (%)