 Email
Email Print
Print


Gas Sensor Market Overview
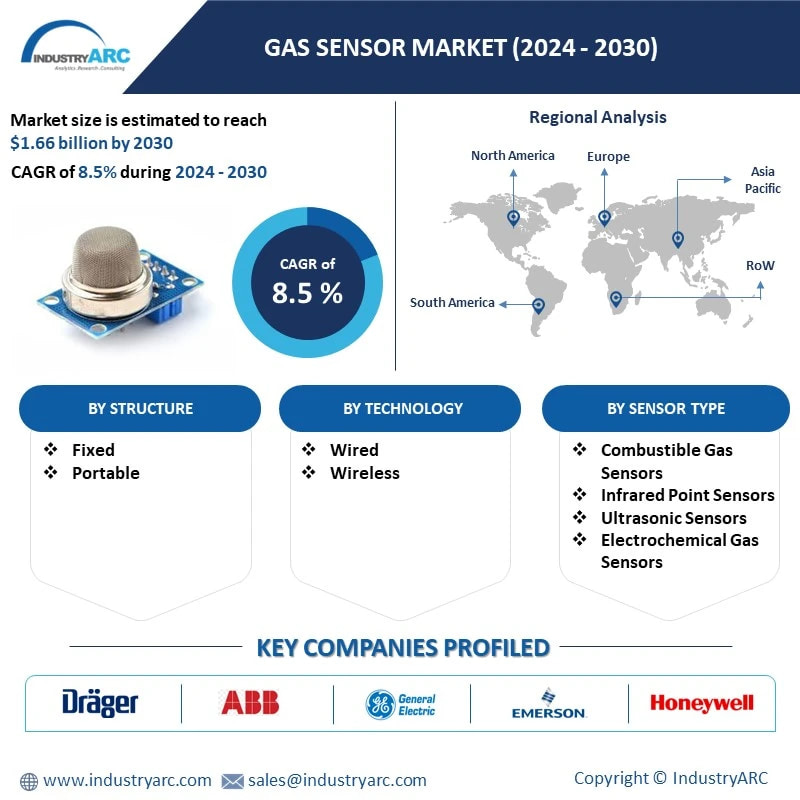
The market for Gas Sensor is forecast to reach $1.66 billion by 2030, growing at a CAGR of 8.5% from 2024 to 2030. The Gas Sensor Market is estimated to witness a sustainable growth over the forecast period majorly because Gas Sensor plays a major role in giving security, safety and various applications in Industries and other workplaces. Gas Sensor have their own respective features and provides various utilities. Gas sensors generally provide a measurement of the concentration of various gases such as CO, CO2, NOx, SO2 and Others by different sensors such as Combustible Gas Sensors, Infrared Point Sensors, Electrochemical Gas Sensors, Metal Oxide Semiconductor, Photo Ionization Detection, Paramagnetic and and Others. Gas sensors are commonly included as part of a health and safety system within the workplace, with portable instruments designed for protecting all workplaces when working in potentially hazardous areas. These vast features at various End-Use industries such as water treatment, food and beverage etc drives its market growth in global market. On the other hand, high installation and maintenance cost are the major challenges affecting its market growth. In recent years, there has been a notable trend towards integrating gas sensors with Internet of Things (IoT) platforms and smart devices. This integration allows for real-time monitoring, remote control, and data analysis of gas levels in various environments. Gas sensor manufacturers are increasingly incorporating wireless connectivity, such as Bluetooth, Wi-Fi, or LoRaWAN, into their products to enable seamless communication with smartphones, tablets, and cloud-based platforms. These smart gas sensors offer enhanced functionalities like predictive maintenance, anomaly detection, and customizable alerts, making them indispensable for industrial, environmental, and domestic applications. Moreover, the proliferation of smart homes and smart cities initiatives further drives the demand for gas sensors capable of interfacing with intelligent infrastructure for efficient resource management and enhanced safety measures. With growing concerns about air pollution and its detrimental effects on public health and the environment, there is an increasing demand for gas sensors tailored for air quality monitoring applications. Governments and regulatory bodies worldwide are implementing stringent environmental standards and regulations, mandating the continuous monitoring of pollutants such as carbon monoxide, nitrogen dioxide, sulfur dioxide, ozone, and particulate matter. This regulatory landscape drives the adoption of gas sensing technologies across industries, including automotive, industrial manufacturing, healthcare, and smart cities development. Gas sensor manufacturers are responding by developing innovative solutions with higher sensitivity, accuracy, and multi-gas detection capabilities to address the evolving requirements for environmental monitoring and compliance. Additionally, advancements in miniaturization and cost reduction techniques are making gas sensors more accessible for widespread deployment in indoor and outdoor air quality monitoring networks, fostering a sustainable approach towards mitigating air pollution and safeguarding public health.
Market Snapshot:
Report Coverage
The report: “Gas Sensor Market– Forecast (2024-2030)”, by IndustryARC covers an in-depth analysis of the following segments of the Gas Sensor Market.
By Sensor Type– Combustible Gas Sensors, Infrared Point Sensors, Ultrasonic Sensors, Electrochemical Gas Sensors, Metal-oxide-semiconductor Sensors (MOS sensors) and Others.
By Structure – Fixed and Portable Gas Sensor.
By Technology– Wire and Wireless Gas Sensor.
By End-Use Industry – Oil & Gas, Industrial, Automotive, Mining and Metal, Residential, Healthcare, Water treatment, Food & Beverages and Others.
By Geography - North America (U.S, Canada, Mexico), South America (Brazil, Argentina and others), Europe (Germany, UK, France, Italy, Spain, Russia and Others), APAC (China, Japan India, SK, Aus and Others), and RoW (Middle east and Africa).
Key Takeaways
● The Gas Sensor Market is estimated to witness a sustainable growth over the forecast period majorly role in giving security, safety and various applications in Industries and other workplaces.
● Due to increasing extraction and shipping of resources in various Oil and Gas Industries, the scope of different Gas Sensors has increased rapidly which boost its market growth.
● Ongoing Industrialization and Urbanization in major economies such as USA, Canada, China, India and others, the presence of harmful gases in atmosphere and increased rapidly which uplifts the demand of Gas Sensors in global market.
● With the rise in Governmental regulations and Environmental concerns against the rising air pollution intensity with hazardous gases in atmosphere, installation of Gas Sensors in all workplaces and near hospitals and Other public places tends to drive the market growth.
For more details on this report - Request for Sample
Gas Sensor Market Segment Analysis - By Structure
Portable Gas Sensors has dominated the Gas Sensor Market at 70% share in 2023 as compared to the Fixed Gas Sensors. The demand for Portable Gas Sensors is growing because in various Power plant and Oil & Gas Industries, the pipelines contain many hazardous elements that can cause short and long-term health problems if workers are exposed improperly. With Portable Gas Sensors and Detectors, one can examine any leaks and presence of any hazardous gas which can affect environment and industries and can be resolved quickly. Mainly Portable Gas Sensors operate through a wireless system, which allows them to check for gases remotely providing inspection of level of gases in certain areas from a safe distance. These vast features tend to drive the market of Portable Gas Sensors in global market.
Gas Sensor Market Segment Analysis - By End-Use Industry
Oil & Gas Industries hold the largest market in Gas Sensor Market at 22.4% share in 2023. The various Inspection methods which it offers to the Oil & Gas Industries as they mainly constitute in operation of many gases from extraction to production by transferring through pipelines. Thus, the requirement of Gas sensors increases rapidly. With the advancement in technologies, the adoption of Portable Gas Sensors offers wireless examination of various levels of gases operating in the system. This helps them to check for gases remotely providing inspection of various hazardous gases certain areas from a safe distance. These vast features tend to drive the market of Gas Sensors in Oil & Gas Industries.
Gas Sensor Market Segment Analysis - By Geography
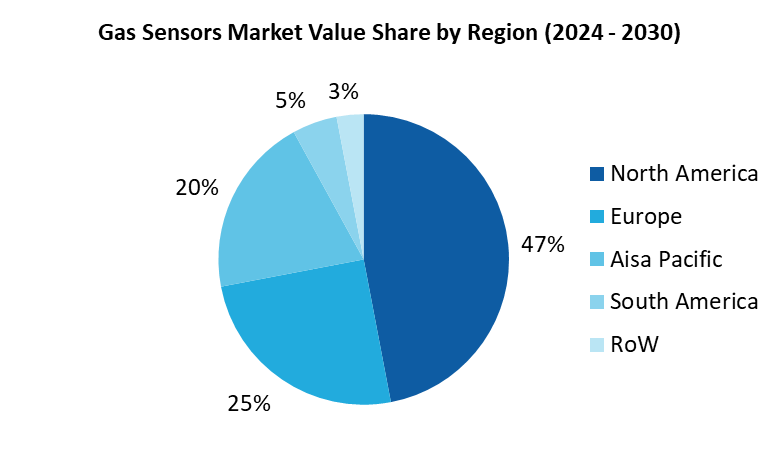
North America has been accounted for being the highest market at 47% share in 2023 among all the regions by geography. The market growth in this region is predominantly rising due to fast-growing economies such as China, India, Japan and Others. Increasing rate of Urbanization and Industrialization with high population densities in these economies tends to uplift the Gas Sensor Market in these regions. Due to large number of Oil & Gas Industries, Power plants, Healthcare and high air pollution intensity in atmosphere of these regions, the installation Gas Sensors tends to boost the market growth. On the other hand, APAC is closely followed by North America due to the rapid growth of Industries and rise in Environmental concerns due to air pollution tends to uplift the market growth of Gas Sensor.
Gas Sensor Market Drivers
Rise in Industrialization and Urbanization drives market growth
Fast growing economies in Asia-Pacific and North America are contributing exponentially in Gas Sensor Market. Due to rise in Urbanization and Industrialization, the demand for Gas Sensors in various Oil & Gas industries, Healthcare, Power plants has increased rapidly. This has promoted the developments in manufacturing of Gas Sensors from fixed systems to portable systems among which the adoption of Wireless Gas Sensors has brought a major uplift in its market growth. To maintain safety and security in the workplace of these industries, the adoption of Gas Sensors has brought a major boost in the market growth.
Rise in Governmental Regulations and Environmental Concerns
With the rise in Governmental Regulations of maintaining a pollution-free city in various regions has brought a huge demand of Gas Sensors in global market. Gas sensors helps in examining the various hazardous gases in the atmosphere and provides the measurement of the concentration of various gases such as CO, CO2, NOx, SO2 and Others in major workplaces and Industries and Other public places. This tends to drive the demand of Gas Sensor Market globally. Moreover, with the rise in Environmental Concerns to reduce the emission of harmful gases especially in Industrial regions to secure nearby Ecosystem. Gas sensors are commonly installed in industrial regions as part of a health and safety system within the workplace as well nearby ecosystem are the key factors boosting the growth of the Gas Sensor Market globally.
Gas Sensor Market Challenges
High Installation and Maintenance Cost
One of the major challenges faced by Gas Sensor Market globally is the High Installation and Maintenance Cost. The advancement in technologies has brought the manufacturing of Portable Wireless Gas Sensors, which provides examining the air purity and inspecting various hazardous gases in the atmosphere as well as in Industries where workers cannot have physical access thus providing examining from a safe distance. But, these systems require high installation cost which restraints end users from purchasing these systems. Moreover, it requires high maintenance cost as the components used in manufacturing of these Gas Sensors are of specific types of unique technology. These are the major challenges which restraint the Gas Sensor Market growth globally.
Gas Sensor Market Landscape
Product launches, acquisitions, and R&D activities are key strategies adopted by players in the Gas Sensor Market. The Gas Sensor Market is dominated by major companies such as Dragerwerk Ag & Co.KGAA, AMETEK, Honeywell International Inc., ABB Ltd., General Electric Co., Emerson Electric Co., Figaro Engineering Inc., Ametek Inc., Siemens AG, Trolex Ltd., Enerac Inc. and California Analytical Instruments Inc.
Acquisitions/Technology Launches/Partnerships
● In June 2023, Alphasense, the UK-based manufacturer of sensors for air quality monitoring and safety gas detection, has launched a compact new sensor format for portable devices.
● In Oct 2023 Sensata Launches First A2L Leak Detection Sensor Certified for Multiple HVAC Refrigerants. The new leak detection sensors support HVAC manufacturers’ transition to refrigerants with a lower global warming impact.
For more Electronics related reports, please click here
1. Gas Sensor Market - Market Overview
1.1 Definitions and Scope
2. Gas Sensor Market - Executive Summary
2.1 Market Revenue, Market Size and Key Trends by Company
2.2 Key trends By Sensor Type
2.3 Key trends segmented by geography
3. Gas Sensor Market– Industry Landscape
3.1 Comparative Analysis
3.1.1 product/Company Benchmarking-Top 5 Companies
3.1.2 Top 5 Financial Analysis
3.1.3 Market Value Split by Top 5 Companies
3.1.4 Patent Analysis
3.1.5 Pricing Analysis
4. Gas Sensor Market - Startup companies Scenario Premium (Premium)
4.1 Top 10 startup company Analysis by
4.1.1 Investment
4.1.2 Revenue
4.1.3 Market Shares
4.1.4 Market Size and Application Analysis
4.1.5 Venture Capital and Funding Scenario
5. Gas Sensor Market - Industry Market Entry Scenario Premium (Premium)
5.1 Regulatory Framework Overview
5.2 New Business and Ease of Doing business index
5.3 Case studies of successful ventures
5.4 Customer Analysis - Top 10 companies
6. Gas Sensor Market - Market Forces
6.1 Market Drivers
6.2 Market Constraints
6.3 Porters five force model
6.3.1 Bargaining power of suppliers
6.3.2 Bargaining powers of customers
6.3.3 Threat of new entrants
6.3.4 Rivalry among existing players
7. Gas Sensor Market - By Strategic Analysis (Market Size -$Million/Billion)
7.1 Value Cain Analysis
7.2 Opportunities Analysis
7.3 Product Life Cycle/Market Life Cycle Analysis
7.4 Supplier/Distributor Analysis
8. Gas Sensor Market – By Sensor Type (Market Size -$Million/Billion)
8.1 Combustible Gas Sensors,
8.2 Infrared Point Sensors,
8.3 Ultrasonic Sensors,
8.4 Electrochemical Gas Sensors,
8.5 Metal-oxide-semiconductor Sensors(MOS sensors)
8.6 Others
9. Gas Sensor Market – By Technology (Market Size -$Million/Billion)
9.1 Wired
9.2 Wireless
10. Gas Sensor Market – By Structure (Market Size -$Million/Billion)
10.1 Fixed
10.2 Portable
11. Gas Sensor Market – By End User (Market Size -$Million/Billion)
12.1 Oil & Gas
12.2 Residential
12.3 Healthcare,
12.4 Water treatment,
12.5 Food & Beverages
12.6 Mining and Metal
12.7 Automotive
12.8 Industrial
12.9 Others
13. Gas Sensor Market – By Geography
13.1 North America
13.1.1 U.S
13.1.2 Canada
13.1.3 Mexico
13.2 South America
13.2.1 Brazil
13.2.2 Argentina
13.2.3 Chile
13.2.4 Others
13.3 Europe
13.3.1 U.K
13.3.2 Germany
13.3.3 France
13.3.4 Italy
13.3.5 Netherlands
13.3.6 Belgium
13.3.7 Spain
13.3.8 Russia
13.3.9 Others
13.4 APAC
13.4.1 China
13.4.2 India
13.4.3 Japan
13.4.4 South Korea
13.4.5 Indonesia
13.4.6 Malaysia
13.4.7 Australia & New Zealand
13.4.8 Others
13.5 ROW
13.5.1 Middle East
13.5.2 Africa
14. Gas Sensor Market – Entropy
15. Gas Sensor Market – Industry / Segment Competition landscape Premium (Premium)
15.1 Market Share Analysis
15.1.1 Market Share by Region- Top 10 companies
15.1.2 Market Share By Sensor Type of Industry vertical – Top 10 companies
15.1.3 Market Share By Sensor Type of component- Top 10 companies
15.1.4 Market Share at global level- Top 10 companies
15.1.5 Best Practices for companies
16. Gas Sensor Market – Key Company List by Country Premium (Premium)
17. Gas Sensor Market -Company Analysis
17.1 ABB Ltd.
17.2 AMETEK, Inc.
17.3 Johnson Electric Holdings Limited
17.4 Siemens AG
17.5 Toshiba Corp.
17.6 Company 6
17.7 Company 7
17.8 Company 8
17.9 Company 9
17.10 Company 10
"*Financials would be provided on a best efforts basis for private companies"
18. Gas Sensor Market –Appendix (premium)
18.1 Abbreviations Sources
18.2 Sources
19. Gas Sensor Market -Methodology Premium (premium)
19.1 Research Methodology
19.1.1 Company Expert Interviews
19.1.2 Industry Databases
19.1.3 Associations
19.1.4 Company News
19.1.5 Company Annual Reports
19.1.6 Application Trends
19.1.7 New Products and Product Database
19.1.8 Company Transcripts
19.1.9 R&D Trends
19.1.10 Key Opinion Leaders Interviews
19.1.11 Supply and Demand Trends
List of Tables
Table 1: Gas Sensors Market Overview 2023-2030
Table 2: Gas Sensors Market Leader Analysis 2023-2030 (US$)
Table 3: Gas Sensors Market Product Analysis 2023-2030 (US$)
Table 4: Gas Sensors Market End User Analysis 2023-2030 (US$)
Table 5: Gas Sensors Market Patent Analysis 2013-2023* (US$)
Table 6: Gas Sensors Market Financial Analysis 2023-2030 (US$)
Table 7: Gas Sensors Market Driver Analysis 2023-2030 (US$)
Table 8: Gas Sensors Market Challenges Analysis 2023-2030 (US$)
Table 9: Gas Sensors Market Constraint Analysis 2023-2030 (US$)
Table 10: Gas Sensors Market Supplier Bargaining Power Analysis 2023-2030 (US$)
Table 11: Gas Sensors Market Buyer Bargaining Power Analysis 2023-2030 (US$)
Table 12: Gas Sensors Market Threat of Substitutes Analysis 2023-2030 (US$)
Table 13: Gas Sensors Market Threat of New Entrants Analysis 2023-2030 (US$)
Table 14: Gas Sensors Market Degree of Competition Analysis 2023-2030 (US$)
Table 15: Gas Sensors Market Value Chain Analysis 2023-2030 (US$)
Table 16: Gas Sensors Market Pricing Analysis 2023-2030 (US$)
Table 17: Gas Sensors Market Opportunities Analysis 2023-2030 (US$)
Table 18: Gas Sensors Market Product Life Cycle Analysis 2023-2030 (US$)
Table 19: Gas Sensors Market Supplier Analysis 2023-2030 (US$)
Table 20: Gas Sensors Market Distributor Analysis 2023-2030 (US$)
Table 21: Gas Sensors Market Trend Analysis 2023-2030 (US$)
Table 22: Gas Sensors Market Size 2023 (US$)
Table 23: Gas Sensors Market Forecast Analysis 2023-2030 (US$)
Table 24: Gas Sensors Market Sales Forecast Analysis 2023-2030 (Units)
Table 25: Gas Sensors Market, Revenue & Volume, By Type, 2023-2030 ($)
Table 26: Gas Sensors Market By Type, Revenue & Volume, By Catalytic Gas Sensor, 2023-2030 ($)
Table 27: Gas Sensors Market By Type, Revenue & Volume, By Thermal Gas Sensor, 2023-2030 ($)
Table 28: Gas Sensors Market By Type, Revenue & Volume, By Electrochemical Gas Sensor, 2023-2030 ($)
Table 29: Gas Sensors Market By Type, Revenue & Volume, By Optical Gas Sensor, 2023-2030 ($)
Table 30: Gas Sensors Market By Type, Revenue & Volume, By IR Gas Sensor, 2023-2030 ($)
Table 31: Gas Sensors Market, Revenue & Volume, By Gas Type, 2023-2030 ($)
Table 32: Gas Sensors Market By Gas Type, Revenue & Volume, By Oxygen (O2), 2023-2030 ($)
Table 33: Gas Sensors Market By Gas Type, Revenue & Volume, By Carbon monoxide (CO), 2023-2030 ($)
Table 34: Gas Sensors Market By Gas Type, Revenue & Volume, By Carbon Dioxide (CO2), 2023-2030 ($)
Table 35: Gas Sensors Market By Gas Type, Revenue & Volume, By NOx, 2023-2030 ($)
Table 36: Gas Sensors Market, Revenue & Volume, By Application, 2023-2030 ($)
Table 37: Gas Sensors Market By Application, Revenue & Volume, By Automotive, 2023-2030 ($)
Table 38: Gas Sensors Market By Application, Revenue & Volume, By Medical, 2023-2030 ($)
Table 39: Gas Sensors Market By Application, Revenue & Volume, By Industrial, 2023-2030 ($)
Table 40: Gas Sensors Market By Application, Revenue & Volume, By Petrochemical, 2023-2030 ($)
Table 41: North America Gas Sensors Market, Revenue & Volume, By Type, 2023-2030 ($)
Table 42: North America Gas Sensors Market, Revenue & Volume, By Gas Type, 2023-2030 ($)
Table 43: North America Gas Sensors Market, Revenue & Volume, By Application, 2023-2030 ($)
Table 44: South america Gas Sensors Market, Revenue & Volume, By Type, 2023-2030 ($)
Table 45: South america Gas Sensors Market, Revenue & Volume, By Gas Type, 2023-2030 ($)
Table 46: South america Gas Sensors Market, Revenue & Volume, By Application, 2023-2030 ($)
Table 47: Europe Gas Sensors Market, Revenue & Volume, By Type, 2023-2030 ($)
Table 48: Europe Gas Sensors Market, Revenue & Volume, By Gas Type, 2023-2030 ($)
Table 49: Europe Gas Sensors Market, Revenue & Volume, By Application, 2023-2030 ($)
Table 50: APAC Gas Sensors Market, Revenue & Volume, By Type, 2023-2030 ($)
Table 51: APAC Gas Sensors Market, Revenue & Volume, By Gas Type, 2023-2030 ($)
Table 52: APAC Gas Sensors Market, Revenue & Volume, By Application, 2023-2030 ($)
Table 53: Middle East & Africa Gas Sensors Market, Revenue & Volume, By Type, 2023-2030 ($)
Table 54: Middle East & Africa Gas Sensors Market, Revenue & Volume, By Gas Type, 2023-2030 ($)
Table 55: Middle East & Africa Gas Sensors Market, Revenue & Volume, By Application, 2023-2030 ($)
Table 56: Russia Gas Sensors Market, Revenue & Volume, By Type, 2023-2030 ($)
Table 57: Russia Gas Sensors Market, Revenue & Volume, By Gas Type, 2023-2030 ($)
Table 58: Russia Gas Sensors Market, Revenue & Volume, By Application, 2023-2030 ($)
Table 59: Israel Gas Sensors Market, Revenue & Volume, By Type, 2023-2030 ($)
Table 60: Israel Gas Sensors Market, Revenue & Volume, By Gas Type, 2023-2030 ($)
Table 61: Israel Gas Sensors Market, Revenue & Volume, By Application, 2023-2030 ($)
Table 62: Top Companies 2023 (US$)Gas Sensors Market, Revenue & Volume
Table 63: Product Launch 2023-2030Gas Sensors Market, Revenue & Volume
Table 64: Mergers & Acquistions 2023-2030Gas Sensors Market, Revenue & Volume
List of Figures
Figure 1: Overview of Gas Sensors Market 2023-2030
Figure 2: Market Share Analysis for Gas Sensors Market 2023 (US$)
Figure 3: Product Comparison in Gas Sensors Market 2023-2030 (US$)
Figure 4: End User Profile for Gas Sensors Market 2023-2030 (US$)
Figure 5: Patent Application and Grant in Gas Sensors Market 2013-2023* (US$)
Figure 6: Top 5 Companies Financial Analysis in Gas Sensors Market 2023-2030 (US$)
Figure 7: Market Entry Strategy in Gas Sensors Market 2023-2030
Figure 8: Ecosystem Analysis in Gas Sensors Market 2023
Figure 9: Average Selling Price in Gas Sensors Market 2023-2030
Figure 10: Top Opportunites in Gas Sensors Market 2023-2030
Figure 11: Market Life Cycle Analysis in Gas Sensors Market
Figure 12: GlobalBy TypeGas Sensors Market Revenue, 2023-2030 ($)
Figure 13: GlobalBy Gas TypeGas Sensors Market Revenue, 2023-2030 ($)
Figure 14: GlobalBy ApplicationGas Sensors Market Revenue, 2023-2030 ($)
Figure 15: Global Gas Sensors Market - By Geography
Figure 16: Global Gas Sensors Market Value & Volume, By Geography, 2023-2030 ($)
Figure 17: Global Gas Sensors Market CAGR, By Geography, 2023-2030 (%)
Figure 18: North America Gas Sensors Market Value & Volume, 2023-2030 ($)
Figure 19: US Gas Sensors Market Value & Volume, 2023-2030 ($)
Figure 20: US GDP and Population, 2023-2030 ($)
Figure 21: US GDP – Composition of 2023, By Sector of Origin
Figure 22: US Export and Import Value & Volume, 2023-2030 ($)
Figure 23: Canada Gas Sensors Market Value & Volume, 2023-2030 ($)
Figure 24: Canada GDP and Population, 2023-2030 ($)
Figure 25: Canada GDP – Composition of 2023, By Sector of Origin
Figure 26: Canada Export and Import Value & Volume, 2023-2030 ($)
Figure 27: Mexico Gas Sensors Market Value & Volume, 2023-2030 ($)
Figure 28: Mexico GDP and Population, 2023-2030 ($)
Figure 29: Mexico GDP – Composition of 2023, By Sector of Origin
Figure 30: Mexico Export and Import Value & Volume, 2023-2030 ($)
Figure 31: South America Gas Sensors Market Value & Volume, 2023-2030 ($)
Figure 32: Brazil Gas Sensors Market Value & Volume, 2023-2030 ($)
Figure 33: Brazil GDP and Population, 2023-2030 ($)
Figure 34: Brazil GDP – Composition of 2023, By Sector of Origin
Figure 35: Brazil Export and Import Value & Volume, 2023-2030 ($)
Figure 36: Venezuela Gas Sensors Market Value & Volume, 2023-2030 ($)
Figure 37: Venezuela GDP and Population, 2023-2030 ($)
Figure 38: Venezuela GDP – Composition of 2023, By Sector of Origin
Figure 39: Venezuela Export and Import Value & Volume, 2023-2030 ($)
Figure 40: Argentina Gas Sensors Market Value & Volume, 2023-2030 ($)
Figure 41: Argentina GDP and Population, 2023-2030 ($)
Figure 42: Argentina GDP – Composition of 2023, By Sector of Origin
Figure 43: Argentina Export and Import Value & Volume, 2023-2030 ($)
Figure 44: Ecuador Gas Sensors Market Value & Volume, 2023-2030 ($)
Figure 45: Ecuador GDP and Population, 2023-2030 ($)
Figure 46: Ecuador GDP – Composition of 2023, By Sector of Origin
Figure 47: Ecuador Export and Import Value & Volume, 2023-2030 ($)
Figure 48: Peru Gas Sensors Market Value & Volume, 2023-2030 ($)
Figure 49: Peru GDP and Population, 2023-2030 ($)
Figure 50: Peru GDP – Composition of 2023, By Sector of Origin
Figure 51: Peru Export and Import Value & Volume, 2023-2030 ($)
Figure 52: Colombia Gas Sensors Market Value & Volume, 2023-2030 ($)
Figure 53: Colombia GDP and Population, 2023-2030 ($)
Figure 54: Colombia GDP – Composition of 2023, By Sector of Origin
Figure 55: Colombia Export and Import Value & Volume, 2023-2030 ($)
Figure 56: Costa Rica Gas Sensors Market Value & Volume, 2023-2030 ($)
Figure 57: Costa Rica GDP and Population, 2023-2030 ($)
Figure 58: Costa Rica GDP – Composition of 2023, By Sector of Origin
Figure 59: Costa Rica Export and Import Value & Volume, 2023-2030 ($)
Figure 60: Europe Gas Sensors Market Value & Volume, 2023-2030 ($)
Figure 61: U.K Gas Sensors Market Value & Volume, 2023-2030 ($)
Figure 62: U.K GDP and Population, 2023-2030 ($)
Figure 63: U.K GDP – Composition of 2023, By Sector of Origin
Figure 64: U.K Export and Import Value & Volume, 2023-2030 ($)
Figure 65: Germany Gas Sensors Market Value & Volume, 2023-2030 ($)
Figure 66: Germany GDP and Population, 2023-2030 ($)
Figure 67: Germany GDP – Composition of 2023, By Sector of Origin
Figure 68: Germany Export and Import Value & Volume, 2023-2030 ($)
Figure 69: Italy Gas Sensors Market Value & Volume, 2023-2030 ($)
Figure 70: Italy GDP and Population, 2023-2030 ($)
Figure 71: Italy GDP – Composition of 2023, By Sector of Origin
Figure 72: Italy Export and Import Value & Volume, 2023-2030 ($)
Figure 73: France Gas Sensors Market Value & Volume, 2023-2030 ($)
Figure 74: France GDP and Population, 2023-2030 ($)
Figure 75: France GDP – Composition of 2023, By Sector of Origin
Figure 76: France Export and Import Value & Volume, 2023-2030 ($)
Figure 77: Netherlands Gas Sensors Market Value & Volume, 2023-2030 ($)
Figure 78: Netherlands GDP and Population, 2023-2030 ($)
Figure 79: Netherlands GDP – Composition of 2023, By Sector of Origin
Figure 80: Netherlands Export and Import Value & Volume, 2023-2030 ($)
Figure 81: Belgium Gas Sensors Market Value & Volume, 2023-2030 ($)
Figure 82: Belgium GDP and Population, 2023-2030 ($)
Figure 83: Belgium GDP – Composition of 2023, By Sector of Origin
Figure 84: Belgium Export and Import Value & Volume, 2023-2030 ($)
Figure 85: Spain Gas Sensors Market Value & Volume, 2023-2030 ($)
Figure 86: Spain GDP and Population, 2023-2030 ($)
Figure 87: Spain GDP – Composition of 2023, By Sector of Origin
Figure 88: Spain Export and Import Value & Volume, 2023-2030 ($)
Figure 89: Denmark Gas Sensors Market Value & Volume, 2023-2030 ($)
Figure 90: Denmark GDP and Population, 2023-2030 ($)
Figure 91: Denmark GDP – Composition of 2023, By Sector of Origin
Figure 92: Denmark Export and Import Value & Volume, 2023-2030 ($)
Figure 93: APAC Gas Sensors Market Value & Volume, 2023-2030 ($)
Figure 94: China Gas Sensors Market Value & Volume, 2023-2030
Figure 95: China GDP and Population, 2023-2030 ($)
Figure 96: China GDP – Composition of 2023, By Sector of Origin
Figure 97: China Export and Import Value & Volume, 2023-2030 ($)Gas Sensors Market China Export and Import Value & Volume, 2023-2030 ($)
Figure 98: Australia Gas Sensors Market Value & Volume, 2023-2030 ($)
Figure 99: Australia GDP and Population, 2023-2030 ($)
Figure 100: Australia GDP – Composition of 2023, By Sector of Origin
Figure 101: Australia Export and Import Value & Volume, 2023-2030 ($)
Figure 102: South Korea Gas Sensors Market Value & Volume, 2023-2030 ($)
Figure 103: South Korea GDP and Population, 2023-2030 ($)
Figure 104: South Korea GDP – Composition of 2023, By Sector of Origin
Figure 105: South Korea Export and Import Value & Volume, 2023-2030 ($)
Figure 106: India Gas Sensors Market Value & Volume, 2023-2030 ($)
Figure 107: India GDP and Population, 2023-2030 ($)
Figure 108: India GDP – Composition of 2023, By Sector of Origin
Figure 109: India Export and Import Value & Volume, 2023-2030 ($)
Figure 110: Taiwan Gas Sensors Market Value & Volume, 2023-2030 ($)
Figure 111: Taiwan GDP and Population, 2023-2030 ($)
Figure 112: Taiwan GDP – Composition of 2023, By Sector of Origin
Figure 113: Taiwan Export and Import Value & Volume, 2023-2030 ($)
Figure 114: Malaysia Gas Sensors Market Value & Volume, 2023-2030 ($)
Figure 115: Malaysia GDP and Population, 2023-2030 ($)
Figure 116: Malaysia GDP – Composition of 2023, By Sector of Origin
Figure 117: Malaysia Export and Import Value & Volume, 2023-2030 ($)
Figure 118: Hong Kong Gas Sensors Market Value & Volume, 2023-2030 ($)
Figure 119: Hong Kong GDP and Population, 2023-2030 ($)
Figure 120: Hong Kong GDP – Composition of 2023, By Sector of Origin
Figure 121: Hong Kong Export and Import Value & Volume, 2023-2030 ($)
Figure 122: Middle East & Africa Gas Sensors Market Middle East & Africa 3D Printing Market Value & Volume, 2023-2030 ($)
Figure 123: Russia Gas Sensors Market Value & Volume, 2023-2030 ($)
Figure 124: Russia GDP and Population, 2023-2030 ($)
Figure 125: Russia GDP – Composition of 2023, By Sector of Origin
Figure 126: Russia Export and Import Value & Volume, 2023-2030 ($)
Figure 127: Israel Gas Sensors Market Value & Volume, 2023-2030 ($)
Figure 128: Israel GDP and Population, 2023-2030 ($)
Figure 129: Israel GDP – Composition of 2023, By Sector of Origin
Figure 130: Israel Export and Import Value & Volume, 2023-2030 ($)
Figure 131: Entropy Share, By Strategies, 2023-2030* (%)Gas Sensors Market
Figure 132: Developments, 2023-2030*Gas Sensors Market
Figure 133: Company 1 Gas Sensors Market Net Revenue, By Years, 2023-2030* ($)
Figure 134: Company 1 Gas Sensors Market Net Revenue Share, By Business segments, 2023 (%)
Figure 135: Company 1 Gas Sensors Market Net Sales Share, By Geography, 2023 (%)
Figure 136: Company 2 Gas Sensors Market Net Revenue, By Years, 2023-2030* ($)
Figure 137: Company 2 Gas Sensors Market Net Revenue Share, By Business segments, 2023 (%)
Figure 138: Company 2 Gas Sensors Market Net Sales Share, By Geography, 2023 (%)
Figure 139: Company 3 Gas Sensors Market Net Revenue, By Years, 2023-2030* ($)
Figure 140: Company 3 Gas Sensors Market Net Revenue Share, By Business segments, 2023 (%)
Figure 141: Company 3 Gas Sensors Market Net Sales Share, By Geography, 2023 (%)
Figure 142: Company 4 Gas Sensors Market Net Revenue, By Years, 2023-2030* ($)
Figure 143: Company 4 Gas Sensors Market Net Revenue Share, By Business segments, 2023 (%)
Figure 144: Company 4 Gas Sensors Market Net Sales Share, By Geography, 2023 (%)
Figure 145: Company 5 Gas Sensors Market Net Revenue, By Years, 2023-2030* ($)
Figure 146: Company 5 Gas Sensors Market Net Revenue Share, By Business segments, 2023 (%)
Figure 147: Company 5 Gas Sensors Market Net Sales Share, By Geography, 2023 (%)
Figure 148: Company 6 Gas Sensors Market Net Revenue, By Years, 2023-2030* ($)
Figure 149: Company 6 Gas Sensors Market Net Revenue Share, By Business segments, 2023 (%)
Figure 150: Company 6 Gas Sensors Market Net Sales Share, By Geography, 2023 (%)
Figure 151: Company 7 Gas Sensors Market Net Revenue, By Years, 2023-2030* ($)
Figure 152: Company 7 Gas Sensors Market Net Revenue Share, By Business segments, 2023 (%)
Figure 153: Company 7 Gas Sensors Market Net Sales Share, By Geography, 2023 (%)
Figure 154: Company 8 Gas Sensors Market Net Revenue, By Years, 2023-2030* ($)
Figure 155: Company 8 Gas Sensors Market Net Revenue Share, By Business segments, 2023 (%)
Figure 156: Company 8 Gas Sensors Market Net Sales Share, By Geography, 2023 (%)
Figure 157: Company 9 Gas Sensors Market Net Revenue, By Years, 2023-2030* ($)
Figure 158: Company 9 Gas Sensors Market Net Revenue Share, By Business segments, 2023 (%)
Figure 159: Company 9 Gas Sensors Market Net Sales Share, By Geography, 2023 (%)
Figure 160: Company 10 Gas Sensors Market Net Revenue, By Years, 2023-2030* ($)
Figure 161: Company 10 Gas Sensors Market Net Revenue Share, By Business segments, 2023 (%)
Figure 162: Company 10 Gas Sensors Market Net Sales Share, By Geography, 2023 (%)
Figure 163: Company 11 Gas Sensors Market Net Revenue, By Years, 2023-2030* ($)
Figure 164: Company 11 Gas Sensors Market Net Revenue Share, By Business segments, 2023 (%)
Figure 165: Company 11 Gas Sensors Market Net Sales Share, By Geography, 2023 (%)
Figure 166: Company 12 Gas Sensors Market Net Revenue, By Years, 2023-2030* ($)
Figure 167: Company 12 Gas Sensors Market Net Revenue Share, By Business segments, 2023 (%)
Figure 168: Company 12 Gas Sensors Market Net Sales Share, By Geography, 2023 (%)
Figure 169: Company 13 Gas Sensors Market Net Revenue, By Years, 2023-2030* ($)
Figure 170: Company 13 Gas Sensors Market Net Revenue Share, By Business segments, 2023 (%)
Figure 171: Company 13 Gas Sensors Market Net Sales Share, By Geography, 2023 (%)
Figure 172: Company 14 Gas Sensors Market Net Revenue, By Years, 2023-2030* ($)
Figure 173: Company 14 Gas Sensors Market Net Revenue Share, By Business segments, 2023 (%)
Figure 174: Company 14 Gas Sensors Market Net Sales Share, By Geography, 2023 (%)
Figure 175: Company 15 Gas Sensors Market Net Revenue, By Years, 2023-2030* ($)
Figure 176: Company 15 Gas Sensors Market Net Revenue Share, By Business segments, 2023 (%)
Figure 177: Company 15 Gas Sensors Market Net Sales Share, By Geography, 2023 (%)