 Email
Email Print
Print


High Availability Server Market - Forecast(2024 - 2030)
High-availability systems/servers are any systems capable of working continuously for a long time without any breakdown. These are the systems capable of storing critical and large amount of data and offer higher stability, flexibility, reliability, and speed along with almost zero probability of system failure for the industries generating large amount of data. Rapidly changing BFSI industry is the prime growth driver for these types of servers as this industry executes large number of transaction with large pool of data which is critical for daily functioning of this industry.
This report identifies the High Availability Server market size in for the year 2014-2016, and forecast of the same for year 2021. It also highlights the potential growth opportunities in the coming years, while also reviewing the market drivers, restraints, growth indicators, challenges, market dynamics, competitive landscape, and other key aspects with respect to High Availability Server market.
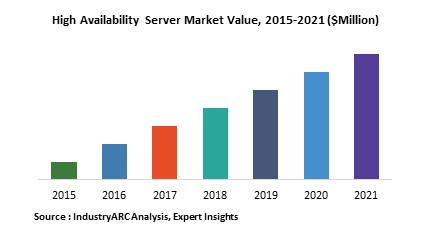
Globally demand for High Availability Server is expected to witness growth in the upcoming future due to rapidly changing banking and financial services in the developing nation. North America represents the highest market share in the global High Availability Server due to higher installed numbers in major end-use sectors in the region followed by Europe and Asia-Pacific with the second and third highest market share amongst all the major regions.
High Availability Server market is further also segmented based on the spectrum type, Operating system and industries as follows:
Sample Companies Profiled in this Report are:
This report identifies the High Availability Server market size in for the year 2014-2016, and forecast of the same for year 2021. It also highlights the potential growth opportunities in the coming years, while also reviewing the market drivers, restraints, growth indicators, challenges, market dynamics, competitive landscape, and other key aspects with respect to High Availability Server market.
Globally demand for High Availability Server is expected to witness growth in the upcoming future due to rapidly changing banking and financial services in the developing nation. North America represents the highest market share in the global High Availability Server due to higher installed numbers in major end-use sectors in the region followed by Europe and Asia-Pacific with the second and third highest market share amongst all the major regions.
High Availability Server market is further also segmented based on the spectrum type, Operating system and industries as follows:
- Global High Availability Server Market, on spectrum type is divided as: Availability Level, Availability Level 2, Availability Level 3, Availability Level 4 and higher
- Based on the operating systems used global high availability server market is segmented as: Windows, Linux, Unix and Others
- Global High Availability Server Market is segmented on the basis of end-use industry as follows: Banking & Financial Institution, IT & Telecommunications, Manufacturing, Retail, Government Institutions, Medical & Healthcare and Others
- This report has been further segmented into major regions, which includes detailed analysis of each region such as: North America, Europe, Asia-Pacific (APAC), and Rest of the World (RoW) covering all the major country level markets in each of the region.
Sample Companies Profiled in this Report are:
- IBM Corporation
- Dell Inc.
- Hewlett-Packard Company
- NEC Corporation
- Oracle Corporation
- 10+.
1. High Availability Server – Market Overview
2. Executive Summary
3. High Availability Server Market Landscape
3.1. Market Share Analysis
3.2. Comparative Analysis
3.2.1. Product Benchmarking
3.2.2. End User Profiling
3.2.3. Top 5 Financials Analysis
4. High Availability Server – Market Forces
4.1. Drivers
4.1.1. Growing demand from banking & financial institutions
4.2. Restraints
4.2.1. High procurement and maintenance cost
4.3. Opportunities
4.3.1. Increasing cloud based technologies
4.4. Challenges
4.5. Porter’s Five Forces Analysis
4.5.1. Bargaining Power of Suppliers
4.5.2. Bargaining Power of Buyers
4.5.3. Threat of New Entrants
4.5.4. Threat of Substitutes
4.5.5. Degree of Competition
5. High Availability Server Market – Strategic Analysis
5.1. Value Chain Analysis
5.2. Pricing Analysis
5.3. Opportunities Analysis
5.4. Product/Market Life Cycle Analysis
5.5. Suppliers and Distributors
6. Global High Availability Server Market, By Spectrum Type
6.1. Availability Level 1
6.2. Availability Level 2
6.3. Availability Level 3
6.4. Availability Level 4 and higher
7. Global High Availability Server Market, By Operating Systems
7.1. Windows
7.2. Linux
7.3. Unix
7.4. Others
8. Global High Availability Server Market, By Industry
8.1. Banking & Financial Institution
8.2. IT & Telecommunications
8.3. Manufacturing
8.4. Retail
8.5. Government Institutions
8.6. Medical & Healthcare
8.7. Others
9. Global High Availability Server Market, By Geography
9.1. Europe
9.1.1. Germany
9.1.2. France
9.1.3. Italy
9.1.4. Spain
9.1.5. Russia
9.1.6. U.K.
9.1.7. Rest of Europe
9.2. Asia Pacific
9.2.1. China
9.2.2. India
9.2.3. Japan
9.2.4. South Korea
9.2.5. Rest of Asia-Pacific
9.3. North America
9.3.1. U.S.
9.3.2. Canada
9.3.3. Mexico
9.4. Rest of the World (RoW)
9.4.1. Brazil
9.4.2. Rest of RoW
10. High Availability Server – Market Entropy
10.1. Expansion
10.2. Technological Developments
10.3. Merger & Acquisitions, and Joint Ventures
10.4. Supply- Contract
11. Company Profiles (Top 10 Companies)
11.1. IBM Corporation
11.1.1. Introduction
11.1.2. Financials
11.1.3. Key Insights
11.1.4. Key Strategy
11.1.5. Product Portfolio
11.1.6. SWOT Analysis
11.2. Dell Inc.
11.2.1. Introduction
11.2.2. Financials
11.2.3. Key Insights
11.2.4. Key Strategy
11.2.5. Product Portfolio
11.2.6. SWOT Analysis
11.3. Hewlett-Packard Company
11.3.1. Introduction
11.3.2. Financials
11.3.3. Key Insights
11.3.4. Key Strategy
11.3.5. Product Portfolio
11.3.6. SWOT Analysis
11.4. NEC Corporation
11.4.1. Introduction
11.4.2. Financials
11.4.3. Key Insights
11.4.4. Key Strategy
11.4.5. Product Portfolio
11.4.6. SWOT Analysis
11.5. Oracle Corporation
11.5.1. Introduction
11.5.2. Financials
11.5.3. Key Insights
11.5.4. Key Strategy
11.5.5. Product Portfolio
11.5.6. SWOT Analysis
11.6. CenterServ
11.6.1. Introduction
11.6.2. Financials
11.6.3. Key Insights
11.6.4. Key Strategy
11.6.5. Product Portfolio
11.6.6. SWOT Analysis
11.7. Fujitsu
11.7.1. Introduction
11.7.2. Financials
11.7.3. Key Insights
11.7.4. Key Strategy
11.7.5. Product Portfolio
11.7.6. SWOT Analysis
11.8. Unisys Global Technologies
11.8.1. Introduction
11.8.2. Financials
11.8.3. Key Insights
11.8.4. Key Strategy
11.8.5. Product Portfolio
11.8.6. SWOT Analysis
11.9. Cisco Systems Inc.
11.9.1. Introduction
11.9.2. Financials
11.9.3. Key Insights
11.9.4. Key Strategy
11.9.5. Product Portfolio
11.9.6. SWOT Analysis
11.10. Stratus Technologies
11.10.1. Introduction
11.10.2. Financials
11.10.3. Key Insights
11.10.4. Key Strategy
11.10.5. Product Portfolio
11.10.6. SWOT Analysis
*More than 10 Companies are profiled in this Research Report*
"*Financials would be provided on a best efforts basis for private companies"
12. Appendix
12.1. Abbreviations
12.2. Sources
12.3. Research Methodology
12.4. Expert Insights
List of Tables
Table 1 High Availability Server Market Overview 2023-2030
Table 2 High Availability Server Market Leader Analysis 2023-2030 (US$)
Table 3 High Availability Server MarketProduct Analysis 2023-2030 (US$)
Table 4 High Availability Server MarketEnd User Analysis 2023-2030 (US$)
Table 5 High Availability Server MarketPatent Analysis 2013-2023* (US$)
Table 6 High Availability Server MarketFinancial Analysis 2023-2030 (US$)
Table 7 High Availability Server Market Driver Analysis 2023-2030 (US$)
Table 8 High Availability Server MarketChallenges Analysis 2023-2030 (US$)
Table 9 High Availability Server MarketConstraint Analysis 2023-2030 (US$)
Table 10 High Availability Server Market Supplier Bargaining Power Analysis 2023-2030 (US$)
Table 11 High Availability Server Market Buyer Bargaining Power Analysis 2023-2030 (US$)
Table 12 High Availability Server Market Threat of Substitutes Analysis 2023-2030 (US$)
Table 13 High Availability Server Market Threat of New Entrants Analysis 2023-2030 (US$)
Table 14 High Availability Server Market Degree of Competition Analysis 2023-2030 (US$)
Table 15 High Availability Server MarketValue Chain Analysis 2023-2030 (US$)
Table 16 High Availability Server MarketPricing Analysis 2023-2030 (US$)
Table 17 High Availability Server MarketOpportunities Analysis 2023-2030 (US$)
Table 18 High Availability Server MarketProduct Life Cycle Analysis 2023-2030 (US$)
Table 19 High Availability Server MarketSupplier Analysis 2023-2030 (US$)
Table 20 High Availability Server MarketDistributor Analysis 2023-2030 (US$)
Table 21 High Availability Server Market Trend Analysis 2023-2030 (US$)
Table 22 High Availability Server Market Size 2023 (US$)
Table 23 High Availability Server Market Forecast Analysis 2023-2030 (US$)
Table 24 High Availability Server Market Sales Forecast Analysis 2023-2030 (Units)
Table 25 High Availability Server Market, Revenue & Volume,By Spectrum Type, 2023-2030 ($)
Table 26 High Availability Server MarketBy Spectrum Type, Revenue & Volume,By Availability Level 1, 2023-2030 ($)
Table 27 High Availability Server MarketBy Spectrum Type, Revenue & Volume,By Availability Level 2, 2023-2030 ($)
Table 28 High Availability Server MarketBy Spectrum Type, Revenue & Volume,By Availability Level 3, 2023-2030 ($)
Table 29 High Availability Server MarketBy Spectrum Type, Revenue & Volume,By Availability Level 4 and higher, 2023-2030 ($)
Table 30 High Availability Server Market, Revenue & Volume,By Operating Systems, 2023-2030 ($)
Table 31 High Availability Server MarketBy Operating Systems, Revenue & Volume,By Windows, 2023-2030 ($)
Table 32 High Availability Server MarketBy Operating Systems, Revenue & Volume,By Linux, 2023-2030 ($)
Table 33 High Availability Server MarketBy Operating Systems, Revenue & Volume,By Unix, 2023-2030 ($)
Table 34 High Availability Server MarketBy Operating Systems, Revenue & Volume,By Others, 2023-2030 ($)
Table 35 High Availability Server Market, Revenue & Volume,By Industry, 2023-2030 ($)
Table 36 High Availability Server MarketBy Industry, Revenue & Volume,By Banking & Financial Institution, 2023-2030 ($)
Table 37 High Availability Server MarketBy Industry, Revenue & Volume,By IT & Telecommunications, 2023-2030 ($)
Table 38 High Availability Server MarketBy Industry, Revenue & Volume,By Manufacturing, 2023-2030 ($)
Table 39 High Availability Server MarketBy Industry, Revenue & Volume,By Retail, 2023-2030 ($)
Table 40 High Availability Server MarketBy Industry, Revenue & Volume,By Government Institutions, 2023-2030 ($)
Table 41 North America High Availability Server Market, Revenue & Volume,By Spectrum Type, 2023-2030 ($)
Table 42 North America High Availability Server Market, Revenue & Volume,By Operating Systems, 2023-2030 ($)
Table 43 North America High Availability Server Market, Revenue & Volume,By Industry, 2023-2030 ($)
Table 44 South america High Availability Server Market, Revenue & Volume,By Spectrum Type, 2023-2030 ($)
Table 45 South america High Availability Server Market, Revenue & Volume,By Operating Systems, 2023-2030 ($)
Table 46 South america High Availability Server Market, Revenue & Volume,By Industry, 2023-2030 ($)
Table 47 Europe High Availability Server Market, Revenue & Volume,By Spectrum Type, 2023-2030 ($)
Table 48 Europe High Availability Server Market, Revenue & Volume,By Operating Systems, 2023-2030 ($)
Table 49 Europe High Availability Server Market, Revenue & Volume,By Industry, 2023-2030 ($)
Table 50 APAC High Availability Server Market, Revenue & Volume,By Spectrum Type, 2023-2030 ($)
Table 51 APAC High Availability Server Market, Revenue & Volume,By Operating Systems, 2023-2030 ($)
Table 52 APAC High Availability Server Market, Revenue & Volume,By Industry, 2023-2030 ($)
Table 53 Middle East & Africa High Availability Server Market, Revenue & Volume,By Spectrum Type, 2023-2030 ($)
Table 54 Middle East & Africa High Availability Server Market, Revenue & Volume,By Operating Systems, 2023-2030 ($)
Table 55 Middle East & Africa High Availability Server Market, Revenue & Volume,By Industry, 2023-2030 ($)
Table 56 Russia High Availability Server Market, Revenue & Volume,By Spectrum Type, 2023-2030 ($)
Table 57 Russia High Availability Server Market, Revenue & Volume,By Operating Systems, 2023-2030 ($)
Table 58 Russia High Availability Server Market, Revenue & Volume,By Industry, 2023-2030 ($)
Table 59 Israel High Availability Server Market, Revenue & Volume,By Spectrum Type, 2023-2030 ($)
Table 60 Israel High Availability Server Market, Revenue & Volume,By Operating Systems, 2023-2030 ($)
Table 61 Israel High Availability Server Market, Revenue & Volume,By Industry, 2023-2030 ($)
Table 62 Top Companies 2023 (US$)High Availability Server Market, Revenue & Volume,,
Table 63 Product Launch 2023-2030High Availability Server Market, Revenue & Volume,,
Table 64 Mergers & Acquistions 2023-2030High Availability Server Market, Revenue & Volume,,
List of Figures
Figure 1 Overview of High Availability Server Market 2023-2030
Figure 2 Market Share Analysis for High Availability Server Market 2023 (US$)
Figure 3 Product Comparison in High Availability Server Market 2023-2030 (US$)
Figure 4 End User Profile for High Availability Server Market 2023-2030 (US$)
Figure 5 Patent Application and Grant in High Availability Server Market 2013-2023* (US$)
Figure 6 Top 5 Companies Financial Analysis in High Availability Server Market 2023-2030 (US$)
Figure 7 Market Entry Strategy in High Availability Server Market 2023-2030
Figure 8 Ecosystem Analysis in High Availability Server Market2023
Figure 9 Average Selling Price in High Availability Server Market 2023-2030
Figure 10 Top Opportunites in High Availability Server Market 2023-2030
Figure 11 Market Life Cycle Analysis in High Availability Server Market
Figure 12 GlobalBy Spectrum TypeHigh Availability Server Market Revenue, 2023-2030 ($)
Figure 13 GlobalBy Operating SystemsHigh Availability Server Market Revenue, 2023-2030 ($)
Figure 14 GlobalBy IndustryHigh Availability Server Market Revenue, 2023-2030 ($)
Figure 15 Global High Availability Server Market - By Geography
Figure 16 Global High Availability Server Market Value & Volume, By Geography, 2023-2030 ($)
Figure 17 Global High Availability Server Market CAGR, By Geography, 2023-2030 (%)
Figure 18 North America High Availability Server Market Value & Volume, 2023-2030 ($)
Figure 19 US High Availability Server Market Value & Volume, 2023-2030 ($)
Figure 20 US GDP and Population, 2023-2030 ($)
Figure 21 US GDP – Composition of 2023, By Sector of Origin
Figure 22 US Export and Import Value & Volume, 2023-2030 ($)
Figure 23 Canada High Availability Server Market Value & Volume, 2023-2030 ($)
Figure 24 Canada GDP and Population, 2023-2030 ($)
Figure 25 Canada GDP – Composition of 2023, By Sector of Origin
Figure 26 Canada Export and Import Value & Volume, 2023-2030 ($)
Figure 27 Mexico High Availability Server Market Value & Volume, 2023-2030 ($)
Figure 28 Mexico GDP and Population, 2023-2030 ($)
Figure 29 Mexico GDP – Composition of 2023, By Sector of Origin
Figure 30 Mexico Export and Import Value & Volume, 2023-2030 ($)
Figure 31 South America High Availability Server MarketSouth America 3D Printing Market Value & Volume, 2023-2030 ($)
Figure 32 Brazil High Availability Server Market Value & Volume, 2023-2030 ($)
Figure 33 Brazil GDP and Population, 2023-2030 ($)
Figure 34 Brazil GDP – Composition of 2023, By Sector of Origin
Figure 35 Brazil Export and Import Value & Volume, 2023-2030 ($)
Figure 36 Venezuela High Availability Server Market Value & Volume, 2023-2030 ($)
Figure 37 Venezuela GDP and Population, 2023-2030 ($)
Figure 38 Venezuela GDP – Composition of 2023, By Sector of Origin
Figure 39 Venezuela Export and Import Value & Volume, 2023-2030 ($)
Figure 40 Argentina High Availability Server Market Value & Volume, 2023-2030 ($)
Figure 41 Argentina GDP and Population, 2023-2030 ($)
Figure 42 Argentina GDP – Composition of 2023, By Sector of Origin
Figure 43 Argentina Export and Import Value & Volume, 2023-2030 ($)
Figure 44 Ecuador High Availability Server Market Value & Volume, 2023-2030 ($)
Figure 45 Ecuador GDP and Population, 2023-2030 ($)
Figure 46 Ecuador GDP – Composition of 2023, By Sector of Origin
Figure 47 Ecuador Export and Import Value & Volume, 2023-2030 ($)
Figure 48 Peru High Availability Server Market Value & Volume, 2023-2030 ($)
Figure 49 Peru GDP and Population, 2023-2030 ($)
Figure 50 Peru GDP – Composition of 2023, By Sector of Origin
Figure 51 Peru Export and Import Value & Volume, 2023-2030 ($)
Figure 52 Colombia High Availability Server Market Value & Volume, 2023-2030 ($)
Figure 53 Colombia GDP and Population, 2023-2030 ($)
Figure 54 Colombia GDP – Composition of 2023, By Sector of Origin
Figure 55 Colombia Export and Import Value & Volume, 2023-2030 ($)
Figure 56 Costa Rica High Availability Server MarketCosta Rica 3D Printing Market Value & Volume, 2023-2030 ($)
Figure 57 Costa Rica GDP and Population, 2023-2030 ($)
Figure 58 Costa Rica GDP – Composition of 2023, By Sector of Origin
Figure 59 Costa Rica Export and Import Value & Volume, 2023-2030 ($)
Figure 60 Europe High Availability Server Market Value & Volume, 2023-2030 ($)
Figure 61 U.K High Availability Server Market Value & Volume, 2023-2030 ($)
Figure 62 U.K GDP and Population, 2023-2030 ($)
Figure 63 U.K GDP – Composition of 2023, By Sector of Origin
Figure 64 U.K Export and Import Value & Volume, 2023-2030 ($)
Figure 65 Germany High Availability Server Market Value & Volume, 2023-2030 ($)
Figure 66 Germany GDP and Population, 2023-2030 ($)
Figure 67 Germany GDP – Composition of 2023, By Sector of Origin
Figure 68 Germany Export and Import Value & Volume, 2023-2030 ($)
Figure 69 Italy High Availability Server Market Value & Volume, 2023-2030 ($)
Figure 70 Italy GDP and Population, 2023-2030 ($)
Figure 71 Italy GDP – Composition of 2023, By Sector of Origin
Figure 72 Italy Export and Import Value & Volume, 2023-2030 ($)
Figure 73 France High Availability Server Market Value & Volume, 2023-2030 ($)
Figure 74 France GDP and Population, 2023-2030 ($)
Figure 75 France GDP – Composition of 2023, By Sector of Origin
Figure 76 France Export and Import Value & Volume, 2023-2030 ($)
Figure 77 Netherlands High Availability Server Market Value & Volume, 2023-2030 ($)
Figure 78 Netherlands GDP and Population, 2023-2030 ($)
Figure 79 Netherlands GDP – Composition of 2023, By Sector of Origin
Figure 80 Netherlands Export and Import Value & Volume, 2023-2030 ($)
Figure 81 Belgium High Availability Server Market Value & Volume, 2023-2030 ($)
Figure 82 Belgium GDP and Population, 2023-2030 ($)
Figure 83 Belgium GDP – Composition of 2023, By Sector of Origin
Figure 84 Belgium Export and Import Value & Volume, 2023-2030 ($)
Figure 85 Spain High Availability Server Market Value & Volume, 2023-2030 ($)
Figure 86 Spain GDP and Population, 2023-2030 ($)
Figure 87 Spain GDP – Composition of 2023, By Sector of Origin
Figure 88 Spain Export and Import Value & Volume, 2023-2030 ($)
Figure 89 Denmark High Availability Server Market Value & Volume, 2023-2030 ($)
Figure 90 Denmark GDP and Population, 2023-2030 ($)
Figure 91 Denmark GDP – Composition of 2023, By Sector of Origin
Figure 92 Denmark Export and Import Value & Volume, 2023-2030 ($)
Figure 93 APAC High Availability Server Market Value & Volume, 2023-2030 ($)
Figure 94 China High Availability Server MarketValue & Volume, 2023-2030
Figure 95 China GDP and Population, 2023-2030 ($)
Figure 96 China GDP – Composition of 2023, By Sector of Origin
Figure 97 China Export and Import Value & Volume, 2023-2030 ($)High Availability Server MarketChina Export and Import Value & Volume, 2023-2030 ($)
Figure 98 Australia High Availability Server Market Value & Volume, 2023-2030 ($)
Figure 99 Australia GDP and Population, 2023-2030 ($)
Figure 100 Australia GDP – Composition of 2023, By Sector of Origin
Figure 101 Australia Export and Import Value & Volume, 2023-2030 ($)
Figure 102 South Korea High Availability Server Market Value & Volume, 2023-2030 ($)
Figure 103 South Korea GDP and Population, 2023-2030 ($)
Figure 104 South Korea GDP – Composition of 2023, By Sector of Origin
Figure 105 South Korea Export and Import Value & Volume, 2023-2030 ($)
Figure 106 India High Availability Server Market Value & Volume, 2023-2030 ($)
Figure 107 India GDP and Population, 2023-2030 ($)
Figure 108 India GDP – Composition of 2023, By Sector of Origin
Figure 109 India Export and Import Value & Volume, 2023-2030 ($)
Figure 110 Taiwan High Availability Server MarketTaiwan 3D Printing Market Value & Volume, 2023-2030 ($)
Figure 111 Taiwan GDP and Population, 2023-2030 ($)
Figure 112 Taiwan GDP – Composition of 2023, By Sector of Origin
Figure 113 Taiwan Export and Import Value & Volume, 2023-2030 ($)
Figure 114 Malaysia High Availability Server MarketMalaysia 3D Printing Market Value & Volume, 2023-2030 ($)
Figure 115 Malaysia GDP and Population, 2023-2030 ($)
Figure 116 Malaysia GDP – Composition of 2023, By Sector of Origin
Figure 117 Malaysia Export and Import Value & Volume, 2023-2030 ($)
Figure 118 Hong Kong High Availability Server MarketHong Kong 3D Printing Market Value & Volume, 2023-2030 ($)
Figure 119 Hong Kong GDP and Population, 2023-2030 ($)
Figure 120 Hong Kong GDP – Composition of 2023, By Sector of Origin
Figure 121 Hong Kong Export and Import Value & Volume, 2023-2030 ($)
Figure 122 Middle East & Africa High Availability Server MarketMiddle East & Africa 3D Printing Market Value & Volume, 2023-2030 ($)
Figure 123 Russia High Availability Server MarketRussia 3D Printing Market Value & Volume, 2023-2030 ($)
Figure 124 Russia GDP and Population, 2023-2030 ($)
Figure 125 Russia GDP – Composition of 2023, By Sector of Origin
Figure 126 Russia Export and Import Value & Volume, 2023-2030 ($)
Figure 127 Israel High Availability Server Market Value & Volume, 2023-2030 ($)
Figure 128 Israel GDP and Population, 2023-2030 ($)
Figure 129 Israel GDP – Composition of 2023, By Sector of Origin
Figure 130 Israel Export and Import Value & Volume, 2023-2030 ($)
Figure 131 Entropy Share, By Strategies, 2023-2030* (%)High Availability Server Market
Figure 132 Developments, 2023-2030*High Availability Server Market
Figure 133 Company 1 High Availability Server Market Net Revenue, By Years, 2023-2030* ($)
Figure 134 Company 1 High Availability Server Market Net Revenue Share, By Business segments, 2023 (%)
Figure 135 Company 1 High Availability Server Market Net Sales Share, By Geography, 2023 (%)
Figure 136 Company 2 High Availability Server Market Net Revenue, By Years, 2023-2030* ($)
Figure 137 Company 2 High Availability Server Market Net Revenue Share, By Business segments, 2023 (%)
Figure 138 Company 2 High Availability Server Market Net Sales Share, By Geography, 2023 (%)
Figure 139 Company 3High Availability Server Market Net Revenue, By Years, 2023-2030* ($)
Figure 140 Company 3High Availability Server Market Net Revenue Share, By Business segments, 2023 (%)
Figure 141 Company 3High Availability Server Market Net Sales Share, By Geography, 2023 (%)
Figure 142 Company 4 High Availability Server Market Net Revenue, By Years, 2023-2030* ($)
Figure 143 Company 4 High Availability Server Market Net Revenue Share, By Business segments, 2023 (%)
Figure 144 Company 4 High Availability Server Market Net Sales Share, By Geography, 2023 (%)
Figure 145 Company 5 High Availability Server Market Net Revenue, By Years, 2023-2030* ($)
Figure 146 Company 5 High Availability Server Market Net Revenue Share, By Business segments, 2023 (%)
Figure 147 Company 5 High Availability Server Market Net Sales Share, By Geography, 2023 (%)
Figure 148 Company 6 High Availability Server Market Net Revenue, By Years, 2023-2030* ($)
Figure 149 Company 6 High Availability Server Market Net Revenue Share, By Business segments, 2023 (%)
Figure 150 Company 6 High Availability Server Market Net Sales Share, By Geography, 2023 (%)
Figure 151 Company 7 High Availability Server Market Net Revenue, By Years, 2023-2030* ($)
Figure 152 Company 7 High Availability Server Market Net Revenue Share, By Business segments, 2023 (%)
Figure 153 Company 7 High Availability Server Market Net Sales Share, By Geography, 2023 (%)
Figure 154 Company 8 High Availability Server Market Net Revenue, By Years, 2023-2030* ($)
Figure 155 Company 8 High Availability Server Market Net Revenue Share, By Business segments, 2023 (%)
Figure 156 Company 8 High Availability Server Market Net Sales Share, By Geography, 2023 (%)
Figure 157 Company 9 High Availability Server Market Net Revenue, By Years, 2023-2030* ($)
Figure 158 Company 9 High Availability Server Market Net Revenue Share, By Business segments, 2023 (%)
Figure 159 Company 9 High Availability Server Market Net Sales Share, By Geography, 2023 (%)
Figure 160 Company 10 High Availability Server Market Net Revenue, By Years, 2023-2030* ($)
Figure 161 Company 10 High Availability Server Market Net Revenue Share, By Business segments, 2023 (%)
Figure 162 Company 10 High Availability Server Market Net Sales Share, By Geography, 2023 (%)
Figure 163 Company 11 High Availability Server Market Net Revenue, By Years, 2023-2030* ($)
Figure 164 Company 11 High Availability Server Market Net Revenue Share, By Business segments, 2023 (%)
Figure 165 Company 11 High Availability Server Market Net Sales Share, By Geography, 2023 (%)
Figure 166 Company 12 High Availability Server Market Net Revenue, By Years, 2023-2030* ($)
Figure 167 Company 12 High Availability Server Market Net Revenue Share, By Business segments, 2023 (%)
Figure 168 Company 12 High Availability Server Market Net Sales Share, By Geography, 2023 (%)
Figure 169 Company 13High Availability Server Market Net Revenue, By Years, 2023-2030* ($)
Figure 170 Company 13High Availability Server Market Net Revenue Share, By Business segments, 2023 (%)
Figure 171 Company 13High Availability Server Market Net Sales Share, By Geography, 2023 (%)
Figure 172 Company 14 High Availability Server Market Net Revenue, By Years, 2023-2030* ($)
Figure 173 Company 14 High Availability Server Market Net Revenue Share, By Business segments, 2023 (%)
Figure 174 Company 14 High Availability Server Market Net Sales Share, By Geography, 2023 (%)
Figure 175 Company 15 High Availability Server Market Net Revenue, By Years, 2023-2030* ($)
Figure 176 Company 15 High Availability Server Market Net Revenue Share, By Business segments, 2023 (%)
Figure 177 Company 15 High Availability Server Market Net Sales Share, By Geography, 2023 (%)