 Email
Email Print
Print


Home Energy Management System Market - Forecast(2024 - 2030)
Home Energy Management System Market Overview
The Home Energy Management System Market size
is analyzed to grow at an estimated CAGR of 15.99% during the forecast period 2022-2027 to reach
$6.8 billion by 2027. Home energy management systems are a comprehensive combination of
hardware and software that enable consumers to track and manage the energy
usage of the different electrical appliances they have in their residences. The
home energy management system consists of five distinct products that help in
managing and lowering energy consumption. Self-monitoring systems, lighting
controls, programmable communicating thermostats, advanced central controllers and intelligent HVAC controllers are some of these devices. With a home
energy management system, end-users can monitor and control energy consumption
in the home by using mobile phones, tablets and other communication tools to
get real-time data on energy consumption. In order to help users use less
energy during peak hours, the home energy management system also offers
notifications on changing electricity prices. Currently, the skyrocketing cost
of energy has increased the demand for energy management. The global Home Energy Management System market is expanding as a result of rising investments
in smart grids and increased awareness of energy management.
Report Coverage
The “Home Energy Management System Market Report – Forecast (2022-2027)” by IndustryARC, covers an in-depth analysis
of the following segments in the Home Energy Management System industry.
Key Takeaways
- The Hardware segment is expected to grow at the fastest CAGR of 8.4% during the forecast period. There is a wide range of hardware for energy monitoring that includes applications for communication, sensing and machine learning algorithms.
- The ZigBee segment is expected to grow at the fastest CAGR of 6.4% during the forecast period. The market for ZigBee-powered Home Energy Management Systems is expected to grow since these modules are frequently used to track how much energy is utilized by lighting and appliances in homes.
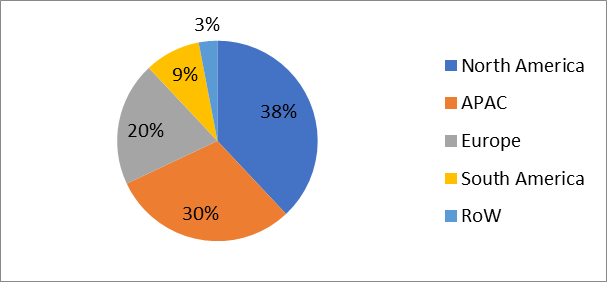
- In 2021, North America accounted for the largest market share (38%) in the Home Energy Management System market. The widespread usage of Home Energy Management Systems and increased public knowledge of this technology are projected to increase demand for it in North America.
- The rising awareness about the sustainable use of energy resources is predicted to be the main driver of the global market for Home Energy Management Systems.
Home Energy Management System Market Share by Region, 2021
For More Details On this report - Request For Sample
Home Energy Management System Market Segment Analysis – By Component
By Component,
Home Energy Management
System Market has been segmented into
Hardware, Software and Services. The Hardware segment is expected to grow at
the fastest CAGR of 8.4% during the forecast period. There is a wide range of hardware
for energy monitoring that includes applications for communication, sensing and machine learning algorithms. In-home displays, meters, thermostats, load
control switches, sensors and smart plugs are some of the hardware elements of
energy management systems. Some of the auxiliary equipment is included in the
hardware of the Home Energy
Management System. The need for energy management systems is being further fueled by a
rise in the development of digital technologies, particularly in North American
residential sectors. The development of smart home technologies in the United
States was aided by initiatives like the installation of smart meters in
California, Florida and Texas. This would help to boost the market growth.
Home Energy Management System Market Segment Analysis – by Communication Technology
By Communication Technology, Home Energy Management System Market
has been segmented into Z-wave,
ZigBee, Wi-Fi, Homeplug and Others. The ZigBee segment is expected to grow at the fastest CAGR of 6.4% during the
forecast period. The market for ZigBee-powered home
energy management systems is expected to grow since these modules are
frequently used to track how much energy is utilized by lighting and appliances
in homes. ZigBee is a cheap, wireless and low-power mesh networking standard.
The technology's cost efficiency makes it widely applicable in wireless control and
monitoring applications, and its low power consumption extends battery life
with smaller batteries. Solar panels and wind turbines are utilized in home
energy management systems to conserve energy for internal usage, specifically,
to record electrical readings such as energy usage from domestic appliances.
Both a transmitter and a receiver are used with Zigbee. With over 560 certified
products launched in 2020 (up by 31% from 2019) and millions of Zigbee-based smart
devices in customers' hands, it (2020) was a record-breaking year for Zigbee. Zigbee
continues to be one of the most widely used Internet of Things (IoT) standards
in the world, supported by major companies in the industry through the Zigbee
Alliance. It is used by millions of devices and consumers.
Home Energy Management System Market Share Segment Analysis - by Geography
By Geography, Home Energy Management System Market has been segmented into North America, Europe, APAC, South America and the RoW. In 2021, North America accounted for the largest market share (38%) in the Home Energy Management System market. The widespread usage of home energy management systems and increased public knowledge of this technology are projected to increase demand for it in North America. The region's demand for residential energy management systems is anticipated to be driven by a rise in the adoption of smart meters and the implementation of systems to monitor and control electricity consumption. Higher efficiency goals are the focus of regional government strategies aimed at lowering energy use. Thus, it becomes relatively important to increase energy efficiency through the use of home energy management systems, which, in turn, fuels the expansion of the regional market. Commercial building owners and managers have made "reducing energy use" a top priority in order to save money. Nearly 40% of the energy used in the US goes toward powering commercial and residential structures, according to the US Energy Information Administration. Real-time energy management systems and smart technologies can cut expenses by an average of 15%, according to the New York State Energy Research and Development Authority (NYSERDA). As a component of smart solutions in both commercial and residential buildings, such innovations have been driving the demand for Home Energy Management systems further.
Home Energy Management System Market
Increased Use of Home Energy Management System Technology Makes Available Resources More Sustainable:
The rising
awareness of the sustainable use of energy resources is predicted to be the
main driver of the global market for Home Energy Management Systems. Customers'
purchase behavior, which is currently favoring energy-efficient electronic
appliances, demonstrates such understanding. Customers are embracing home
energy management systems in addition to buying energy-saving equipment.
Customers are becoming more and more aware that energy management systems not
only lower costs and save energy but also contribute to the development of more
sustainable energy sources. Applications
for device monitoring and control are expanding the potential for the Home Energy Management systems market. These systems must be able to manage and keep an eye on a variety of
household electronics and appliances. The user can access device information
via a web interface or a tablet/phone application. Home Energy Management systems provide seamless
communication between various smart devices and sensors through ZigBee, Wi-Fi,
Z-Wave and more in order to effectively monitor and operate the equipment. In
December 2021, within the Residential and Power Products Business, Kohler Co.
launched the Home Energy Management Systems Division.
Growth of Urbanization and Digitalization:
Significant environmental, economic and social
sustainability concerns are imposed by the predicted urbanization of the world.
As a result, urban behaviors and processes are evolving to be very sensitive to
a data-driven urban environment, which is the primary mode of production for
smart cities. In view of the growing urbanization tendency, such a trend is
increasingly being used to address sustainability issues. By putting in energy
management systems to help track energy use, significant energy savings can
be achieved. Additionally, it would make it easier to foresee the kind of
energy-saving method that would be used in such circumstances. This indicates
that due to the problems brought on by urban expansion, city governments in
technologically advanced nations would confront substantial hurdles. Smart
meters, sensors and thermostats are just a few examples of linked, intelligent
equipment that has seen a considerable uptick in development in recent years.
With the surge in the development of power monitoring and display technologies,
these gadgets are advancing. Additionally, the typical net energy savings per
system installation are 23% for lighting and 36 % for space heating, water
heating and cooling/ventilation. Government support and promotion of increased
adoption of smart devices are further fueling the market's growth. For instance, the Government of India planned to
create 500 smart cities in a phased manner, with smart homes being the most
critical entity of smart cities.
Home Energy
Management System Market
High Installation Cost May Limit the Market Growth
There are significant upfront costs associated with installing an entirely automated and cutting-edge Home Energy Management System in buildings. Everyone seeks to reduce the cost of their consumption. They, therefore, need energy management systems to keep track of how much energy is used by various devices. Even though the use of energy-efficient solutions and practices result in significant long-term costs and energy savings, it necessitates a hefty initial investment. In most cases, the hardware parts of energy management systems are substantially more expensive than the software and service parts. Home Energy management systems typically cost at least $2.50 per square foot and up to $7.00 per square foot when employing conventional applications and methodologies. That works out to about $250,000 for a structure with an area of 100,000 square feet.
Home Energy Management System Market Outlook
Technology launches, acquisitions, Partnerships and R&D activities are key strategies players adopt in the Home Energy Management System market. The top 10 companies in the Home Energy Management System market are:
- GENERAL
ELECTRIC COMPANY
- Honeywell
International Inc.
- Alphabet, Inc.
(Google, Inc.)
- Vivint Inc.
- Comcast Cable
Communications, LLC (Xfinity)
- EcoFactor,
Inc.
- Energyhub,
Inc.
- Ecobee, Inc.
- Panasonic
Corporation
- SCHNEIDER ELECTRIC SE
Recent Developments
- In April 2022, Samsung Electronics announced a partnership with ABB to integrate Samsung SmartThings into more homes and buildings.
- In August 2021, Open Systems International, Inc. (OSI Inc.) was acquired by Emerson for USD 1.6 billion in an all-cash deal. Leading operations technology software supplier OSI Inc. expanded and complemented Emerson's extensive software offering while enhancing dependability and energy efficiency.
- In June 2021, In order to provide end-to-end lifecycle digitalization, improved efficiency, sustainability, and robustness to a wider audience and client base, ETAP, an electrical power system analysis and operation software, announced partnering with Schneider Electric.
Relevant Report Titles:
Energy Management System Market
Report Code: ITR 29798
Industrial
Energy Management System Market
Report Code: ITR
18803
Power Management System
Market
Report Code: EPR
33949
For more Electronics Market reports, please click here
Table 1 Home Energy Management System Market Overview 2023-2030
Table 2 Home Energy Management System Market Leader Analysis 2023-2030 (US$)
Table 3 Home Energy Management System MarketProduct Analysis 2023-2030 (US$)
Table 4 Home Energy Management System MarketEnd User Analysis 2023-2030 (US$)
Table 5 Home Energy Management System MarketPatent Analysis 2013-2023* (US$)
Table 6 Home Energy Management System MarketFinancial Analysis 2023-2030 (US$)
Table 7 Home Energy Management System Market Driver Analysis 2023-2030 (US$)
Table 8 Home Energy Management System MarketChallenges Analysis 2023-2030 (US$)
Table 9 Home Energy Management System MarketConstraint Analysis 2023-2030 (US$)
Table 10 Home Energy Management System Market Supplier Bargaining Power Analysis 2023-2030 (US$)
Table 11 Home Energy Management System Market Buyer Bargaining Power Analysis 2023-2030 (US$)
Table 12 Home Energy Management System Market Threat of Substitutes Analysis 2023-2030 (US$)
Table 13 Home Energy Management System Market Threat of New Entrants Analysis 2023-2030 (US$)
Table 14 Home Energy Management System Market Degree of Competition Analysis 2023-2030 (US$)
Table 15 Home Energy Management System MarketValue Chain Analysis 2023-2030 (US$)
Table 16 Home Energy Management System MarketPricing Analysis 2023-2030 (US$)
Table 17 Home Energy Management System MarketOpportunities Analysis 2023-2030 (US$)
Table 18 Home Energy Management System MarketProduct Life Cycle Analysis 2023-2030 (US$)
Table 19 Home Energy Management System MarketSupplier Analysis 2023-2030 (US$)
Table 20 Home Energy Management System MarketDistributor Analysis 2023-2030 (US$)
Table 21 Home Energy Management System Market Trend Analysis 2023-2030 (US$)
Table 22 Home Energy Management System Market Size 2023 (US$)
Table 23 Home Energy Management System Market Forecast Analysis 2023-2030 (US$)
Table 24 Home Energy Management System Market Sales Forecast Analysis 2023-2030 (Units)
Table 25 Home Energy Management System Market, Revenue & Volume,By Device Type, 2023-2030 ($)
Table 26 Home Energy Management System MarketBy Device Type, Revenue & Volume,By Control Device, 2023-2030 ($)
Table 27 Home Energy Management System MarketBy Device Type, Revenue & Volume,By Display Device, 2023-2030 ($)
Table 28 Home Energy Management System MarketBy Device Type, Revenue & Volume,By Communication Device, 2023-2030 ($)
Table 29 Home Energy Management System Market, Revenue & Volume,By Technology, 2023-2030 ($)
Table 30 Home Energy Management System MarketBy Technology, Revenue & Volume,By Wi-Fi, 2023-2030 ($)
Table 31 Home Energy Management System MarketBy Technology, Revenue & Volume,By Z-Wave, 2023-2030 ($)
Table 32 Home Energy Management System MarketBy Technology, Revenue & Volume,By ZigBee, 2023-2030 ($)
Table 33 Home Energy Management System MarketBy Technology, Revenue & Volume,By Ethernet, 2023-2030 ($)
Table 34 Home Energy Management System MarketBy Technology, Revenue & Volume,By Others, 2023-2030 ($)
Table 35 North America Home Energy Management System Market, Revenue & Volume,By Device Type, 2023-2030 ($)
Table 36 North America Home Energy Management System Market, Revenue & Volume,By Technology, 2023-2030 ($)
Table 37 South america Home Energy Management System Market, Revenue & Volume,By Device Type, 2023-2030 ($)
Table 38 South america Home Energy Management System Market, Revenue & Volume,By Technology, 2023-2030 ($)
Table 39 Europe Home Energy Management System Market, Revenue & Volume,By Device Type, 2023-2030 ($)
Table 40 Europe Home Energy Management System Market, Revenue & Volume,By Technology, 2023-2030 ($)
Table 41 APAC Home Energy Management System Market, Revenue & Volume,By Device Type, 2023-2030 ($)
Table 42 APAC Home Energy Management System Market, Revenue & Volume,By Technology, 2023-2030 ($)
Table 43 Middle East & Africa Home Energy Management System Market, Revenue & Volume,By Device Type, 2023-2030 ($)
Table 44 Middle East & Africa Home Energy Management System Market, Revenue & Volume,By Technology, 2023-2030 ($)
Table 45 Russia Home Energy Management System Market, Revenue & Volume,By Device Type, 2023-2030 ($)
Table 46 Russia Home Energy Management System Market, Revenue & Volume,By Technology, 2023-2030 ($)
Table 47 Israel Home Energy Management System Market, Revenue & Volume,By Device Type, 2023-2030 ($)
Table 48 Israel Home Energy Management System Market, Revenue & Volume,By Technology, 2023-2030 ($)
Table 49 Top Companies 2023 (US$)Home Energy Management System Market, Revenue & Volume,,
Table 50 Product Launch 2023-2030Home Energy Management System Market, Revenue & Volume,,
Table 51 Mergers & Acquistions 2023-2030Home Energy Management System Market, Revenue & Volume,,
List of Figures
Figure 1 Overview of Home Energy Management System Market 2023-2030
Figure 2 Market Share Analysis for Home Energy Management System Market 2023 (US$)
Figure 3 Product Comparison in Home Energy Management System Market 2023-2030 (US$)
Figure 4 End User Profile for Home Energy Management System Market 2023-2030 (US$)
Figure 5 Patent Application and Grant in Home Energy Management System Market 2013-2023* (US$)
Figure 6 Top 5 Companies Financial Analysis in Home Energy Management System Market 2023-2030 (US$)
Figure 7 Market Entry Strategy in Home Energy Management System Market 2023-2030
Figure 8 Ecosystem Analysis in Home Energy Management System Market2023
Figure 9 Average Selling Price in Home Energy Management System Market 2023-2030
Figure 10 Top Opportunites in Home Energy Management System Market 2023-2030
Figure 11 Market Life Cycle Analysis in Home Energy Management System Market
Figure 12 GlobalBy Device TypeHome Energy Management System Market Revenue, 2023-2030 ($)
Figure 13 GlobalBy TechnologyHome Energy Management System Market Revenue, 2023-2030 ($)
Figure 14 Global Home Energy Management System Market - By Geography
Figure 15 Global Home Energy Management System Market Value & Volume, By Geography, 2023-2030 ($)
Figure 16 Global Home Energy Management System Market CAGR, By Geography, 2023-2030 (%)
Figure 17 North America Home Energy Management System Market Value & Volume, 2023-2030 ($)
Figure 18 US Home Energy Management System Market Value & Volume, 2023-2030 ($)
Figure 19 US GDP and Population, 2023-2030 ($)
Figure 20 US GDP – Composition of 2023, By Sector of Origin
Figure 21 US Export and Import Value & Volume, 2023-2030 ($)
Figure 22 Canada Home Energy Management System Market Value & Volume, 2023-2030 ($)
Figure 23 Canada GDP and Population, 2023-2030 ($)
Figure 24 Canada GDP – Composition of 2023, By Sector of Origin
Figure 25 Canada Export and Import Value & Volume, 2023-2030 ($)
Figure 26 Mexico Home Energy Management System Market Value & Volume, 2023-2030 ($)
Figure 27 Mexico GDP and Population, 2023-2030 ($)
Figure 28 Mexico GDP – Composition of 2023, By Sector of Origin
Figure 29 Mexico Export and Import Value & Volume, 2023-2030 ($)
Figure 30 South America Home Energy Management System MarketSouth America 3D Printing Market Value & Volume, 2023-2030 ($)
Figure 31 Brazil Home Energy Management System Market Value & Volume, 2023-2030 ($)
Figure 32 Brazil GDP and Population, 2023-2030 ($)
Figure 33 Brazil GDP – Composition of 2023, By Sector of Origin
Figure 34 Brazil Export and Import Value & Volume, 2023-2030 ($)
Figure 35 Venezuela Home Energy Management System Market Value & Volume, 2023-2030 ($)
Figure 36 Venezuela GDP and Population, 2023-2030 ($)
Figure 37 Venezuela GDP – Composition of 2023, By Sector of Origin
Figure 38 Venezuela Export and Import Value & Volume, 2023-2030 ($)
Figure 39 Argentina Home Energy Management System Market Value & Volume, 2023-2030 ($)
Figure 40 Argentina GDP and Population, 2023-2030 ($)
Figure 41 Argentina GDP – Composition of 2023, By Sector of Origin
Figure 42 Argentina Export and Import Value & Volume, 2023-2030 ($)
Figure 43 Ecuador Home Energy Management System Market Value & Volume, 2023-2030 ($)
Figure 44 Ecuador GDP and Population, 2023-2030 ($)
Figure 45 Ecuador GDP – Composition of 2023, By Sector of Origin
Figure 46 Ecuador Export and Import Value & Volume, 2023-2030 ($)
Figure 47 Peru Home Energy Management System Market Value & Volume, 2023-2030 ($)
Figure 48 Peru GDP and Population, 2023-2030 ($)
Figure 49 Peru GDP – Composition of 2023, By Sector of Origin
Figure 50 Peru Export and Import Value & Volume, 2023-2030 ($)
Figure 51 Colombia Home Energy Management System Market Value & Volume, 2023-2030 ($)
Figure 52 Colombia GDP and Population, 2023-2030 ($)
Figure 53 Colombia GDP – Composition of 2023, By Sector of Origin
Figure 54 Colombia Export and Import Value & Volume, 2023-2030 ($)
Figure 55 Costa Rica Home Energy Management System MarketCosta Rica 3D Printing Market Value & Volume, 2023-2030 ($)
Figure 56 Costa Rica GDP and Population, 2023-2030 ($)
Figure 57 Costa Rica GDP – Composition of 2023, By Sector of Origin
Figure 58 Costa Rica Export and Import Value & Volume, 2023-2030 ($)
Figure 59 Europe Home Energy Management System Market Value & Volume, 2023-2030 ($)
Figure 60 U.K Home Energy Management System Market Value & Volume, 2023-2030 ($)
Figure 61 U.K GDP and Population, 2023-2030 ($)
Figure 62 U.K GDP – Composition of 2023, By Sector of Origin
Figure 63 U.K Export and Import Value & Volume, 2023-2030 ($)
Figure 64 Germany Home Energy Management System Market Value & Volume, 2023-2030 ($)
Figure 65 Germany GDP and Population, 2023-2030 ($)
Figure 66 Germany GDP – Composition of 2023, By Sector of Origin
Figure 67 Germany Export and Import Value & Volume, 2023-2030 ($)
Figure 68 Italy Home Energy Management System Market Value & Volume, 2023-2030 ($)
Figure 69 Italy GDP and Population, 2023-2030 ($)
Figure 70 Italy GDP – Composition of 2023, By Sector of Origin
Figure 71 Italy Export and Import Value & Volume, 2023-2030 ($)
Figure 72 France Home Energy Management System Market Value & Volume, 2023-2030 ($)
Figure 73 France GDP and Population, 2023-2030 ($)
Figure 74 France GDP – Composition of 2023, By Sector of Origin
Figure 75 France Export and Import Value & Volume, 2023-2030 ($)
Figure 76 Netherlands Home Energy Management System Market Value & Volume, 2023-2030 ($)
Figure 77 Netherlands GDP and Population, 2023-2030 ($)
Figure 78 Netherlands GDP – Composition of 2023, By Sector of Origin
Figure 79 Netherlands Export and Import Value & Volume, 2023-2030 ($)
Figure 80 Belgium Home Energy Management System Market Value & Volume, 2023-2030 ($)
Figure 81 Belgium GDP and Population, 2023-2030 ($)
Figure 82 Belgium GDP – Composition of 2023, By Sector of Origin
Figure 83 Belgium Export and Import Value & Volume, 2023-2030 ($)
Figure 84 Spain Home Energy Management System Market Value & Volume, 2023-2030 ($)
Figure 85 Spain GDP and Population, 2023-2030 ($)
Figure 86 Spain GDP – Composition of 2023, By Sector of Origin
Figure 87 Spain Export and Import Value & Volume, 2023-2030 ($)
Figure 88 Denmark Home Energy Management System Market Value & Volume, 2023-2030 ($)
Figure 89 Denmark GDP and Population, 2023-2030 ($)
Figure 90 Denmark GDP – Composition of 2023, By Sector of Origin
Figure 91 Denmark Export and Import Value & Volume, 2023-2030 ($)
Figure 92 APAC Home Energy Management System Market Value & Volume, 2023-2030 ($)
Figure 93 China Home Energy Management System MarketValue & Volume, 2023-2030
Figure 94 China GDP and Population, 2023-2030 ($)
Figure 95 China GDP – Composition of 2023, By Sector of Origin
Figure 96 China Export and Import Value & Volume, 2023-2030 ($)Home Energy Management System MarketChina Export and Import Value & Volume, 2023-2030 ($)
Figure 97 Australia Home Energy Management System Market Value & Volume, 2023-2030 ($)
Figure 98 Australia GDP and Population, 2023-2030 ($)
Figure 99 Australia GDP – Composition of 2023, By Sector of Origin
Figure 100 Australia Export and Import Value & Volume, 2023-2030 ($)
Figure 101 South Korea Home Energy Management System Market Value & Volume, 2023-2030 ($)
Figure 102 South Korea GDP and Population, 2023-2030 ($)
Figure 103 South Korea GDP – Composition of 2023, By Sector of Origin
Figure 104 South Korea Export and Import Value & Volume, 2023-2030 ($)
Figure 105 India Home Energy Management System Market Value & Volume, 2023-2030 ($)
Figure 106 India GDP and Population, 2023-2030 ($)
Figure 107 India GDP – Composition of 2023, By Sector of Origin
Figure 108 India Export and Import Value & Volume, 2023-2030 ($)
Figure 109 Taiwan Home Energy Management System MarketTaiwan 3D Printing Market Value & Volume, 2023-2030 ($)
Figure 110 Taiwan GDP and Population, 2023-2030 ($)
Figure 111 Taiwan GDP – Composition of 2023, By Sector of Origin
Figure 112 Taiwan Export and Import Value & Volume, 2023-2030 ($)
Figure 113 Malaysia Home Energy Management System MarketMalaysia 3D Printing Market Value & Volume, 2023-2030 ($)
Figure 114 Malaysia GDP and Population, 2023-2030 ($)
Figure 115 Malaysia GDP – Composition of 2023, By Sector of Origin
Figure 116 Malaysia Export and Import Value & Volume, 2023-2030 ($)
Figure 117 Hong Kong Home Energy Management System MarketHong Kong 3D Printing Market Value & Volume, 2023-2030 ($)
Figure 118 Hong Kong GDP and Population, 2023-2030 ($)
Figure 119 Hong Kong GDP – Composition of 2023, By Sector of Origin
Figure 120 Hong Kong Export and Import Value & Volume, 2023-2030 ($)
Figure 121 Middle East & Africa Home Energy Management System MarketMiddle East & Africa 3D Printing Market Value & Volume, 2023-2030 ($)
Figure 122 Russia Home Energy Management System MarketRussia 3D Printing Market Value & Volume, 2023-2030 ($)
Figure 123 Russia GDP and Population, 2023-2030 ($)
Figure 124 Russia GDP – Composition of 2023, By Sector of Origin
Figure 125 Russia Export and Import Value & Volume, 2023-2030 ($)
Figure 126 Israel Home Energy Management System Market Value & Volume, 2023-2030 ($)
Figure 127 Israel GDP and Population, 2023-2030 ($)
Figure 128 Israel GDP – Composition of 2023, By Sector of Origin
Figure 129 Israel Export and Import Value & Volume, 2023-2030 ($)
Figure 130 Entropy Share, By Strategies, 2023-2030* (%)Home Energy Management System Market
Figure 131 Developments, 2023-2030*Home Energy Management System Market
Figure 132 Company 1 Home Energy Management System Market Net Revenue, By Years, 2023-2030* ($)
Figure 133 Company 1 Home Energy Management System Market Net Revenue Share, By Business segments, 2023 (%)
Figure 134 Company 1 Home Energy Management System Market Net Sales Share, By Geography, 2023 (%)
Figure 135 Company 2 Home Energy Management System Market Net Revenue, By Years, 2023-2030* ($)
Figure 136 Company 2 Home Energy Management System Market Net Revenue Share, By Business segments, 2023 (%)
Figure 137 Company 2 Home Energy Management System Market Net Sales Share, By Geography, 2023 (%)
Figure 138 Company 3Home Energy Management System Market Net Revenue, By Years, 2023-2030* ($)
Figure 139 Company 3Home Energy Management System Market Net Revenue Share, By Business segments, 2023 (%)
Figure 140 Company 3Home Energy Management System Market Net Sales Share, By Geography, 2023 (%)
Figure 141 Company 4 Home Energy Management System Market Net Revenue, By Years, 2023-2030* ($)
Figure 142 Company 4 Home Energy Management System Market Net Revenue Share, By Business segments, 2023 (%)
Figure 143 Company 4 Home Energy Management System Market Net Sales Share, By Geography, 2023 (%)
Figure 144 Company 5 Home Energy Management System Market Net Revenue, By Years, 2023-2030* ($)
Figure 145 Company 5 Home Energy Management System Market Net Revenue Share, By Business segments, 2023 (%)
Figure 146 Company 5 Home Energy Management System Market Net Sales Share, By Geography, 2023 (%)
Figure 147 Company 6 Home Energy Management System Market Net Revenue, By Years, 2023-2030* ($)
Figure 148 Company 6 Home Energy Management System Market Net Revenue Share, By Business segments, 2023 (%)
Figure 149 Company 6 Home Energy Management System Market Net Sales Share, By Geography, 2023 (%)
Figure 150 Company 7 Home Energy Management System Market Net Revenue, By Years, 2023-2030* ($)
Figure 151 Company 7 Home Energy Management System Market Net Revenue Share, By Business segments, 2023 (%)
Figure 152 Company 7 Home Energy Management System Market Net Sales Share, By Geography, 2023 (%)
Figure 153 Company 8 Home Energy Management System Market Net Revenue, By Years, 2023-2030* ($)
Figure 154 Company 8 Home Energy Management System Market Net Revenue Share, By Business segments, 2023 (%)
Figure 155 Company 8 Home Energy Management System Market Net Sales Share, By Geography, 2023 (%)
Figure 156 Company 9 Home Energy Management System Market Net Revenue, By Years, 2023-2030* ($)
Figure 157 Company 9 Home Energy Management System Market Net Revenue Share, By Business segments, 2023 (%)
Figure 158 Company 9 Home Energy Management System Market Net Sales Share, By Geography, 2023 (%)
Figure 159 Company 10 Home Energy Management System Market Net Revenue, By Years, 2023-2030* ($)
Figure 160 Company 10 Home Energy Management System Market Net Revenue Share, By Business segments, 2023 (%)
Figure 161 Company 10 Home Energy Management System Market Net Sales Share, By Geography, 2023 (%)
Figure 162 Company 11 Home Energy Management System Market Net Revenue, By Years, 2023-2030* ($)
Figure 163 Company 11 Home Energy Management System Market Net Revenue Share, By Business segments, 2023 (%)
Figure 164 Company 11 Home Energy Management System Market Net Sales Share, By Geography, 2023 (%)
Figure 165 Company 12 Home Energy Management System Market Net Revenue, By Years, 2023-2030* ($)
Figure 166 Company 12 Home Energy Management System Market Net Revenue Share, By Business segments, 2023 (%)
Figure 167 Company 12 Home Energy Management System Market Net Sales Share, By Geography, 2023 (%)
Figure 168 Company 13Home Energy Management System Market Net Revenue, By Years, 2023-2030* ($)
Figure 169 Company 13Home Energy Management System Market Net Revenue Share, By Business segments, 2023 (%)
Figure 170 Company 13Home Energy Management System Market Net Sales Share, By Geography, 2023 (%)
Figure 171 Company 14 Home Energy Management System Market Net Revenue, By Years, 2023-2030* ($)
Figure 172 Company 14 Home Energy Management System Market Net Revenue Share, By Business segments, 2023 (%)
Figure 173 Company 14 Home Energy Management System Market Net Sales Share, By Geography, 2023 (%)
Figure 174 Company 15 Home Energy Management System Market Net Revenue, By Years, 2023-2030* ($)
Figure 175 Company 15 Home Energy Management System Market Net Revenue Share, By Business segments, 2023 (%)
Figure 176 Company 15 Home Energy Management System Market Net Sales Share, By Geography, 2023 (%)