 Email
Email Print
Print


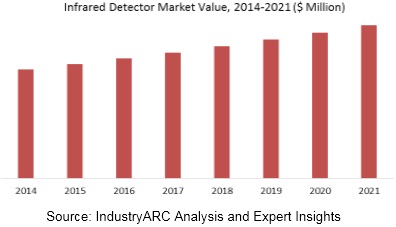
An infrared detector is a detector that reacts to infrared radiation (IR) using cooled and uncooled technology which can be used for various security warning systems. Globally infrared device market is expected to witness a significant growth driven by increasing applications in people and motion sensor at various retail and departmental shops and public places such as airports, and railway stations, and commercial areas. The IR detector market is segmented in type, where thermal detector and photo detectors are the two primary types increasingly used.
This report identifies the global infrared detector market size for the year 2015-2018, and forecast of the same for year 2023. It also highlights the market potential growth, market drivers, restraints, market current and future trends, growth indicators, challenges, opportunities with impact analysis, market dynamics, competitive landscape, and other key aspects with respect to infrared detector market in the coming years.
Global Infrared detector market, Asia-Pacific held the largest market share in 2017, followed by North America second largest important regional markets for infrared detectors in 2017. Asia-Pacific is witnessed to continue in attaining leading shares during the forecast period of study due to increasing applications of IR detectors in temperature measurement, military and defence, and industrial applications.
This report segments global infrared detector market on the basis of type, technology and application as follows:
- On the basis of types of infrared detectors this report on global infrared detector market is segmented as: Indium Gallium Arsenide (Ingaas), Pyroelectric using crystal, ceramic, thin film or CMOS, Thermopiles, Microbolometers, thermal detector, photo detector and Others
- This report also segments global infrared detector market on the basis of technology, which included major segments as: Cooled IR Detector Technology and Uncooled IR Detector Technology
- On the basis of applications of infrared detectors this market research report on global infrared detector market is segmented as: People & Motion Detection System, Temperature Measurement System (Low-end temperature measurement systems, High-end temperature measurement systems), Gas & Fire Detection System, Smart Buildings IR Systems, Spectroscopy & Bio Medical Imaging and Others.
- This report has been further segmented into major regions, which includes detailed analysis of each region such as: North America, Europe, Asia-Pacific (APAC), and Rest of the World (RoW) covering all the major country level markets for infrared detectors in each of the region.
Sample companies profiled in this report are:
- Honeywell International Inc.
- Nippon Ceramic Co., Ltd.
- Texas Instruments Inc.
- FLIR Systems Inc.
- Excelitas Technologies Corp.
- 10+.
1. Infrared Detector Market - Overview
1.1. Definitions and Scope
2. Infrared Detector Market - Executive summary
2.1. Market Revenue, Market Size and Key Trends by Company
2.2. Key Trends by type of Application
2.3. Key Trends segmented by Geography
3. Infrared Detector Market
3.1. Comparative analysis
3.1.1. Product Benchmarking - Top 10 companies
3.1.2. Top 5 Financials Analysis
3.1.3. Market Value split by Top 10 companies
3.1.4. Patent Analysis - Top 10 companies
3.1.5. Pricing Analysis
4. Infrared Detector Market – Startup companies Scenario Premium
4.1. Top 10 startup company Analysis by
4.1.1. Investment
4.1.2. Revenue
4.1.3. Market Shares
4.1.4. Market Size and Application Analysis
4.1.5. Venture Capital and Funding Scenario
5. Infrared Detector Market – Industry Market Entry Scenario Premium
5.1. Regulatory Framework Overview
5.2. New Business and Ease of Doing business index
5.3. Case studies of successful ventures
5.4. Customer Analysis – Top 10 companies
6. Infrared Detector Market Forces
6.1. Drivers
6.2. Constraints
6.3. Challenges
6.4. Porters five force model
6.4.1. Bargaining power of suppliers
6.4.2. Bargaining powers of customers
6.4.3. Threat of new entrants
6.4.4. Rivalry among existing players
6.4.5. Threat of substitutes
7. Infrared Detector Market -Strategic analysis
7.1. Value chain analysis
7.2. Opportunities analysis
7.3. Product life cycle
7.4. Suppliers and distributors Market Share
8. Infrared Detector Market – By Type (Market Size -$Million / $Billion)
8.1. Market Size and Market Share Analysis
8.2. Application Revenue and Trend Research
8.3. Product Segment Analysis
8.3.1. Indium Gallium Arsenide (Ingaas)
8.3.2. Pyroelectric using crystal, ceramic, thin film or CMOS
8.3.3. Thermopiles
8.3.4. Microbolometers
8.3.5. Others
9. Infrared Detector Market – By Technology (Market Size -$Million / $Billion)
9.1. Cooled IR Detector Technology
9.2. Uncooled IR Detector Technology
10. Infrared Detector Market – By Application (Market Size -$Million / $Billion)
10.1. People & Motion Detection System
10.2. Temperature Measurement System
10.2.1. Low-end temperature measurement systems
10.2.2. High-end temperature measurement systems
10.3. Gas & Fire Detection System
10.4. Smart Buildings IR Systems
10.5. Spectroscopy & Bio Medical Imaging
10.6. Others
11. Infrared Detector - By Geography (Market Size -$Million / $Billion)
11.1. Infrared Detector Market - North America Segment Research
11.2. North America Market Research (Million / $Billion)
11.2.1. Segment type Size and Market Size Analysis
11.2.2. Revenue and Trends
11.2.3. Application Revenue and Trends by type of Application
11.2.4. Company Revenue and Product Analysis
11.2.5. North America Product type and Application Market Size
11.2.5.1. U.S.
11.2.5.2. Canada
11.2.5.3. Mexico
11.2.5.4. Rest of North America
11.3. Infrared Detector - South America Segment Research
11.4. South America Market Research (Market Size -$Million / $Billion)
11.4.1. Segment type Size and Market Size Analysis
11.4.2. Revenue and Trends
11.4.3. Application Revenue and Trends by type of Application
11.4.4. Company Revenue and Product Analysis
11.4.5. South America Product type and Application Market Size
11.4.5.1. Brazil
11.4.5.2. Venezuela
11.4.5.3. Argentina
11.4.5.4. Ecuador
11.4.5.5. Peru
11.4.5.6. Colombia
11.4.5.7. Costa Rica
11.4.5.8. Rest of South America
11.5. Infrared Detector - Europe Segment Research
11.6. Europe Market Research (Market Size -$Million / $Billion)
11.6.1. Segment type Size and Market Size Analysis
11.6.2. Revenue and Trends
11.6.3. Application Revenue and Trends by type of Application
11.6.4. Company Revenue and Product Analysis
11.6.5. Europe Segment Product type and Application Market Size
11.6.5.1. U.K
11.6.5.2. Germany
11.6.5.3. Italy
11.6.5.4. France
11.6.5.5. Netherlands
11.6.5.6. Belgium
11.6.5.7. Spain
11.6.5.8. Denmark
11.6.5.9. Rest of Europe
11.7. Infrared Detector – APAC Segment Research
11.8. APAC Market Research (Market Size -$Million / $Billion)
11.8.1. Segment type Size and Market Size Analysis
11.8.2. Revenue and Trends
11.8.3. Application Revenue and Trends by type of Application
11.8.4. Company Revenue and Product Analysis
11.8.5. APAC Segment – Product type and Application Market Size
11.8.5.1. China
11.8.5.2. Australia
11.8.5.3. Japan
11.8.5.4. South Korea
11.8.5.5. India
11.8.5.6. Taiwan
11.8.5.7. Malaysia
12. Infrared Detector Market - Entropy
12.1. New product launches
12.2. M&A's, collaborations, JVs and partnerships
13. Infrared Detector Market – Industry / Segment Competition landscape Premium
13.1. Market Share Analysis
13.1.1. Market Share by Country- Top companies
13.1.2. Market Share by Region- Top 10 companies
13.1.3. Market Share by type of Application – Top 10 companies
13.1.4. Market Share by type of Product / Product category- Top 10 companies
13.1.5. Market Share at global level- Top 10 companies
13.1.6. Best Practises for companies
14. Infrared Detector Market – Key Company List by Country Premium
15. Infrared Detector Market Company Analysis
15.1. Market Share, Company Revenue, Products, M&A, Developments
15.2. Honeywell International Inc.
15.3. Nippon Ceramic Co., Ltd.
15.4. Texas Instruments Inc.
15.5. FLIR Systems Inc.
15.6. Excelitas Technologies Corp.
15.7. Company 6
15.8. Company 7
15.9. Company 8
15.10. Company 9
15.11. Company 10 and more
"*Financials would be provided on a best efforts basis for private companies"
16. Infrared Detector Market -Appendix
16.1. Abbreviations
16.2. Sources
17. Infrared Detector Market -Methodology Premium
17.1. Research Methodology
17.1.1. Company Expert Interviews
17.1.2. Industry Databases
17.1.3. Associations
17.1.4. Company News
17.1.5. Company Annual Reports
17.1.6. Application Trends
17.1.7. New Products and Product database
17.1.8. Company Transcripts
17.1.9. R&D Trends
17.1.10. Key Opinion Leaders Interviews
17.1.11. Supply and Demand Trends
List of Tables
Table1 Infrared Detector Market Overview 2021-2026
Table2 Infrared Detector Market Leader Analysis 2018-2019 (US$)
Table3 Infrared Detector MarketProduct Analysis 2018-2019 (US$)
Table4 Infrared Detector MarketEnd User Analysis 2018-2019 (US$)
Table5 Infrared Detector MarketPatent Analysis 2013-2018* (US$)
Table6 Infrared Detector MarketFinancial Analysis 2018-2019 (US$)
Table7 Infrared Detector Market Driver Analysis 2018-2019 (US$)
Table8 Infrared Detector MarketChallenges Analysis 2018-2019 (US$)
Table9 Infrared Detector MarketConstraint Analysis 2018-2019 (US$)
Table10 Infrared Detector Market Supplier Bargaining Power Analysis 2018-2019 (US$)
Table11 Infrared Detector Market Buyer Bargaining Power Analysis 2018-2019 (US$)
Table12 Infrared Detector Market Threat of Substitutes Analysis 2018-2019 (US$)
Table13 Infrared Detector Market Threat of New Entrants Analysis 2018-2019 (US$)
Table14 Infrared Detector Market Degree of Competition Analysis 2018-2019 (US$)
Table15 Infrared Detector MarketValue Chain Analysis 2018-2019 (US$)
Table16 Infrared Detector MarketPricing Analysis 2021-2026 (US$)
Table17 Infrared Detector MarketOpportunities Analysis 2021-2026 (US$)
Table18 Infrared Detector MarketProduct Life Cycle Analysis 2021-2026 (US$)
Table19 Infrared Detector MarketSupplier Analysis 2018-2019 (US$)
Table20 Infrared Detector MarketDistributor Analysis 2018-2019 (US$)
Table21 Infrared Detector Market Trend Analysis 2018-2019 (US$)
Table22 Infrared Detector Market Size 2018 (US$)
Table23 Infrared Detector Market Forecast Analysis 2021-2026 (US$)
Table24 Infrared Detector Market Sales Forecast Analysis 2021-2026 (Units)
Table25 Infrared Detector Market, Revenue & Volume,By Type, 2021-2026 ($)
Table26 Infrared Detector MarketBy Type, Revenue & Volume,By Indium Gallium Arsenide, 2021-2026 ($)
Table27 Infrared Detector MarketBy Type, Revenue & Volume,By Pyroelectric using crystal, ceramic, thin film or CMOS, 2021-2026 ($)
Table28 Infrared Detector MarketBy Type, Revenue & Volume,By Thermopiles, 2021-2026 ($)
Table29 Infrared Detector MarketBy Type, Revenue & Volume,By Microbolometers, 2021-2026 ($)
Table30 Infrared Detector Market, Revenue & Volume,By Technology, 2021-2026 ($)
Table31 Infrared Detector MarketBy Technology, Revenue & Volume,By Cooled IR Detector Technology , 2021-2026 ($)
Table32 Infrared Detector MarketBy Technology, Revenue & Volume,By Uncooled IR Detector Technology, 2021-2026 ($)
Table33 Infrared Detector Market, Revenue & Volume,By Application, 2021-2026 ($)
Table34 Infrared Detector MarketBy Application, Revenue & Volume,By People & Motion Detection System , 2021-2026 ($)
Table35 Infrared Detector MarketBy Application, Revenue & Volume,By Temperature Measurement System, 2021-2026 ($)
Table36 Infrared Detector MarketBy Application, Revenue & Volume,By Temperature Measurement System, 2021-2026 ($)
Table37 Infrared Detector MarketBy Application, Revenue & Volume,By Smart Buildings IR Systems, 2021-2026 ($)
Table38 Infrared Detector MarketBy Application, Revenue & Volume,By Spectroscopy & Bio Medical Imaging, 2021-2026 ($)
Table39 North America Infrared Detector Market, Revenue & Volume,By Type, 2021-2026 ($)
Table40 North America Infrared Detector Market, Revenue & Volume,By Technology, 2021-2026 ($)
Table41 North America Infrared Detector Market, Revenue & Volume,By Application, 2021-2026 ($)
Table42 South america Infrared Detector Market, Revenue & Volume,By Type, 2021-2026 ($)
Table43 South america Infrared Detector Market, Revenue & Volume,By Technology, 2021-2026 ($)
Table44 South america Infrared Detector Market, Revenue & Volume,By Application, 2021-2026 ($)
Table45 Europe Infrared Detector Market, Revenue & Volume,By Type, 2021-2026 ($)
Table46 Europe Infrared Detector Market, Revenue & Volume,By Technology, 2021-2026 ($)
Table47 Europe Infrared Detector Market, Revenue & Volume,By Application, 2021-2026 ($)
Table48 APAC Infrared Detector Market, Revenue & Volume,By Type, 2021-2026 ($)
Table49 APAC Infrared Detector Market, Revenue & Volume,By Technology, 2021-2026 ($)
Table50 APAC Infrared Detector Market, Revenue & Volume,By Application, 2021-2026 ($)
Table51 Middle East & Africa Infrared Detector Market, Revenue & Volume,By Type, 2021-2026 ($)
Table52 Middle East & Africa Infrared Detector Market, Revenue & Volume,By Technology, 2021-2026 ($)
Table53 Middle East & Africa Infrared Detector Market, Revenue & Volume,By Application, 2021-2026 ($)
Table54 Russia Infrared Detector Market, Revenue & Volume,By Type, 2021-2026 ($)
Table55 Russia Infrared Detector Market, Revenue & Volume,By Technology, 2021-2026 ($)
Table56 Russia Infrared Detector Market, Revenue & Volume,By Application, 2021-2026 ($)
Table57 Israel Infrared Detector Market, Revenue & Volume,By Type, 2021-2026 ($)
Table58 Israel Infrared Detector Market, Revenue & Volume,By Technology, 2021-2026 ($)
Table59 Israel Infrared Detector Market, Revenue & Volume,By Application, 2021-2026 ($)
Table60 Top Companies 2018 (US$)Infrared Detector Market, Revenue & Volume,,
Table61 Product Launch 2018-2019Infrared Detector Market, Revenue & Volume,,
Table62 Mergers & Acquistions 2018-2019Infrared Detector Market, Revenue & Volume,,
List of Figures
Figure 1 Overview of Infrared Detector Market 2021-2026
Figure 2 Market Share Analysis for Infrared Detector Market 2018 (US$)
Figure 3 Product Comparison in Infrared Detector Market 2018-2019 (US$)
Figure 4 End User Profile for Infrared Detector Market 2018-2019 (US$)
Figure 5 Patent Application and Grant in Infrared Detector Market 2013-2018* (US$)
Figure 6 Top 5 Companies Financial Analysis in Infrared Detector Market 2018-2019 (US$)
Figure 7 Market Entry Strategy in Infrared Detector Market 2018-2019
Figure 8 Ecosystem Analysis in Infrared Detector Market2018
Figure 9 Average Selling Price in Infrared Detector Market 2021-2026
Figure 10 Top Opportunites in Infrared Detector Market 2018-2019
Figure 11 Market Life Cycle Analysis in Infrared Detector Market
Figure 12 GlobalBy TypeInfrared Detector Market Revenue, 2021-2026 ($)
Figure 13 GlobalBy TechnologyInfrared Detector Market Revenue, 2021-2026 ($)
Figure 14 GlobalBy ApplicationInfrared Detector Market Revenue, 2021-2026 ($)
Figure 15 Global Infrared Detector Market - By Geography
Figure 16 Global Infrared Detector Market Value & Volume, By Geography, 2021-2026 ($)
Figure 17 Global Infrared Detector Market CAGR, By Geography, 2021-2026 (%)
Figure 18 North America Infrared Detector Market Value & Volume, 2021-2026 ($)
Figure 19 US Infrared Detector Market Value & Volume, 2021-2026 ($)
Figure 20 US GDP and Population, 2018-2019 ($)
Figure 21 US GDP – Composition of 2018, By Sector of Origin
Figure 22 US Export and Import Value & Volume, 2018-2019 ($)
Figure 23 Canada Infrared Detector Market Value & Volume, 2021-2026 ($)
Figure 24 Canada GDP and Population, 2018-2019 ($)
Figure 25 Canada GDP – Composition of 2018, By Sector of Origin
Figure 26 Canada Export and Import Value & Volume, 2018-2019 ($)
Figure 27 Mexico Infrared Detector Market Value & Volume, 2021-2026 ($)
Figure 28 Mexico GDP and Population, 2018-2019 ($)
Figure 29 Mexico GDP – Composition of 2018, By Sector of Origin
Figure 30 Mexico Export and Import Value & Volume, 2018-2019 ($)
Figure 31 South America Infrared Detector MarketSouth America 3D Printing Market Value & Volume, 2021-2026 ($)
Figure 32 Brazil Infrared Detector Market Value & Volume, 2021-2026 ($)
Figure 33 Brazil GDP and Population, 2018-2019 ($)
Figure 34 Brazil GDP – Composition of 2018, By Sector of Origin
Figure 35 Brazil Export and Import Value & Volume, 2018-2019 ($)
Figure 36 Venezuela Infrared Detector Market Value & Volume, 2021-2026 ($)
Figure 37 Venezuela GDP and Population, 2018-2019 ($)
Figure 38 Venezuela GDP – Composition of 2018, By Sector of Origin
Figure 39 Venezuela Export and Import Value & Volume, 2018-2019 ($)
Figure 40 Argentina Infrared Detector Market Value & Volume, 2021-2026 ($)
Figure 41 Argentina GDP and Population, 2018-2019 ($)
Figure 42 Argentina GDP – Composition of 2018, By Sector of Origin
Figure 43 Argentina Export and Import Value & Volume, 2018-2019 ($)
Figure 44 Ecuador Infrared Detector Market Value & Volume, 2021-2026 ($)
Figure 45 Ecuador GDP and Population, 2018-2019 ($)
Figure 46 Ecuador GDP – Composition of 2018, By Sector of Origin
Figure 47 Ecuador Export and Import Value & Volume, 2018-2019 ($)
Figure 48 Peru Infrared Detector Market Value & Volume, 2021-2026 ($)
Figure 49 Peru GDP and Population, 2018-2019 ($)
Figure 50 Peru GDP – Composition of 2018, By Sector of Origin
Figure 51 Peru Export and Import Value & Volume, 2018-2019 ($)
Figure 52 Colombia Infrared Detector Market Value & Volume, 2021-2026 ($)
Figure 53 Colombia GDP and Population, 2018-2019 ($)
Figure 54 Colombia GDP – Composition of 2018, By Sector of Origin
Figure 55 Colombia Export and Import Value & Volume, 2018-2019 ($)
Figure 56 Costa Rica Infrared Detector MarketCosta Rica 3D Printing Market Value & Volume, 2021-2026 ($)
Figure 57 Costa Rica GDP and Population, 2018-2019 ($)
Figure 58 Costa Rica GDP – Composition of 2018, By Sector of Origin
Figure 59 Costa Rica Export and Import Value & Volume, 2018-2019 ($)
Figure 60 Europe Infrared Detector Market Value & Volume, 2021-2026 ($)
Figure 61 U.K Infrared Detector Market Value & Volume, 2021-2026 ($)
Figure 62 U.K GDP and Population, 2018-2019 ($)
Figure 63 U.K GDP – Composition of 2018, By Sector of Origin
Figure 64 U.K Export and Import Value & Volume, 2018-2019 ($)
Figure 65 Germany Infrared Detector Market Value & Volume, 2021-2026 ($)
Figure 66 Germany GDP and Population, 2018-2019 ($)
Figure 67 Germany GDP – Composition of 2018, By Sector of Origin
Figure 68 Germany Export and Import Value & Volume, 2018-2019 ($)
Figure 69 Italy Infrared Detector Market Value & Volume, 2021-2026 ($)
Figure 70 Italy GDP and Population, 2018-2019 ($)
Figure 71 Italy GDP – Composition of 2018, By Sector of Origin
Figure 72 Italy Export and Import Value & Volume, 2018-2019 ($)
Figure 73 France Infrared Detector Market Value & Volume, 2021-2026 ($)
Figure 74 France GDP and Population, 2018-2019 ($)
Figure 75 France GDP – Composition of 2018, By Sector of Origin
Figure 76 France Export and Import Value & Volume, 2018-2019 ($)
Figure 77 Netherlands Infrared Detector Market Value & Volume, 2021-2026 ($)
Figure 78 Netherlands GDP and Population, 2018-2019 ($)
Figure 79 Netherlands GDP – Composition of 2018, By Sector of Origin
Figure 80 Netherlands Export and Import Value & Volume, 2018-2019 ($)
Figure 81 Belgium Infrared Detector Market Value & Volume, 2021-2026 ($)
Figure 82 Belgium GDP and Population, 2018-2019 ($)
Figure 83 Belgium GDP – Composition of 2018, By Sector of Origin
Figure 84 Belgium Export and Import Value & Volume, 2018-2019 ($)
Figure 85 Spain Infrared Detector Market Value & Volume, 2021-2026 ($)
Figure 86 Spain GDP and Population, 2018-2019 ($)
Figure 87 Spain GDP – Composition of 2018, By Sector of Origin
Figure 88 Spain Export and Import Value & Volume, 2018-2019 ($)
Figure 89 Denmark Infrared Detector Market Value & Volume, 2021-2026 ($)
Figure 90 Denmark GDP and Population, 2018-2019 ($)
Figure 91 Denmark GDP – Composition of 2018, By Sector of Origin
Figure 92 Denmark Export and Import Value & Volume, 2018-2019 ($)
Figure 93 APAC Infrared Detector Market Value & Volume, 2021-2026 ($)
Figure 94 China Infrared Detector MarketValue & Volume, 2021-2026
Figure 95 China GDP and Population, 2018-2019 ($)
Figure 96 China GDP – Composition of 2018, By Sector of Origin
Figure 97 China Export and Import Value & Volume, 2018-2019 ($)Infrared Detector MarketChina Export and Import Value & Volume, 2018-2019 ($)
Figure 98 Australia Infrared Detector Market Value & Volume, 2021-2026 ($)
Figure 99 Australia GDP and Population, 2018-2019 ($)
Figure 100 Australia GDP – Composition of 2018, By Sector of Origin
Figure 101 Australia Export and Import Value & Volume, 2018-2019 ($)
Figure 102 South Korea Infrared Detector Market Value & Volume, 2021-2026 ($)
Figure 103 South Korea GDP and Population, 2018-2019 ($)
Figure 104 South Korea GDP – Composition of 2018, By Sector of Origin
Figure 105 South Korea Export and Import Value & Volume, 2018-2019 ($)
Figure 106 India Infrared Detector Market Value & Volume, 2021-2026 ($)
Figure 107 India GDP and Population, 2018-2019 ($)
Figure 108 India GDP – Composition of 2018, By Sector of Origin
Figure 109 India Export and Import Value & Volume, 2018-2019 ($)
Figure 110 Taiwan Infrared Detector MarketTaiwan 3D Printing Market Value & Volume, 2021-2026 ($)
Figure 111 Taiwan GDP and Population, 2018-2019 ($)
Figure 112 Taiwan GDP – Composition of 2018, By Sector of Origin
Figure 113 Taiwan Export and Import Value & Volume, 2018-2019 ($)
Figure 114 Malaysia Infrared Detector MarketMalaysia 3D Printing Market Value & Volume, 2021-2026 ($)
Figure 115 Malaysia GDP and Population, 2018-2019 ($)
Figure 116 Malaysia GDP – Composition of 2018, By Sector of Origin
Figure 117 Malaysia Export and Import Value & Volume, 2018-2019 ($)
Figure 118 Hong Kong Infrared Detector MarketHong Kong 3D Printing Market Value & Volume, 2021-2026 ($)
Figure 119 Hong Kong GDP and Population, 2018-2019 ($)
Figure 120 Hong Kong GDP – Composition of 2018, By Sector of Origin
Figure 121 Hong Kong Export and Import Value & Volume, 2018-2019 ($)
Figure 122 Middle East & Africa Infrared Detector MarketMiddle East & Africa 3D Printing Market Value & Volume, 2021-2026 ($)
Figure 123 Russia Infrared Detector MarketRussia 3D Printing Market Value & Volume, 2021-2026 ($)
Figure 124 Russia GDP and Population, 2018-2019 ($)
Figure 125 Russia GDP – Composition of 2018, By Sector of Origin
Figure 126 Russia Export and Import Value & Volume, 2018-2019 ($)
Figure 127 Israel Infrared Detector Market Value & Volume, 2021-2026 ($)
Figure 128 Israel GDP and Population, 2018-2019 ($)
Figure 129 Israel GDP – Composition of 2018, By Sector of Origin
Figure 130 Israel Export and Import Value & Volume, 2018-2019 ($)
Figure 131 Entropy Share, By Strategies, 2018-2019* (%)Infrared Detector Market
Figure 132 Developments, 2018-2019*Infrared Detector Market
Figure 133 Company 1 Infrared Detector Market Net Revenue, By Years, 2018-2019* ($)
Figure 134 Company 1 Infrared Detector Market Net Revenue Share, By Business segments, 2018 (%)
Figure 135 Company 1 Infrared Detector Market Net Sales Share, By Geography, 2018 (%)
Figure 136 Company 2 Infrared Detector Market Net Revenue, By Years, 2018-2019* ($)
Figure 137 Company 2 Infrared Detector Market Net Revenue Share, By Business segments, 2018 (%)
Figure 138 Company 2 Infrared Detector Market Net Sales Share, By Geography, 2018 (%)
Figure 139 Company 3Infrared Detector Market Net Revenue, By Years, 2018-2019* ($)
Figure 140 Company 3Infrared Detector Market Net Revenue Share, By Business segments, 2018 (%)
Figure 141 Company 3Infrared Detector Market Net Sales Share, By Geography, 2018 (%)
Figure 142 Company 4 Infrared Detector Market Net Revenue, By Years, 2018-2019* ($)
Figure 143 Company 4 Infrared Detector Market Net Revenue Share, By Business segments, 2018 (%)
Figure 144 Company 4 Infrared Detector Market Net Sales Share, By Geography, 2018 (%)
Figure 145 Company 5 Infrared Detector Market Net Revenue, By Years, 2018-2019* ($)
Figure 146 Company 5 Infrared Detector Market Net Revenue Share, By Business segments, 2018 (%)
Figure 147 Company 5 Infrared Detector Market Net Sales Share, By Geography, 2018 (%)
Figure 148 Company 6 Infrared Detector Market Net Revenue, By Years, 2018-2019* ($)
Figure 149 Company 6 Infrared Detector Market Net Revenue Share, By Business segments, 2018 (%)
Figure 150 Company 6 Infrared Detector Market Net Sales Share, By Geography, 2018 (%)
Figure 151 Company 7 Infrared Detector Market Net Revenue, By Years, 2018-2019* ($)
Figure 152 Company 7 Infrared Detector Market Net Revenue Share, By Business segments, 2018 (%)
Figure 153 Company 7 Infrared Detector Market Net Sales Share, By Geography, 2018 (%)
Figure 154 Company 8 Infrared Detector Market Net Revenue, By Years, 2018-2019* ($)
Figure 155 Company 8 Infrared Detector Market Net Revenue Share, By Business segments, 2018 (%)
Figure 156 Company 8 Infrared Detector Market Net Sales Share, By Geography, 2018 (%)
Figure 157 Company 9 Infrared Detector Market Net Revenue, By Years, 2018-2019* ($)
Figure 158 Company 9 Infrared Detector Market Net Revenue Share, By Business segments, 2018 (%)
Figure 159 Company 9 Infrared Detector Market Net Sales Share, By Geography, 2018 (%)
Figure 160 Company 10 Infrared Detector Market Net Revenue, By Years, 2018-2019* ($)
Figure 161 Company 10 Infrared Detector Market Net Revenue Share, By Business segments, 2018 (%)
Figure 162 Company 10 Infrared Detector Market Net Sales Share, By Geography, 2018 (%)
Figure 163 Company 11 Infrared Detector Market Net Revenue, By Years, 2018-2019* ($)
Figure 164 Company 11 Infrared Detector Market Net Revenue Share, By Business segments, 2018 (%)
Figure 165 Company 11 Infrared Detector Market Net Sales Share, By Geography, 2018 (%)
Figure 166 Company 12 Infrared Detector Market Net Revenue, By Years, 2018-2019* ($)
Figure 167 Company 12 Infrared Detector Market Net Revenue Share, By Business segments, 2018 (%)
Figure 168 Company 12 Infrared Detector Market Net Sales Share, By Geography, 2018 (%)
Figure 169 Company 13Infrared Detector Market Net Revenue, By Years, 2018-2019* ($)
Figure 170 Company 13Infrared Detector Market Net Revenue Share, By Business segments, 2018 (%)
Figure 171 Company 13Infrared Detector Market Net Sales Share, By Geography, 2018 (%)
Figure 172 Company 14 Infrared Detector Market Net Revenue, By Years, 2018-2019* ($)
Figure 173 Company 14 Infrared Detector Market Net Revenue Share, By Business segments, 2018 (%)
Figure 174 Company 14 Infrared Detector Market Net Sales Share, By Geography, 2018 (%)
Figure 175 Company 15 Infrared Detector Market Net Revenue, By Years, 2018-2019* ($)
Figure 176 Company 15 Infrared Detector Market Net Revenue Share, By Business segments, 2018 (%)
Figure 177 Company 15 Infrared Detector Market Net Sales Share, By Geography, 2018 (%)