 Email
Email Print
Print


Transfer switch is an electrical device that switches load between two power sources either mechanically or electrically. Transfer switches are able to provide quick transition between two or more power sources for an uninterrupted power supply if any of the power sources fails. Transfer switches are utilized in various industrial and residential establishments for uninterrupted power supply. Although, the market for transfer switches is relatively mature, technological innovations such as automatic mode has further improved its usage practicality.
Recently transfer switches are coming as permanent part of the control panel and makes switching more easy and safer. Unexpected brownouts and voltage fluctuation, outages, blackouts, and weather uncertainties have fuel the demand for reliable power transmission, which in turn propel transfer switch market widely. Further, growing dependence on power and critical application in industries, commercial institutions, healthcare, transportation, and households are also attributing to the growth in the market.
The demand for electricity is rapidly rising, especially in emerging economies such as China, India, and Brazil. Transfer switches are utilized for supplying back-up power for critical applications in industries such as healthcare, telecommunication, and IT among others. Factors such as need for uninterrupted and reliable power, industrialization and urbanization are expected to drive the global transfer switch market.
This report identifies the global transfer switch market size in for the year 2016-2017, and forecast till 2028. Transfer switch market report also highlights the potential growth and opportunities in the fore coming years, while also reviewing the market drivers, restraints, growth indicators, challenges, market dynamics, competitive landscape, and other key aspects with respect to transfer switch market.
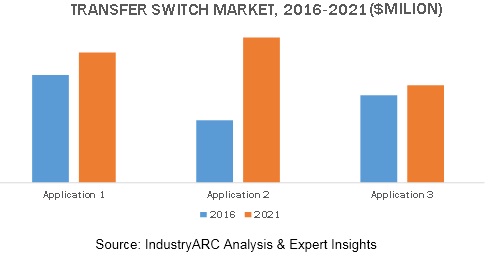
Geographically, Asia Pacific is estimated to be the largest market for transfer switches owing to the increasing urbanization and industrialization in countries such as China and India. Followed by Asia, Pacific, North America and Europe stood at the second and third position in the global transfer switch respectively. Among all applications, the industrial segment had the highest share in the global transfer switch market.
- This report segments global transfer switch market on the basis of type, transition, and application market as follows:
- Transfer Switch Market, by Type: Automatic Transfer Switch, and Manual Transfer Switch
- Transfer Switch Market, by Transition Mode: Open Transition Mode, Closed Transition Mode, Delayed Transition Mode, and Soft Load Transition Mode
- Transfer Switch Market, by ampere rating: (= 400), In between 401 to 1600 and Greater than 1600 (>1600)
- Transfer Switch Market, by Application: Industrial, Commercial, and Residential
- This is report has been further segmented into major regions, which includes detailed analysis of each region such as: North America, Europe, Asia-Pacific (APAC), and Rest of the World (RoW) covering all the major country level markets in each of the region
Sample Companies Profiled in this Report are:
- ABB Ltd.
- General Electric
- Emerson Electric Co.
- Cummins
- Schneider Electric SE
- 10+
1. Transfer Switch Market – Market Overview
2. Transfer Switch Market – Executive Summary
3. Transfer Switch Market – Market Landscape
3.1. Market Share Analysis
3.2. Comparative Analysis
3.2.1. Product Benchmarking
3.2.2. End User Profiling
3.2.3. Patent Analysis
3.2.4. Top 5 Financial Analysis
4. Transfer Switch Market – Market Forces
4.1. Market Drivers
4.1.1. Increasing demand for power
4.1.2. Development of smart grid
4.2. Market Constraints
4.2.1. Maintenance issues
4.3. Market Opportunities
4.3.1. Growing Urbanization in Developing Nation
4.4. Market Challenges
4.5. Attractiveness of Transfer Switch Market
4.5.1. Power of Suppliers
4.5.2. Power of Customers
4.5.3. Threat of New Entrants
4.5.4. Threat of Substitutions
4.5.5. Degree of Competitions
5. Transfer Switch Market – Strategic Analysis
5.1. Value Chain Analysis
5.2. Pricing Analysis
5.3. Opportunities Analysis
5.4. Product/Market Lifecycles Analysis
5.5. Suppliers & Distributors
6. Transfer Switch Market – By Types
6.1. Automatic Transfer Switch
6.1.1. Circuit Based
6.1.2. Static
6.1.3. Contractor Based
6.2. Manual Transfer Switch
7. Transfer Switch Market – By Transition Mode
7.1. Open Transition Mode
7.2. Closed Transition Mode
7.3. Delayed Transition Mode
7.4. Soft Load Transition Mode
8. Transfer Switch Market – By Ampere Rating
8.1. Less than or equal to 400 (= 400)
8.2. In between 401 to 1600
8.3. Greater than 1600 (>1600)
9. Transfer Switch Market – By Application
9.1. Industrial
9.1.1. Telecom
9.1.2. Utilities
9.1.3. Transportation
9.2. Commercial
9.3. Residential
10. GEOGRAPHIC ANALYSIS
10.1. Introduction
10.2. Americas
10.2.1. U.S.
10.2.2. Canada
10.2.3. Mexico
10.2.4. Brazil
10.2.5. Argentina
10.2.6. Rest of Americas
10.3. Europe
10.3.1. U.K.
10.3.2. Germany
10.3.3. France
10.3.4. Spain
10.3.5. Italy
10.3.6. Rest of Europe
10.4. APAC
10.4.1. China
10.4.2. Japan
10.4.3. India
10.4.4. South Korea
10.4.5. Australia & New Zealand
10.4.6. Rest of APAC
10.5. ROW
10.5.1. Middle East
10.5.2. Africa
11. MARKET ENTROPY
11.1. New Product Developments
11.2. Product Launches, JVs, Mergers and Acquisitions
12. COMPANY PROFILES
12.1. Company 1
12.2. Company 2
12.3. Company 3
12.4. Company 4
12.5. Company 5
12.6. Company 6
12.7. Company 7
12.8. Company 8
12.9. Company 9
12.10. Company 10
*More than 10 Companies are profiled in this Research Report*
"*Financials would be provided on a best efforts basis for private companies"
13. APPENDIX
13.1. Abbreviations
13.2. Sources
13.3. Research Methodology
13.4. Bibliography
13.5. Compilation of Experts
13.6. Disclaimer
List of Tables
Table 1 Transfer Switch Market Overview 2023-2030
Table 2 Transfer Switch Market Leader Analysis 2023-2030 (US$)
Table 3 Transfer Switch Market Product Analysis 2023-2030 (US$)
Table 4 Transfer Switch Market End User Analysis 2023-2030 (US$)
Table 5 Transfer Switch Market Patent Analysis 2013-2023* (US$)
Table 6 Transfer Switch Market Financial Analysis 2023-2030 (US$)
Table 7 Transfer Switch Market Driver Analysis 2023-2030 (US$)
Table 8 Transfer Switch Market Challenges Analysis 2023-2030 (US$)
Table 9 Transfer Switch Market Constraint Analysis 2023-2030 (US$)
Table 10 Transfer Switch Market Supplier Bargaining Power Analysis 2023-2030 (US$)
Table 11 Transfer Switch Market Buyer Bargaining Power Analysis 2023-2030 (US$)
Table 12 Transfer Switch Market Threat of Substitutes Analysis 2023-2030 (US$)
Table 13 Transfer Switch Market Threat of New Entrants Analysis 2023-2030 (US$)
Table 14 Transfer Switch Market Degree of Competition Analysis 2023-2030 (US$)
Table 15 Transfer Switch Market Value Chain Analysis 2023-2030 (US$)
Table 16 Transfer Switch Market Pricing Analysis 2023-2030 (US$)
Table 17 Transfer Switch Market Opportunities Analysis 2023-2030 (US$)
Table 18 Transfer Switch Market Product Life Cycle Analysis 2023-2030 (US$)
Table 19 Transfer Switch Market Supplier Analysis 2023-2030 (US$)
Table 20 Transfer Switch Market Distributor Analysis 2023-2030 (US$)
Table 21 Transfer Switch Market Trend Analysis 2023-2030 (US$)
Table 22 Transfer Switch Market Size 2023 (US$)
Table 23 Transfer Switch Market Forecast Analysis 2023-2030 (US$)
Table 24 Transfer Switch Market Sales Forecast Analysis 2023-2030 (Units)
Table 25 Transfer Switch Market , Revenue & Volume,By Type, 2023-2030 ($)
Table 26 Transfer Switch Market By Type, Revenue & Volume,By Automatic Transfer Switch, 2023-2030 ($)
Table 27 Transfer Switch Market By Type, Revenue & Volume,By Circuit Based, 2023-2030 ($)
Table 28 Transfer Switch Market By Type, Revenue & Volume,By Static, 2023-2030 ($)
Table 29 Transfer Switch Market By Type, Revenue & Volume,By Contractor Based, 2023-2030 ($)
Table 30 Transfer Switch Market By Type, Revenue & Volume,By Manual Transfer Switch, 2023-2030 ($)
Table 31 Transfer Switch Market , Revenue & Volume,By Transition Mode, 2023-2030 ($)
Table 32 Transfer Switch Market By Transition Mode, Revenue & Volume,By Open Transition Mode, 2023-2030 ($)
Table 33 Transfer Switch Market By Transition Mode, Revenue & Volume,By Closed Transition Mode, 2023-2030 ($)
Table 34 Transfer Switch Market By Transition Mode, Revenue & Volume,By Delayed Transition Mode, 2023-2030 ($)
Table 35 Transfer Switch Market By Transition Mode, Revenue & Volume,By Soft Load Transition Mode, 2023-2030 ($)
Table 36 Transfer Switch Market , Revenue & Volume,By Ampere Rating, 2023-2030 ($)
Table 37 Transfer Switch Market By Ampere Rating, Revenue & Volume,By Less than or equal to 400 (= 400), 2023-2030 ($)
Table 38 Transfer Switch Market By Ampere Rating, Revenue & Volume,By In between 401 to 1600, 2023-2030 ($)
Table 39 Transfer Switch Market By Ampere Rating, Revenue & Volume,By Greater than 1600 (>1600), 2023-2030 ($)
Table 40 Transfer Switch Market , Revenue & Volume,By Application, 2023-2030 ($)
Table 41 Transfer Switch Market By Application, Revenue & Volume,By Industrial, 2023-2030 ($)
Table 42 Transfer Switch Market By Application, Revenue & Volume,By Telecom, 2023-2030 ($)
Table 43 Transfer Switch Market By Application, Revenue & Volume,By Utilities, 2023-2030 ($)
Table 44 Transfer Switch Market By Application, Revenue & Volume,By Commercial, 2023-2030 ($)
Table 45 Transfer Switch Market By Application, Revenue & Volume,By Residential, 2023-2030 ($)
Table 46 North America Transfer Switch Market , Revenue & Volume,By Type, 2023-2030 ($)
Table 47 North America Transfer Switch Market , Revenue & Volume,By Transition Mode, 2023-2030 ($)
Table 48 North America Transfer Switch Market , Revenue & Volume,By Ampere Rating, 2023-2030 ($)
Table 49 North America Transfer Switch Market , Revenue & Volume,By Application, 2023-2030 ($)
Table 50 South america Transfer Switch Market , Revenue & Volume,By Type, 2023-2030 ($)
Table 51 South america Transfer Switch Market , Revenue & Volume,By Transition Mode, 2023-2030 ($)
Table 52 South america Transfer Switch Market , Revenue & Volume,By Ampere Rating, 2023-2030 ($)
Table 53 South america Transfer Switch Market , Revenue & Volume,By Application, 2023-2030 ($)
Table 54 Europe Transfer Switch Market , Revenue & Volume,By Type, 2023-2030 ($)
Table 55 Europe Transfer Switch Market , Revenue & Volume,By Transition Mode, 2023-2030 ($)
Table 56 Europe Transfer Switch Market , Revenue & Volume,By Ampere Rating, 2023-2030 ($)
Table 57 Europe Transfer Switch Market , Revenue & Volume,By Application, 2023-2030 ($)
Table 58 APAC Transfer Switch Market , Revenue & Volume,By Type, 2023-2030 ($)
Table 59 APAC Transfer Switch Market , Revenue & Volume,By Transition Mode, 2023-2030 ($)
Table 60 APAC Transfer Switch Market , Revenue & Volume,By Ampere Rating, 2023-2030 ($)
Table 61 APAC Transfer Switch Market , Revenue & Volume,By Application, 2023-2030 ($)
Table 62 Middle East & Africa Transfer Switch Market , Revenue & Volume,By Type, 2023-2030 ($)
Table 63 Middle East & Africa Transfer Switch Market , Revenue & Volume,By Transition Mode, 2023-2030 ($)
Table 64 Middle East & Africa Transfer Switch Market , Revenue & Volume,By Ampere Rating, 2023-2030 ($)
Table 65 Middle East & Africa Transfer Switch Market , Revenue & Volume,By Application, 2023-2030 ($)
Table 66 Russia Transfer Switch Market , Revenue & Volume,By Type, 2023-2030 ($)
Table 67 Russia Transfer Switch Market , Revenue & Volume,By Transition Mode, 2023-2030 ($)
Table 68 Russia Transfer Switch Market , Revenue & Volume,By Ampere Rating, 2023-2030 ($)
Table 69 Russia Transfer Switch Market , Revenue & Volume,By Application, 2023-2030 ($)
Table 70 Israel Transfer Switch Market , Revenue & Volume,By Type, 2023-2030 ($)
Table 71 Israel Transfer Switch Market , Revenue & Volume,By Transition Mode, 2023-2030 ($)
Table 72 Israel Transfer Switch Market , Revenue & Volume,By Ampere Rating, 2023-2030 ($)
Table 73 Israel Transfer Switch Market , Revenue & Volume,By Application, 2023-2030 ($)
Table 74 Top Companies 2023 (US$)Transfer Switch Market , Revenue & Volume,,
Table 75 Product Launch 2023-2030Transfer Switch Market , Revenue & Volume,,
Table 76 Mergers & Acquistions 2023-2030Transfer Switch Market , Revenue & Volume,,
List of Figures
Figure 1 Overview of Transfer Switch Market 2023-2030
Figure 2 Market Share Analysis for Transfer Switch Market 2023 (US$)
Figure 3 Product Comparison in Transfer Switch Market 2023-2030 (US$)
Figure 4 End User Profile for Transfer Switch Market 2023-2030 (US$)
Figure 5 Patent Application and Grant in Transfer Switch Market 2013-2023* (US$)
Figure 6 Top 5 Companies Financial Analysis in Transfer Switch Market 2023-2030 (US$)
Figure 7 Market Entry Strategy in Transfer Switch Market 2023-2030
Figure 8 Ecosystem Analysis in Transfer Switch Market 2023
Figure 9 Average Selling Price in Transfer Switch Market 2023-2030
Figure 10 Top Opportunites in Transfer Switch Market 2023-2030
Figure 11 Market Life Cycle Analysis in Transfer Switch Market
Figure 12 GlobalBy TypeTransfer Switch Market Revenue, 2023-2030 ($)
Figure 13 GlobalBy Transition ModeTransfer Switch Market Revenue, 2023-2030 ($)
Figure 14 GlobalBy Ampere RatingTransfer Switch Market Revenue, 2023-2030 ($)
Figure 15 GlobalBy ApplicationTransfer Switch Market Revenue, 2023-2030 ($)
Figure 16 Global Transfer Switch Market - By Geography
Figure 17 Global Transfer Switch Market Value & Volume, By Geography, 2023-2030 ($)
Figure 18 Global Transfer Switch Market CAGR, By Geography, 2023-2030 (%)
Figure 19 North America Transfer Switch Market Value & Volume, 2023-2030 ($)
Figure 20 US Transfer Switch Market Value & Volume, 2023-2030 ($)
Figure 21 US GDP and Population, 2023-2030 ($)
Figure 22 US GDP – Composition of 2023, By Sector of Origin
Figure 23 US Export and Import Value & Volume, 2023-2030 ($)
Figure 24 Canada Transfer Switch Market Value & Volume, 2023-2030 ($)
Figure 25 Canada GDP and Population, 2023-2030 ($)
Figure 26 Canada GDP – Composition of 2023, By Sector of Origin
Figure 27 Canada Export and Import Value & Volume, 2023-2030 ($)
Figure 28 Mexico Transfer Switch Market Value & Volume, 2023-2030 ($)
Figure 29 Mexico GDP and Population, 2023-2030 ($)
Figure 30 Mexico GDP – Composition of 2023, By Sector of Origin
Figure 31 Mexico Export and Import Value & Volume, 2023-2030 ($)
Figure 32 South America Transfer Switch Market South America 3D Printing Market Value & Volume, 2023-2030 ($)
Figure 33 Brazil Transfer Switch Market Value & Volume, 2023-2030 ($)
Figure 34 Brazil GDP and Population, 2023-2030 ($)
Figure 35 Brazil GDP – Composition of 2023, By Sector of Origin
Figure 36 Brazil Export and Import Value & Volume, 2023-2030 ($)
Figure 37 Venezuela Transfer Switch Market Value & Volume, 2023-2030 ($)
Figure 38 Venezuela GDP and Population, 2023-2030 ($)
Figure 39 Venezuela GDP – Composition of 2023, By Sector of Origin
Figure 40 Venezuela Export and Import Value & Volume, 2023-2030 ($)
Figure 41 Argentina Transfer Switch Market Value & Volume, 2023-2030 ($)
Figure 42 Argentina GDP and Population, 2023-2030 ($)
Figure 43 Argentina GDP – Composition of 2023, By Sector of Origin
Figure 44 Argentina Export and Import Value & Volume, 2023-2030 ($)
Figure 45 Ecuador Transfer Switch Market Value & Volume, 2023-2030 ($)
Figure 46 Ecuador GDP and Population, 2023-2030 ($)
Figure 47 Ecuador GDP – Composition of 2023, By Sector of Origin
Figure 48 Ecuador Export and Import Value & Volume, 2023-2030 ($)
Figure 49 Peru Transfer Switch Market Value & Volume, 2023-2030 ($)
Figure 50 Peru GDP and Population, 2023-2030 ($)
Figure 51 Peru GDP – Composition of 2023, By Sector of Origin
Figure 52 Peru Export and Import Value & Volume, 2023-2030 ($)
Figure 53 Colombia Transfer Switch Market Value & Volume, 2023-2030 ($)
Figure 54 Colombia GDP and Population, 2023-2030 ($)
Figure 55 Colombia GDP – Composition of 2023, By Sector of Origin
Figure 56 Colombia Export and Import Value & Volume, 2023-2030 ($)
Figure 57 Costa Rica Transfer Switch Market Costa Rica 3D Printing Market Value & Volume, 2023-2030 ($)
Figure 58 Costa Rica GDP and Population, 2023-2030 ($)
Figure 59 Costa Rica GDP – Composition of 2023, By Sector of Origin
Figure 60 Costa Rica Export and Import Value & Volume, 2023-2030 ($)
Figure 61 Europe Transfer Switch Market Value & Volume, 2023-2030 ($)
Figure 62 U.K Transfer Switch Market Value & Volume, 2023-2030 ($)
Figure 63 U.K GDP and Population, 2023-2030 ($)
Figure 64 U.K GDP – Composition of 2023, By Sector of Origin
Figure 65 U.K Export and Import Value & Volume, 2023-2030 ($)
Figure 66 Germany Transfer Switch Market Value & Volume, 2023-2030 ($)
Figure 67 Germany GDP and Population, 2023-2030 ($)
Figure 68 Germany GDP – Composition of 2023, By Sector of Origin
Figure 69 Germany Export and Import Value & Volume, 2023-2030 ($)
Figure 70 Italy Transfer Switch Market Value & Volume, 2023-2030 ($)
Figure 71 Italy GDP and Population, 2023-2030 ($)
Figure 72 Italy GDP – Composition of 2023, By Sector of Origin
Figure 73 Italy Export and Import Value & Volume, 2023-2030 ($)
Figure 74 France Transfer Switch Market Value & Volume, 2023-2030 ($)
Figure 75 France GDP and Population, 2023-2030 ($)
Figure 76 France GDP – Composition of 2023, By Sector of Origin
Figure 77 France Export and Import Value & Volume, 2023-2030 ($)
Figure 78 Netherlands Transfer Switch Market Value & Volume, 2023-2030 ($)
Figure 79 Netherlands GDP and Population, 2023-2030 ($)
Figure 80 Netherlands GDP – Composition of 2023, By Sector of Origin
Figure 81 Netherlands Export and Import Value & Volume, 2023-2030 ($)
Figure 82 Belgium Transfer Switch Market Value & Volume, 2023-2030 ($)
Figure 83 Belgium GDP and Population, 2023-2030 ($)
Figure 84 Belgium GDP – Composition of 2023, By Sector of Origin
Figure 85 Belgium Export and Import Value & Volume, 2023-2030 ($)
Figure 86 Spain Transfer Switch Market Value & Volume, 2023-2030 ($)
Figure 87 Spain GDP and Population, 2023-2030 ($)
Figure 88 Spain GDP – Composition of 2023, By Sector of Origin
Figure 89 Spain Export and Import Value & Volume, 2023-2030 ($)
Figure 90 Denmark Transfer Switch Market Value & Volume, 2023-2030 ($)
Figure 91 Denmark GDP and Population, 2023-2030 ($)
Figure 92 Denmark GDP – Composition of 2023, By Sector of Origin
Figure 93 Denmark Export and Import Value & Volume, 2023-2030 ($)
Figure 94 APAC Transfer Switch Market Value & Volume, 2023-2030 ($)
Figure 95 China Transfer Switch Market Value & Volume, 2023-2030
Figure 96 China GDP and Population, 2023-2030 ($)
Figure 97 China GDP – Composition of 2023, By Sector of Origin
Figure 98 China Export and Import Value & Volume, 2023-2030 ($)Transfer Switch Market China Export and Import Value & Volume, 2023-2030 ($)
Figure 99 Australia Transfer Switch Market Value & Volume, 2023-2030 ($)
Figure 100 Australia GDP and Population, 2023-2030 ($)
Figure 101 Australia GDP – Composition of 2023, By Sector of Origin
Figure 102 Australia Export and Import Value & Volume, 2023-2030 ($)
Figure 103 South Korea Transfer Switch Market Value & Volume, 2023-2030 ($)
Figure 104 South Korea GDP and Population, 2023-2030 ($)
Figure 105 South Korea GDP – Composition of 2023, By Sector of Origin
Figure 106 South Korea Export and Import Value & Volume, 2023-2030 ($)
Figure 107 India Transfer Switch Market Value & Volume, 2023-2030 ($)
Figure 108 India GDP and Population, 2023-2030 ($)
Figure 109 India GDP – Composition of 2023, By Sector of Origin
Figure 110 India Export and Import Value & Volume, 2023-2030 ($)
Figure 111 Taiwan Transfer Switch Market Taiwan 3D Printing Market Value & Volume, 2023-2030 ($)
Figure 112 Taiwan GDP and Population, 2023-2030 ($)
Figure 113 Taiwan GDP – Composition of 2023, By Sector of Origin
Figure 114 Taiwan Export and Import Value & Volume, 2023-2030 ($)
Figure 115 Malaysia Transfer Switch Market Malaysia 3D Printing Market Value & Volume, 2023-2030 ($)
Figure 116 Malaysia GDP and Population, 2023-2030 ($)
Figure 117 Malaysia GDP – Composition of 2023, By Sector of Origin
Figure 118 Malaysia Export and Import Value & Volume, 2023-2030 ($)
Figure 119 Hong Kong Transfer Switch Market Hong Kong 3D Printing Market Value & Volume, 2023-2030 ($)
Figure 120 Hong Kong GDP and Population, 2023-2030 ($)
Figure 121 Hong Kong GDP – Composition of 2023, By Sector of Origin
Figure 122 Hong Kong Export and Import Value & Volume, 2023-2030 ($)
Figure 123 Middle East & Africa Transfer Switch Market Middle East & Africa 3D Printing Market Value & Volume, 2023-2030 ($)
Figure 124 Russia Transfer Switch Market Russia 3D Printing Market Value & Volume, 2023-2030 ($)
Figure 125 Russia GDP and Population, 2023-2030 ($)
Figure 126 Russia GDP – Composition of 2023, By Sector of Origin
Figure 127 Russia Export and Import Value & Volume, 2023-2030 ($)
Figure 128 Israel Transfer Switch Market Value & Volume, 2023-2030 ($)
Figure 129 Israel GDP and Population, 2023-2030 ($)
Figure 130 Israel GDP – Composition of 2023, By Sector of Origin
Figure 131 Israel Export and Import Value & Volume, 2023-2030 ($)
Figure 132 Entropy Share, By Strategies, 2023-2030* (%)Transfer Switch Market
Figure 133 Developments, 2023-2030*Transfer Switch Market
Figure 134 Company 1 Transfer Switch Market Net Revenue, By Years, 2023-2030* ($)
Figure 135 Company 1 Transfer Switch Market Net Revenue Share, By Business segments, 2023 (%)
Figure 136 Company 1 Transfer Switch Market Net Sales Share, By Geography, 2023 (%)
Figure 137 Company 2 Transfer Switch Market Net Revenue, By Years, 2023-2030* ($)
Figure 138 Company 2 Transfer Switch Market Net Revenue Share, By Business segments, 2023 (%)
Figure 139 Company 2 Transfer Switch Market Net Sales Share, By Geography, 2023 (%)
Figure 140 Company 3Transfer Switch Market Net Revenue, By Years, 2023-2030* ($)
Figure 141 Company 3Transfer Switch Market Net Revenue Share, By Business segments, 2023 (%)
Figure 142 Company 3Transfer Switch Market Net Sales Share, By Geography, 2023 (%)
Figure 143 Company 4 Transfer Switch Market Net Revenue, By Years, 2023-2030* ($)
Figure 144 Company 4 Transfer Switch Market Net Revenue Share, By Business segments, 2023 (%)
Figure 145 Company 4 Transfer Switch Market Net Sales Share, By Geography, 2023 (%)
Figure 146 Company 5 Transfer Switch Market Net Revenue, By Years, 2023-2030* ($)
Figure 147 Company 5 Transfer Switch Market Net Revenue Share, By Business segments, 2023 (%)
Figure 148 Company 5 Transfer Switch Market Net Sales Share, By Geography, 2023 (%)
Figure 149 Company 6 Transfer Switch Market Net Revenue, By Years, 2023-2030* ($)
Figure 150 Company 6 Transfer Switch Market Net Revenue Share, By Business segments, 2023 (%)
Figure 151 Company 6 Transfer Switch Market Net Sales Share, By Geography, 2023 (%)
Figure 152 Company 7 Transfer Switch Market Net Revenue, By Years, 2023-2030* ($)
Figure 153 Company 7 Transfer Switch Market Net Revenue Share, By Business segments, 2023 (%)
Figure 154 Company 7 Transfer Switch Market Net Sales Share, By Geography, 2023 (%)
Figure 155 Company 8 Transfer Switch Market Net Revenue, By Years, 2023-2030* ($)
Figure 156 Company 8 Transfer Switch Market Net Revenue Share, By Business segments, 2023 (%)
Figure 157 Company 8 Transfer Switch Market Net Sales Share, By Geography, 2023 (%)
Figure 158 Company 9 Transfer Switch Market Net Revenue, By Years, 2023-2030* ($)
Figure 159 Company 9 Transfer Switch Market Net Revenue Share, By Business segments, 2023 (%)
Figure 160 Company 9 Transfer Switch Market Net Sales Share, By Geography, 2023 (%)
Figure 161 Company 10 Transfer Switch Market Net Revenue, By Years, 2023-2030* ($)
Figure 162 Company 10 Transfer Switch Market Net Revenue Share, By Business segments, 2023 (%)
Figure 163 Company 10 Transfer Switch Market Net Sales Share, By Geography, 2023 (%)
Figure 164 Company 11 Transfer Switch Market Net Revenue, By Years, 2023-2030* ($)
Figure 165 Company 11 Transfer Switch Market Net Revenue Share, By Business segments, 2023 (%)
Figure 166 Company 11 Transfer Switch Market Net Sales Share, By Geography, 2023 (%)
Figure 167 Company 12 Transfer Switch Market Net Revenue, By Years, 2023-2030* ($)
Figure 168 Company 12 Transfer Switch Market Net Revenue Share, By Business segments, 2023 (%)
Figure 169 Company 12 Transfer Switch Market Net Sales Share, By Geography, 2023 (%)
Figure 170 Company 13Transfer Switch Market Net Revenue, By Years, 2023-2030* ($)
Figure 171 Company 13Transfer Switch Market Net Revenue Share, By Business segments, 2023 (%)
Figure 172 Company 13Transfer Switch Market Net Sales Share, By Geography, 2023 (%)
Figure 173 Company 14 Transfer Switch Market Net Revenue, By Years, 2023-2030* ($)
Figure 174 Company 14 Transfer Switch Market Net Revenue Share, By Business segments, 2023 (%)
Figure 175 Company 14 Transfer Switch Market Net Sales Share, By Geography, 2023 (%)
Figure 176 Company 15 Transfer Switch Market Net Revenue, By Years, 2023-2030* ($)
Figure 177 Company 15 Transfer Switch Market Net Revenue Share, By Business segments, 2023 (%)
Figure 178 Company 15 Transfer Switch Market Net Sales Share, By Geography, 2023 (%)