Online / E-Grocery Market - Forecast(2024 - 2030)

Report Code: FBR 0106 Report Format: PDF + Excel

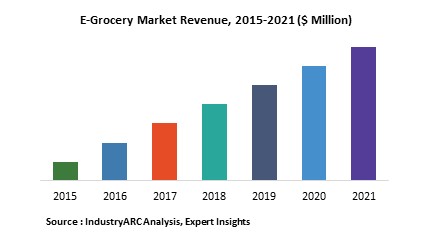
Online / E-grocery Market Overview:

According to the US Department of Agriculture, more than 25 million Americans do not have access to a grocery store in their residential vicinity. These citizens lack access to nutritious food and often rely on packaged products for their nutritional needs. The e-grocery market is largely preferred by millennials as they are majorly influenced by shopping trends with their active usage of smartphones. There are different kinds of products sold online such as food products; beverages; cosmetics; personal care and baby care products; stationery items, household goods, and others. Staple pantry items have emerged to be the most extensively sold items, and the segment is estimated to register a compound annual growth rate (CAGR) of 37.40% through to 2025. The global e-grocery market will witness growth owing to the rise of smartphone usage, with the millennial population leading the charge. During the forecast period 2019-2025, the market is evaluated to grow at an outstanding CAGR of 41.24%. The market was valued at $29.57 billion as of 2018.

Online / E-grocery Market Outlook:

The e-grocery market consists of either offline stores that also allow online ordering or standalone websites that only exist online and do not have offline accessible stores. These stores have been gaining popularity as they offer convenience and ease of accessibility. The e-grocery market is witnessing a considerable amount of innovations in recent years. For instance, in 2017, Thistle launched meal kits for making nutritious baby food at home.  Most of the key market players such as AmazonFresh and Walmart, exist in North America. This is one of the major reasons why the e-grocery market managed to get its maximum demand share from North America, with the regional share being 61.40% in 2018.

Online / E-grocery Market Growth Drivers:

Ø  The Need For A Healthy Diet

According to the United States Department of Agriculture, the lack of a proper grocery store in a person’s vicinity leads him/her to consume more packaged products. The former First Lady of the U.S. emphasized on the need for healthier diets through her campaign called “Let’s Move”. This has been a capitalizing factor for key market players in the e-commerce market as e-grocery websites make grocery available for everyone without the limitation of location.

Ø  Ease of Access

Due to the growing population, the necessity for working has become prominent. Nearly all adults of a family are now counted in the working class as they do jobs to make ends meet. E-grocery websites make use of this factor and provide options to let customers browse through groceries online without bearing the physical pain of going outside. This has acted as an important growth driver for this market.

Online / E-grocery Market Challenges:

A prominent challenge faced by the e-grocery market key players is the exorbitant inventory costs. Companies incur massive financial losses in storage and delivery of groceries. A tentative solution to this challenge is state-of-the-art inventory management API that can bring down inventory costs. Pairing up with a reliable delivery service is another way to combat this.


E-Grocery Market

Online / E-grocery Market Key Players Perspective:

Key market players operating in the e-grocery market are AmazonFresh, LLC, Koninklijke Ahold Delhaize N.V., Fresh Direct, LLC, mySupermarket Limited, NetGrocer.com, Inc., Walmart Stores, Inc., Safeway, Inc., Supermarket Grocery Supplies Pvt. Ltd., ShopFoodEx, Schwan Food Company, and My Brands Inc.

AmazonFresh, a subsidiary of the e-commerce behemoth Amazon, is largely preferred by customers for its ease of access. Recently, it introduced AmazonFresh Pickup, which allows consumers to pick up groceries from a location of their choice.

Online / E-grocery Market Trends:

Ø  Voice Ordering and Assistant Technology

Automation experts in the industry have predicted a paramount shift from text based searches to voice-based online searches. This will introduce personalization in e-grocery shopping experience as customers might feel that it is equivalent to physically going out and shopping.

Ø  Customizable Delivery Options

Since e-grocery shopping is mostly solicited by the working class, there are frequent times when they might not be available at home to receive the products. Prominent market players such as Amazon have started customizable delivery options in which customers can choose whether they want groceries delivered to them in person, at their doorstep, or personally collected from a pre-decided location.

Online / E-grocery Market Research Scope

The base year of the study is 2018, with forecast done up to 2025. The study presents a thorough analysis of the competitive landscape, taking into account the market shares of the leading companies. It also provides information on unit shipments. These provide the key market participants with the necessary business intelligence and help them understand the future of the E-grocery Market. The assessment includes the forecast, an overview of the competitive structure, the market shares of the competitors, as well as the market trends, market demands, market drivers, market challenges, and product analysis. The market drivers and restraints have been assessed to fathom their impact over the forecast period. This report further identifies the key opportunities for growth while also detailing the key challenges and possible threats. The key areas of focus include the types of segments in the E-grocery Market, and their specific applications in different areas.

Online / E-grocery Market Report: Industry Coverage

The E-grocery market can be segmented based on product type and demography. On the basis of product type, the market can be sub-segmented into food products and beverage, beverages, cosmetics and personal care, baby care, stationery, and household goods. Based on demography, the market can be categorized into age and gender.

The Online / E-grocery Market report also analyzes the major geographic regions for the market as well as the major countries for the market in these regions. The regions and countries covered in the study include:

•           North America: The U.S., Canada, Mexico

•           South America: Brazil, Venezuela, Argentina, Ecuador, Peru, Colombia, Costa Rica

•           Europe: The U.K., Germany, Italy, France, The Netherlands, Belgium, Spain, Denmark

•           APAC: China, Japan, Australia, South Korea, India, Taiwan, Malaysia, Hong Kong

•           Middle East and Africa: Israel, South Africa, Saudi Arabia

For more Food and Beverages related reports, please click here

1. Global Online / E-Grocery Market Overview
2. Global Online / E-Grocery Market - Executive Summary
3. Global Online / E-Grocery Market Landscape
   3.1. Market Share Analysis
   3.2. Comparative Analysis
      3.2.1. Product Benchmarking
      3.2.2. End User Profiling
      3.2.3. Patent Analysis
      3.2.4. Top 5 Financial Analysis
4. Global Online / E-Grocery Market Forces
   4.1. Market Drivers
   4.2. Market Constraints
   4.3. Market Challenges
   4.4. Market Opportunities
   4.5. Industry Attractiveness
      4.5.1. Power of Suppliers
      4.5.2. Power of Buyers
      4.5.3. Threat of New Entrants
      4.5.4. Threat of Substitution
      4.5.5. Degree of Competition
5. Global Online / E- Grocery Market – Strategic Analysis
   5.1. Value Chain Analysis
   5.2. Pricing Analysis
   5.3. Opportunity Analysis
   5.4. Product Life Cycle Analysis
   5.5. Suppliers and Distributors
6. Global Online / E-Grocery Market– By Product Type
   6.1. Food  Products
      6.1.1. Fruits and Vegetables
      6.1.2. Dairy Products
      6.1.3. Staples
      6.1.4. Bakery and Confectionery
      6.1.5. Meat and Seafood
      6.1.6. Frozen Food
      6.1.7. Others
   6.2. Beverages
      6.2.1. Alcoholic Drinks
      6.2.2. Non-alcoholic Drinks
   6.3. Cosmetics and Personal Care
   6.4. Baby Care
   6.5. Stationery
   6.6. Households
   6.7. Others
7. Global Online / E-Grocery Market – By Geography
   7.1. North America
      7.1.1. U.S.
      7.1.2. Canada
      7.1.3. Mexico
   7.2. Europe
      7.2.1. U.K.
      7.2.2. Germany
      7.2.3. Italy
      7.2.4. The Netherlands
      7.2.5. France
      7.2.6. Rest of Europe
   7.3. Asia-Pacific
      7.3.1. China
      7.3.2. South Korea
      7.3.3. India
      7.3.4. Japan
      7.3.5. Australia & New Zealand
      7.3.6. Rest of APAC
   7.4. RoW
      7.4.1. South America
      7.4.2. Africa
      7.4.3. Middle East
8. Global Online / E-Grocery Market Entropy
9. Company Profiles
   9.1. Company 1
   9.2. Company 2
   9.3. Company 3
   9.4. Company 4
   9.5. Company 5
   9.6. Company 6
   9.7. Company 7
   9.8. Company 8
   9.9. Company 9
   9.10. Company 10
*More than 10 Companies are profiled in this Research Report*
"*Financials would be provided on a best efforts basis for private companies"
10. Appendix

   10.1. Abbreviations
   10.2. Sources
   10.3. Research Methodology
   10.4. Expert Insights
List of Tables 

Table 1: Online / E-Grocery Market Overview 2021-2026
Table 2: Online / E-Grocery Market Leader Analysis 2018-2019 (US$)
Table 3: Online / E-Grocery Market Product Analysis 2018-2019 (US$)
Table 4: Online / E-Grocery Market End User Analysis 2018-2019 (US$)
Table 5: Online / E-Grocery Market Patent Analysis 2013-2018* (US$)
Table 6: Online / E-Grocery Market Financial Analysis 2018-2019 (US$)
Table 7: Online / E-Grocery Market Driver Analysis 2018-2019 (US$)
Table 8: Online / E-Grocery Market Challenges Analysis 2018-2019 (US$)
Table 9: Online / E-Grocery Market Constraint Analysis 2018-2019 (US$)
Table 10: Online / E-Grocery Market Supplier Bargaining Power Analysis 2018-2019 (US$)
Table 11: Online / E-Grocery Market Buyer Bargaining Power Analysis 2018-2019 (US$)
Table 12: Online / E-Grocery Market Threat of Substitutes Analysis 2018-2019 (US$)
Table 13: Online / E-Grocery Market Threat of New Entrants Analysis 2018-2019 (US$)
Table 14: Online / E-Grocery Market Degree of Competition Analysis 2018-2019 (US$)
Table 15: Online / E-Grocery Market Value Chain Analysis 2018-2019 (US$)
Table 16: Online / E-Grocery Market Pricing Analysis 2021-2026 (US$)
Table 17: Online / E-Grocery Market Opportunities Analysis 2021-2026 (US$)
Table 18: Online / E-Grocery Market Product Life Cycle Analysis 2021-2026 (US$)
Table 19: Online / E-Grocery Market Supplier Analysis 2018-2019 (US$)
Table 20: Online / E-Grocery Market Distributor Analysis 2018-2019 (US$)
Table 21: Online / E-Grocery Market Trend Analysis 2018-2019 (US$)
Table 22: Online / E-Grocery Market Size 2018 (US$)
Table 23: Online / E-Grocery Market Forecast Analysis 2021-2026 (US$)
Table 24: Online / E-Grocery Market Sales Forecast Analysis 2021-2026 (Units)
Table 25: Top Companies 2018 (US$)Online / E-Grocery Market, Revenue & Volume
Table 26: Product Launch 2018-2019Online / E-Grocery Market, Revenue & Volume
Table 27: Mergers & Acquistions 2018-2019Online / E-Grocery Market, Revenue & Volume


List of Figures 

Figure 1: Overview of Online / E-Grocery Market 2021-2026
Figure 2: Market Share Analysis for Online / E-Grocery Market 2018 (US$)
Figure 3: Product Comparison in Online / E-Grocery Market 2018-2019 (US$)
Figure 4: End User Profile for Online / E-Grocery Market 2018-2019 (US$)
Figure 5: Patent Application and Grant in Online / E-Grocery Market 2013-2018* (US$)
Figure 6: Top 5 Companies Financial Analysis in Online / E-Grocery Market 2018-2019 (US$)
Figure 7: Market Entry Strategy in Online / E-Grocery Market 2018-2019
Figure 8: Ecosystem Analysis in Online / E-Grocery Market 2018
Figure 9: Average Selling Price in Online / E-Grocery Market 2021-2026
Figure 10: Top Opportunites in Online / E-Grocery Market 2018-2019
Figure 11: Market Life Cycle Analysis in Online / E-Grocery Market 
Figure 12: Global Online / E-Grocery Market - By Geography
Figure 13: Global Online / E-Grocery Market Value & Volume, By Geography, 2021-2026 ($) 
Figure 14: Global Online / E-Grocery Market CAGR, By Geography, 2021-2026 (%)
Figure 15: North America Online / E-Grocery Market Value & Volume, 2021-2026 ($)
Figure 16: US Online / E-Grocery Market Value & Volume, 2021-2026 ($)
Figure 17: US GDP and Population, 2018-2019 ($)
Figure 18: US GDP – Composition of 2018, By Sector of Origin
Figure 19: US Export and Import Value & Volume, 2018-2019 ($)
Figure 20: Canada Online / E-Grocery Market Value & Volume, 2021-2026 ($)
Figure 21: Canada GDP and Population, 2018-2019 ($)
Figure 22: Canada GDP – Composition of 2018, By Sector of Origin
Figure 23: Canada Export and Import Value & Volume, 2018-2019 ($)
Figure 24: Mexico Online / E-Grocery Market Value & Volume, 2021-2026 ($)
Figure 25: Mexico GDP and Population, 2018-2019 ($)
Figure 26: Mexico GDP – Composition of 2018, By Sector of Origin
Figure 27: Mexico Export and Import Value & Volume, 2018-2019 ($)
Figure 28: South America Online / E-Grocery Market Value & Volume, 2021-2026 ($)
Figure 29: Brazil Online / E-Grocery Market Value & Volume, 2021-2026 ($)
Figure 30: Brazil GDP and Population, 2018-2019 ($)
Figure 31: Brazil GDP – Composition of 2018, By Sector of Origin
Figure 32: Brazil Export and Import Value & Volume, 2018-2019 ($)
Figure 33: Venezuela Online / E-Grocery Market Value & Volume, 2021-2026 ($)
Figure 34: Venezuela GDP and Population, 2018-2019 ($)
Figure 35: Venezuela GDP – Composition of 2018, By Sector of Origin
Figure 36: Venezuela Export and Import Value & Volume, 2018-2019 ($)
Figure 37: Argentina Online / E-Grocery Market Value & Volume, 2021-2026 ($)
Figure 38: Argentina GDP and Population, 2018-2019 ($)
Figure 39: Argentina GDP – Composition of 2018, By Sector of Origin
Figure 40: Argentina Export and Import Value & Volume, 2018-2019 ($)
Figure 41: Ecuador Online / E-Grocery Market Value & Volume, 2021-2026 ($)
Figure 42: Ecuador GDP and Population, 2018-2019 ($)
Figure 43: Ecuador GDP – Composition of 2018, By Sector of Origin
Figure 44: Ecuador Export and Import Value & Volume, 2018-2019 ($)
Figure 45: Peru Online / E-Grocery Market Value & Volume, 2021-2026 ($)
Figure 46: Peru GDP and Population, 2018-2019 ($)
Figure 47: Peru GDP – Composition of 2018, By Sector of Origin
Figure 48: Peru Export and Import Value & Volume, 2018-2019 ($)
Figure 49: Colombia Online / E-Grocery Market Value & Volume, 2021-2026 ($)
Figure 50: Colombia GDP and Population, 2018-2019 ($)
Figure 51: Colombia GDP – Composition of 2018, By Sector of Origin
Figure 52: Colombia Export and Import Value & Volume, 2018-2019 ($)
Figure 53: Costa Rica Online / E-Grocery Market Value & Volume, 2021-2026 ($)
Figure 54: Costa Rica GDP and Population, 2018-2019 ($)
Figure 55: Costa Rica GDP – Composition of 2018, By Sector of Origin
Figure 56: Costa Rica Export and Import Value & Volume, 2018-2019 ($)
Figure 57: Europe Online / E-Grocery Market Value & Volume, 2021-2026 ($)
Figure 58: U.K Online / E-Grocery Market Value & Volume, 2021-2026 ($)
Figure 59: U.K GDP and Population, 2018-2019 ($)
Figure 60: U.K GDP – Composition of 2018, By Sector of Origin
Figure 61: U.K Export and Import Value & Volume, 2018-2019 ($)
Figure 62: Germany Online / E-Grocery Market Value & Volume, 2021-2026 ($)
Figure 63: Germany GDP and Population, 2018-2019 ($)
Figure 64: Germany GDP – Composition of 2018, By Sector of Origin
Figure 65: Germany Export and Import Value & Volume, 2018-2019 ($)
Figure 66: Italy Online / E-Grocery Market Value & Volume, 2021-2026 ($)
Figure 67: Italy GDP and Population, 2018-2019 ($)
Figure 68: Italy GDP – Composition of 2018, By Sector of Origin
Figure 69: Italy Export and Import Value & Volume, 2018-2019 ($)
Figure 70: France Online / E-Grocery Market Value & Volume, 2021-2026 ($)
Figure 71: France GDP and Population, 2018-2019 ($)
Figure 72: France GDP – Composition of 2018, By Sector of Origin
Figure 73: France Export and Import Value & Volume, 2018-2019 ($)
Figure 74: Netherlands Online / E-Grocery Market Value & Volume, 2021-2026 ($)
Figure 75: Netherlands GDP and Population, 2018-2019 ($)
Figure 76: Netherlands GDP – Composition of 2018, By Sector of Origin
Figure 77: Netherlands Export and Import Value & Volume, 2018-2019 ($)
Figure 78: Belgium Online / E-Grocery Market Value & Volume, 2021-2026 ($)
Figure 79: Belgium GDP and Population, 2018-2019 ($)
Figure 80: Belgium GDP – Composition of 2018, By Sector of Origin
Figure 81: Belgium Export and Import Value & Volume, 2018-2019 ($)
Figure 82: Spain Online / E-Grocery Market Value & Volume, 2021-2026 ($)
Figure 83: Spain GDP and Population, 2018-2019 ($)
Figure 84: Spain GDP – Composition of 2018, By Sector of Origin
Figure 85: Spain Export and Import Value & Volume, 2018-2019 ($)
Figure 86: Denmark Online / E-Grocery Market Value & Volume, 2021-2026 ($)
Figure 87: Denmark GDP and Population, 2018-2019 ($)
Figure 88: Denmark GDP – Composition of 2018, By Sector of Origin
Figure 89: Denmark Export and Import Value & Volume, 2018-2019 ($)
Figure 90: APAC Online / E-Grocery Market Value & Volume, 2021-2026 ($)
Figure 91: China Online / E-Grocery Market Value & Volume, 2021-2026
Figure 92: China GDP and Population, 2018-2019 ($)
Figure 93: China GDP – Composition of 2018, By Sector of Origin
Figure 94: China Export and Import Value & Volume, 2018-2019 ($)Online / E-Grocery Market China Export and Import Value & Volume, 2018-2019 ($)
Figure 95: Australia Online / E-Grocery Market Value & Volume, 2021-2026 ($)
Figure 96: Australia GDP and Population, 2018-2019 ($)
Figure 97: Australia GDP – Composition of 2018, By Sector of Origin
Figure 98: Australia Export and Import Value & Volume, 2018-2019 ($)
Figure 99: South Korea Online / E-Grocery Market Value & Volume, 2021-2026 ($)
Figure 100: South Korea GDP and Population, 2018-2019 ($)
Figure 101: South Korea GDP – Composition of 2018, By Sector of Origin
Figure 102: South Korea Export and Import Value & Volume, 2018-2019 ($)
Figure 103: India Online / E-Grocery Market Value & Volume, 2021-2026 ($)
Figure 104: India GDP and Population, 2018-2019 ($)
Figure 105: India GDP – Composition of 2018, By Sector of Origin
Figure 106: India Export and Import Value & Volume, 2018-2019 ($)
Figure 107: Taiwan Online / E-Grocery Market Value & Volume, 2021-2026 ($)
Figure 108: Taiwan GDP and Population, 2018-2019 ($)
Figure 109: Taiwan GDP – Composition of 2018, By Sector of Origin
Figure 110: Taiwan Export and Import Value & Volume, 2018-2019 ($)
Figure 111: Malaysia Online / E-Grocery Market Value & Volume, 2021-2026 ($)
Figure 112: Malaysia GDP and Population, 2018-2019 ($)
Figure 113: Malaysia GDP – Composition of 2018, By Sector of Origin
Figure 114: Malaysia Export and Import Value & Volume, 2018-2019 ($)
Figure 115: Hong Kong Online / E-Grocery Market Value & Volume, 2021-2026 ($)
Figure 116: Hong Kong GDP and Population, 2018-2019 ($)
Figure 117: Hong Kong GDP – Composition of 2018, By Sector of Origin
Figure 118: Hong Kong Export and Import Value & Volume, 2018-2019 ($)
Figure 119: Middle East & Africa Online / E-Grocery Market Middle East & Africa 3D Printing Market Value & Volume, 2021-2026 ($)
Figure 120: Russia Online / E-Grocery Market Value & Volume, 2021-2026 ($)
Figure 121: Russia GDP and Population, 2018-2019 ($)
Figure 122: Russia GDP – Composition of 2018, By Sector of Origin
Figure 123: Russia Export and Import Value & Volume, 2018-2019 ($)
Figure 124: Israel Online / E-Grocery Market Value & Volume, 2021-2026 ($)
Figure 125: Israel GDP and Population, 2018-2019 ($)
Figure 126: Israel GDP – Composition of 2018, By Sector of Origin
Figure 127: Israel Export and Import Value & Volume, 2018-2019 ($)
Figure 128: Entropy Share, By Strategies, 2018-2019* (%)Online / E-Grocery Market 
Figure 129: Developments, 2018-2019*Online / E-Grocery Market 
Figure 130: Company 1 Online / E-Grocery Market Net Revenue, By Years, 2018-2019* ($)
Figure 131: Company 1 Online / E-Grocery Market Net Revenue Share, By Business segments, 2018 (%)
Figure 132: Company 1 Online / E-Grocery Market Net Sales Share, By Geography, 2018 (%)
Figure 133: Company 2 Online / E-Grocery Market Net Revenue, By Years, 2018-2019* ($)
Figure 134: Company 2 Online / E-Grocery Market Net Revenue Share, By Business segments, 2018 (%)
Figure 135: Company 2 Online / E-Grocery Market Net Sales Share, By Geography, 2018 (%)
Figure 136: Company 3 Online / E-Grocery Market Net Revenue, By Years, 2018-2019* ($)
Figure 137: Company 3 Online / E-Grocery Market Net Revenue Share, By Business segments, 2018 (%)
Figure 138: Company 3 Online / E-Grocery Market Net Sales Share, By Geography, 2018 (%)
Figure 139: Company 4 Online / E-Grocery Market Net Revenue, By Years, 2018-2019* ($)
Figure 140: Company 4 Online / E-Grocery Market Net Revenue Share, By Business segments, 2018 (%)
Figure 141: Company 4 Online / E-Grocery Market Net Sales Share, By Geography, 2018 (%)
Figure 142: Company 5 Online / E-Grocery Market Net Revenue, By Years, 2018-2019* ($)
Figure 143: Company 5 Online / E-Grocery Market Net Revenue Share, By Business segments, 2018 (%)
Figure 144: Company 5 Online / E-Grocery Market Net Sales Share, By Geography, 2018 (%)
Figure 145: Company 6 Online / E-Grocery Market Net Revenue, By Years, 2018-2019* ($)
Figure 146: Company 6 Online / E-Grocery Market Net Revenue Share, By Business segments, 2018 (%)
Figure 147: Company 6 Online / E-Grocery Market Net Sales Share, By Geography, 2018 (%)
Figure 148: Company 7 Online / E-Grocery Market Net Revenue, By Years, 2018-2019* ($)
Figure 149: Company 7 Online / E-Grocery Market Net Revenue Share, By Business segments, 2018 (%)
Figure 150: Company 7 Online / E-Grocery Market Net Sales Share, By Geography, 2018 (%)
Figure 151: Company 8 Online / E-Grocery Market Net Revenue, By Years, 2018-2019* ($)
Figure 152: Company 8 Online / E-Grocery Market Net Revenue Share, By Business segments, 2018 (%)
Figure 153: Company 8 Online / E-Grocery Market Net Sales Share, By Geography, 2018 (%)
Figure 154: Company 9 Online / E-Grocery Market Net Revenue, By Years, 2018-2019* ($)
Figure 155: Company 9 Online / E-Grocery Market Net Revenue Share, By Business segments, 2018 (%)
Figure 156: Company 9 Online / E-Grocery Market Net Sales Share, By Geography, 2018 (%)
Figure 157: Company 10 Online / E-Grocery Market Net Revenue, By Years, 2018-2019* ($)
Figure 158: Company 10 Online / E-Grocery Market Net Revenue Share, By Business segments, 2018 (%)
Figure 159: Company 10 Online / E-Grocery Market Net Sales Share, By Geography, 2018 (%)
Figure 160: Company 11 Online / E-Grocery Market Net Revenue, By Years, 2018-2019* ($)
Figure 161: Company 11 Online / E-Grocery Market Net Revenue Share, By Business segments, 2018 (%)
Figure 162: Company 11 Online / E-Grocery Market Net Sales Share, By Geography, 2018 (%)
Figure 163: Company 12 Online / E-Grocery Market Net Revenue, By Years, 2018-2019* ($)
Figure 164: Company 12 Online / E-Grocery Market Net Revenue Share, By Business segments, 2018 (%)
Figure 165: Company 12 Online / E-Grocery Market Net Sales Share, By Geography, 2018 (%)
Figure 166: Company 13 Online / E-Grocery Market Net Revenue, By Years, 2018-2019* ($)
Figure 167: Company 13 Online / E-Grocery Market Net Revenue Share, By Business segments, 2018 (%)
Figure 168: Company 13 Online / E-Grocery Market Net Sales Share, By Geography, 2018 (%)
Figure 169: Company 14 Online / E-Grocery Market Net Revenue, By Years, 2018-2019* ($)
Figure 170: Company 14 Online / E-Grocery Market Net Revenue Share, By Business segments, 2018 (%)
Figure 171: Company 14 Online / E-Grocery Market Net Sales Share, By Geography, 2018 (%)
Figure 172: Company 15 Online / E-Grocery Market Net Revenue, By Years, 2018-2019* ($)
Figure 173: Company 15 Online / E-Grocery Market Net Revenue Share, By Business segments, 2018 (%)
Figure 174: Company 15 Online / E-Grocery Market Net Sales Share, By Geography, 2018 (%)