 Email
Email Print
Print


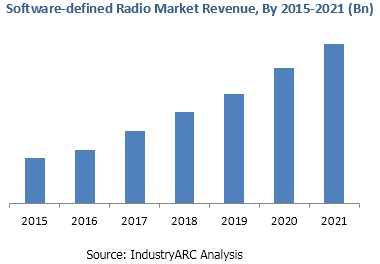
Software-defined Radio Market - Forecast(2024 - 2030)
Software-defined Radio (SDR) is defined as a radio in which some or all the physical layer functions are software defined. SDR technology brings in flexibility, cost efficiency and power to drive communications forward, with wide reaching benefits. The SDR works on the Radio Frequency (RF). SDR technology also provides security and reliability in communication devices for military and civilian applications. The SDR technology will affect the network operators, end users, handset manufacturers and electronic component manufacturers. Various projects like US Joint Tactical Radio System have started to promote Software-defined Radio technology.
The Report ‘Software-defined Radio Market is segmented into three parts, namely: By Components, By End Use Industry and By Geography. In terms of components, the report is segmented into Field Programmable Gate Array (FPGA), Digital Signal Processor (DSP), General Purpose Processor (GPP), Programmable system-on-Chip, Amplifier, Software and few others. The End Use Industry is classified into Military, Aviation, Telecommunications Infrastructure, Transportation, Health Care, Domestic and others. The report was analyzed on the basis of data acquired from the regions like North America, South America, Europe, APAC and Rest of the World.
The Software-defined Radio Market was dominated by the North America in 2015. In North America, The U.S. has the highest share. Europe lies second in the market share. The Asia-Pacific region is the fastest growing region. As more and more countries are opting for SDR communication Systems for their Defense forces. The demand is as such, increasing in almost all parts of the world.
The key players in Software-defined Radio Market are:
The methodology for estimating the market share depended on the type of end users and also on components. The Defense sector has the majority of the share of SDR Market in 2016. Telecommunications Infrastructure also has a high share of the market. The widely used component in SDR technology is FPGA. Simultaneously, the companies involved in Software-defined Radio Market were studied from the perspective of their product portfolio, annual turnover and few other parameters to verify estimations. The data was verified by the industry experts on technical and market levels.
The Report ‘Software-defined Radio Market is segmented into three parts, namely: By Components, By End Use Industry and By Geography. In terms of components, the report is segmented into Field Programmable Gate Array (FPGA), Digital Signal Processor (DSP), General Purpose Processor (GPP), Programmable system-on-Chip, Amplifier, Software and few others. The End Use Industry is classified into Military, Aviation, Telecommunications Infrastructure, Transportation, Health Care, Domestic and others. The report was analyzed on the basis of data acquired from the regions like North America, South America, Europe, APAC and Rest of the World.
The Software-defined Radio Market was dominated by the North America in 2015. In North America, The U.S. has the highest share. Europe lies second in the market share. The Asia-Pacific region is the fastest growing region. As more and more countries are opting for SDR communication Systems for their Defense forces. The demand is as such, increasing in almost all parts of the world.
The key players in Software-defined Radio Market are:
- Rockwell Collins, Inc. (The U.S.)
- Itt Corporation (The U.S.)
- BAE Systems Plc. (U.K)
- Northrop Grumman Corporation (The U.S.)
- Harris Corporation (The U.S.)
- L3 Communication Holdings, Inc. (The U.S.)
- Raytheon Co. (The U.S.)
The methodology for estimating the market share depended on the type of end users and also on components. The Defense sector has the majority of the share of SDR Market in 2016. Telecommunications Infrastructure also has a high share of the market. The widely used component in SDR technology is FPGA. Simultaneously, the companies involved in Software-defined Radio Market were studied from the perspective of their product portfolio, annual turnover and few other parameters to verify estimations. The data was verified by the industry experts on technical and market levels.
1. Software-defined Radio – Market Overview
1.1. Introduction
1.2. Market Scope
1.3. Stakeholders
2. Software-defined Radio - Executive Summary
3. Software-defined Radio – Market Landscape
3.1. Market Share Analysis
3.1.1. Comprehensive Market Share Analysis
3.2. Comparative Analysis
3.2.1. Competitor Benchmarking
3.2.2. Competitor Financial Analysis
3.2.3. Patent Analysis
3.2.4. End-User Profiling
4. Software-defined Radio – Market Forces
4.1. Market Drivers
4.2. Market Constraints
4.3. Market Challenges
4.4. Attractiveness of the Smart Parking Solutions Industry
4.4.1. Power of Suppliers
4.4.2. Power of Customers
4.4.3. Threat of New entrants
4.4.4. Threat of Substitution
4.4.5. Degree of Competition
5. Software-defined Radio – Strategic Analysis
5.1. Value Chain Analysis
5.2. Pricing Analysis
5.2.1. Influencing Factor Analysis
5.2.2. Forecast of Prices
5.3. Opportunities Analysis
5.4. Product/Market Life Cycle Analysis
6. Software-defined Radio – By Components
6.1. Introduction
6.2. Field Programmable Gate Array (FPGA)
6.3. Digital Signal Processor (DSP)
6.4. General Purpose Processor (Gpp)
6.5. Programmable System On Chip
6.6. Amplifier
6.7. Software
6.8. Others
7. Software-defined Radio – By end use industry
7.1. Introduction
7.2. Military
7.3. Aviation
7.4. Telecommunications Infrastructure
7.5. Transportation
7.6. Health Care
7.7. Domestic
7.8. Others
8. Software-defined Radio Market - By Geography
8.1. Introduction
8.2. North America
8.2.1. U.S.
8.2.2. Canada
8.2.3. Others
8.3. South America
8.3.1. Brazil
8.3.2. Others
8.4. Europe
8.4.1. Germany
8.4.2. U.K.
8.4.3. France
8.4.4. Italy
8.4.5. Others
8.5. Asia-Pacific
8.5.1. China
8.5.2. Japan
8.5.3. South Korea
8.5.4. India
8.5.5. Others
8.6. Rest Of the World
8.6.1. Africa
8.6.2. Middle-East
9. Market Entropy
9.1. Introduction
9.2. Product Launches - Most Dominant Strategy
9.3. Mergers, Agreements & Partnerships
9.4. Acquisitions and Others
10. Company Profiles
10.1. BAE Systems Plc
10.2. Datasoft Corporations
10.3. Flexradio Systems Inc.
10.4. Harris Corporation
10.5. Itt Corporation
10.6. L3 Communication Holdings, Inc.
10.7. Northtop Grumman Corporation
10.8. Raytheon Co.
10.9. Rockwell Collins Inc.
10.10. Thales Defense & Security Inc.
10.11. Rohde & Schwarz GmbH & Co. Kg
10.12. Viasat Incorporated
10.13. Saab AB Corporate
10.14. Elbit Systems Ltd.
10.15. Indra Sistemas, S.A.
*More than 40 Companies are profiled in this Research Report, Complete List available on Request*
"*Financials would be provided on a best efforts basis for private companies"
11. Appendix
11.1. Abbreviations
11.2. Sources
11.3. Research Methodology
11.4. Compilation of Expert Insights
11.5. Disclaimer
List of Tables
Table 1: Software Defined Radios Market Overview 2023-2030
Table 2: Software Defined Radios Market Leader Analysis 2023-2030 (US$)
Table 3: Software Defined Radios Market Product Analysis 2023-2030 (US$)
Table 4: Software Defined Radios Market End User Analysis 2023-2030 (US$)
Table 5: Software Defined Radios Market Patent Analysis 2013-2023* (US$)
Table 6: Software Defined Radios Market Financial Analysis 2023-2030 (US$)
Table 7: Software Defined Radios Market Driver Analysis 2023-2030 (US$)
Table 8: Software Defined Radios Market Challenges Analysis 2023-2030 (US$)
Table 9: Software Defined Radios Market Constraint Analysis 2023-2030 (US$)
Table 10: Software Defined Radios Market Supplier Bargaining Power Analysis 2023-2030 (US$)
Table 11: Software Defined Radios Market Buyer Bargaining Power Analysis 2023-2030 (US$)
Table 12: Software Defined Radios Market Threat of Substitutes Analysis 2023-2030 (US$)
Table 13: Software Defined Radios Market Threat of New Entrants Analysis 2023-2030 (US$)
Table 14: Software Defined Radios Market Degree of Competition Analysis 2023-2030 (US$)
Table 15: Software Defined Radios Market Value Chain Analysis 2023-2030 (US$)
Table 16: Software Defined Radios Market Pricing Analysis 2023-2030 (US$)
Table 17: Software Defined Radios Market Opportunities Analysis 2023-2030 (US$)
Table 18: Software Defined Radios Market Product Life Cycle Analysis 2023-2030 (US$)
Table 19: Software Defined Radios Market Supplier Analysis 2023-2030 (US$)
Table 20: Software Defined Radios Market Distributor Analysis 2023-2030 (US$)
Table 21: Software Defined Radios Market Trend Analysis 2023-2030 (US$)
Table 22: Software Defined Radios Market Size 2023 (US$)
Table 23: Software Defined Radios Market Forecast Analysis 2023-2030 (US$)
Table 24: Software Defined Radios Market Sales Forecast Analysis 2023-2030 (Units)
Table 25: Software Defined Radios Market, Revenue & Volume, By Type, 2023-2030 ($)
Table 26: Software Defined Radios Market By Type, Revenue & Volume, By Ideal Software Defined Radio, 2023-2030 ($)
Table 27: Software Defined Radios Market By Type, Revenue & Volume, By Baseband Software Defined Radio (BBSDR), 2023-2030 ($)
Table 28: Software Defined Radios Market By Type, Revenue & Volume, By High Frequency Software Defined Radio (HFSDR), 2023-2030 ($)
Table 29: Software Defined Radios Market, Revenue & Volume, By end –user Industry, 2023-2030 ($)
Table 30: Software Defined Radios Market By end –user Industry, Revenue & Volume, By Defence, 2023-2030 ($)
Table 31: Software Defined Radios Market By end –user Industry, Revenue & Volume, By Commercial, 2023-2030 ($)
Table 32: Software Defined Radios Market By end –user Industry, Revenue & Volume, By Homeland Security Segments, 2023-2030 ($)
Table 33: North America Software Defined Radios Market, Revenue & Volume, By Type, 2023-2030 ($)
Table 34: North America Software Defined Radios Market, Revenue & Volume, By end –user Industry, 2023-2030 ($)
Table 35: South america Software Defined Radios Market, Revenue & Volume, By Type, 2023-2030 ($)
Table 36: South america Software Defined Radios Market, Revenue & Volume, By end –user Industry, 2023-2030 ($)
Table 37: Europe Software Defined Radios Market, Revenue & Volume, By Type, 2023-2030 ($)
Table 38: Europe Software Defined Radios Market, Revenue & Volume, By end –user Industry, 2023-2030 ($)
Table 39: APAC Software Defined Radios Market, Revenue & Volume, By Type, 2023-2030 ($)
Table 40: APAC Software Defined Radios Market, Revenue & Volume, By end –user Industry, 2023-2030 ($)
Table 41: Middle East & Africa Software Defined Radios Market, Revenue & Volume, By Type, 2023-2030 ($)
Table 42: Middle East & Africa Software Defined Radios Market, Revenue & Volume, By end –user Industry, 2023-2030 ($)
Table 43: Russia Software Defined Radios Market, Revenue & Volume, By Type, 2023-2030 ($)
Table 44: Russia Software Defined Radios Market, Revenue & Volume, By end –user Industry, 2023-2030 ($)
Table 45: Israel Software Defined Radios Market, Revenue & Volume, By Type, 2023-2030 ($)
Table 46: Israel Software Defined Radios Market, Revenue & Volume, By end –user Industry, 2023-2030 ($)
Table 47: Top Companies 2023 (US$)Software Defined Radios Market, Revenue & Volume
Table 48: Product Launch 2023-2030Software Defined Radios Market, Revenue & Volume
Table 49: Mergers & Acquistions 2023-2030Software Defined Radios Market, Revenue & Volume
List of Figures
Figure 1: Overview of Software Defined Radios Market 2023-2030
Figure 2: Market Share Analysis for Software Defined Radios Market 2023 (US$)
Figure 3: Product Comparison in Software Defined Radios Market 2023-2030 (US$)
Figure 4: End User Profile for Software Defined Radios Market 2023-2030 (US$)
Figure 5: Patent Application and Grant in Software Defined Radios Market 2013-2023* (US$)
Figure 6: Top 5 Companies Financial Analysis in Software Defined Radios Market 2023-2030 (US$)
Figure 7: Market Entry Strategy in Software Defined Radios Market 2023-2030
Figure 8: Ecosystem Analysis in Software Defined Radios Market 2023
Figure 9: Average Selling Price in Software Defined Radios Market 2023-2030
Figure 10: Top Opportunites in Software Defined Radios Market 2023-2030
Figure 11: Market Life Cycle Analysis in Software Defined Radios Market
Figure 12: GlobalBy TypeSoftware Defined Radios Market Revenue, 2023-2030 ($)
Figure 13: GlobalBy end –user IndustrySoftware Defined Radios Market Revenue, 2023-2030 ($)
Figure 14: Global Software Defined Radios Market - By Geography
Figure 15: Global Software Defined Radios Market Value & Volume, By Geography, 2023-2030 ($)
Figure 16: Global Software Defined Radios Market CAGR, By Geography, 2023-2030 (%)
Figure 17: North America Software Defined Radios Market Value & Volume, 2023-2030 ($)
Figure 18: US Software Defined Radios Market Value & Volume, 2023-2030 ($)
Figure 19: US GDP and Population, 2023-2030 ($)
Figure 20: US GDP – Composition of 2023, By Sector of Origin
Figure 21: US Export and Import Value & Volume, 2023-2030 ($)
Figure 22: Canada Software Defined Radios Market Value & Volume, 2023-2030 ($)
Figure 23: Canada GDP and Population, 2023-2030 ($)
Figure 24: Canada GDP – Composition of 2023, By Sector of Origin
Figure 25: Canada Export and Import Value & Volume, 2023-2030 ($)
Figure 26: Mexico Software Defined Radios Market Value & Volume, 2023-2030 ($)
Figure 27: Mexico GDP and Population, 2023-2030 ($)
Figure 28: Mexico GDP – Composition of 2023, By Sector of Origin
Figure 29: Mexico Export and Import Value & Volume, 2023-2030 ($)
Figure 30: South America Software Defined Radios Market Value & Volume, 2023-2030 ($)
Figure 31: Brazil Software Defined Radios Market Value & Volume, 2023-2030 ($)
Figure 32: Brazil GDP and Population, 2023-2030 ($)
Figure 33: Brazil GDP – Composition of 2023, By Sector of Origin
Figure 34: Brazil Export and Import Value & Volume, 2023-2030 ($)
Figure 35: Venezuela Software Defined Radios Market Value & Volume, 2023-2030 ($)
Figure 36: Venezuela GDP and Population, 2023-2030 ($)
Figure 37: Venezuela GDP – Composition of 2023, By Sector of Origin
Figure 38: Venezuela Export and Import Value & Volume, 2023-2030 ($)
Figure 39: Argentina Software Defined Radios Market Value & Volume, 2023-2030 ($)
Figure 40: Argentina GDP and Population, 2023-2030 ($)
Figure 41: Argentina GDP – Composition of 2023, By Sector of Origin
Figure 42: Argentina Export and Import Value & Volume, 2023-2030 ($)
Figure 43: Ecuador Software Defined Radios Market Value & Volume, 2023-2030 ($)
Figure 44: Ecuador GDP and Population, 2023-2030 ($)
Figure 45: Ecuador GDP – Composition of 2023, By Sector of Origin
Figure 46: Ecuador Export and Import Value & Volume, 2023-2030 ($)
Figure 47: Peru Software Defined Radios Market Value & Volume, 2023-2030 ($)
Figure 48: Peru GDP and Population, 2023-2030 ($)
Figure 49: Peru GDP – Composition of 2023, By Sector of Origin
Figure 50: Peru Export and Import Value & Volume, 2023-2030 ($)
Figure 51: Colombia Software Defined Radios Market Value & Volume, 2023-2030 ($)
Figure 52: Colombia GDP and Population, 2023-2030 ($)
Figure 53: Colombia GDP – Composition of 2023, By Sector of Origin
Figure 54: Colombia Export and Import Value & Volume, 2023-2030 ($)
Figure 55: Costa Rica Software Defined Radios Market Value & Volume, 2023-2030 ($)
Figure 56: Costa Rica GDP and Population, 2023-2030 ($)
Figure 57: Costa Rica GDP – Composition of 2023, By Sector of Origin
Figure 58: Costa Rica Export and Import Value & Volume, 2023-2030 ($)
Figure 59: Europe Software Defined Radios Market Value & Volume, 2023-2030 ($)
Figure 60: U.K Software Defined Radios Market Value & Volume, 2023-2030 ($)
Figure 61: U.K GDP and Population, 2023-2030 ($)
Figure 62: U.K GDP – Composition of 2023, By Sector of Origin
Figure 63: U.K Export and Import Value & Volume, 2023-2030 ($)
Figure 64: Germany Software Defined Radios Market Value & Volume, 2023-2030 ($)
Figure 65: Germany GDP and Population, 2023-2030 ($)
Figure 66: Germany GDP – Composition of 2023, By Sector of Origin
Figure 67: Germany Export and Import Value & Volume, 2023-2030 ($)
Figure 68: Italy Software Defined Radios Market Value & Volume, 2023-2030 ($)
Figure 69: Italy GDP and Population, 2023-2030 ($)
Figure 70: Italy GDP – Composition of 2023, By Sector of Origin
Figure 71: Italy Export and Import Value & Volume, 2023-2030 ($)
Figure 72: France Software Defined Radios Market Value & Volume, 2023-2030 ($)
Figure 73: France GDP and Population, 2023-2030 ($)
Figure 74: France GDP – Composition of 2023, By Sector of Origin
Figure 75: France Export and Import Value & Volume, 2023-2030 ($)
Figure 76: Netherlands Software Defined Radios Market Value & Volume, 2023-2030 ($)
Figure 77: Netherlands GDP and Population, 2023-2030 ($)
Figure 78: Netherlands GDP – Composition of 2023, By Sector of Origin
Figure 79: Netherlands Export and Import Value & Volume, 2023-2030 ($)
Figure 80: Belgium Software Defined Radios Market Value & Volume, 2023-2030 ($)
Figure 81: Belgium GDP and Population, 2023-2030 ($)
Figure 82: Belgium GDP – Composition of 2023, By Sector of Origin
Figure 83: Belgium Export and Import Value & Volume, 2023-2030 ($)
Figure 84: Spain Software Defined Radios Market Value & Volume, 2023-2030 ($)
Figure 85: Spain GDP and Population, 2023-2030 ($)
Figure 86: Spain GDP – Composition of 2023, By Sector of Origin
Figure 87: Spain Export and Import Value & Volume, 2023-2030 ($)
Figure 88: Denmark Software Defined Radios Market Value & Volume, 2023-2030 ($)
Figure 89: Denmark GDP and Population, 2023-2030 ($)
Figure 90: Denmark GDP – Composition of 2023, By Sector of Origin
Figure 91: Denmark Export and Import Value & Volume, 2023-2030 ($)
Figure 92: APAC Software Defined Radios Market Value & Volume, 2023-2030 ($)
Figure 93: China Software Defined Radios Market Value & Volume, 2023-2030
Figure 94: China GDP and Population, 2023-2030 ($)
Figure 95: China GDP – Composition of 2023, By Sector of Origin
Figure 96: China Export and Import Value & Volume, 2023-2030 ($)Software Defined Radios Market China Export and Import Value & Volume, 2023-2030 ($)
Figure 97: Australia Software Defined Radios Market Value & Volume, 2023-2030 ($)
Figure 98: Australia GDP and Population, 2023-2030 ($)
Figure 99: Australia GDP – Composition of 2023, By Sector of Origin
Figure 100: Australia Export and Import Value & Volume, 2023-2030 ($)
Figure 101: South Korea Software Defined Radios Market Value & Volume, 2023-2030 ($)
Figure 102: South Korea GDP and Population, 2023-2030 ($)
Figure 103: South Korea GDP – Composition of 2023, By Sector of Origin
Figure 104: South Korea Export and Import Value & Volume, 2023-2030 ($)
Figure 105: India Software Defined Radios Market Value & Volume, 2023-2030 ($)
Figure 106: India GDP and Population, 2023-2030 ($)
Figure 107: India GDP – Composition of 2023, By Sector of Origin
Figure 108: India Export and Import Value & Volume, 2023-2030 ($)
Figure 109: Taiwan Software Defined Radios Market Value & Volume, 2023-2030 ($)
Figure 110: Taiwan GDP and Population, 2023-2030 ($)
Figure 111: Taiwan GDP – Composition of 2023, By Sector of Origin
Figure 112: Taiwan Export and Import Value & Volume, 2023-2030 ($)
Figure 113: Malaysia Software Defined Radios Market Value & Volume, 2023-2030 ($)
Figure 114: Malaysia GDP and Population, 2023-2030 ($)
Figure 115: Malaysia GDP – Composition of 2023, By Sector of Origin
Figure 116: Malaysia Export and Import Value & Volume, 2023-2030 ($)
Figure 117: Hong Kong Software Defined Radios Market Value & Volume, 2023-2030 ($)
Figure 118: Hong Kong GDP and Population, 2023-2030 ($)
Figure 119: Hong Kong GDP – Composition of 2023, By Sector of Origin
Figure 120: Hong Kong Export and Import Value & Volume, 2023-2030 ($)
Figure 121: Middle East & Africa Software Defined Radios Market Middle East & Africa 3D Printing Market Value & Volume, 2023-2030 ($)
Figure 122: Russia Software Defined Radios Market Value & Volume, 2023-2030 ($)
Figure 123: Russia GDP and Population, 2023-2030 ($)
Figure 124: Russia GDP – Composition of 2023, By Sector of Origin
Figure 125: Russia Export and Import Value & Volume, 2023-2030 ($)
Figure 126: Israel Software Defined Radios Market Value & Volume, 2023-2030 ($)
Figure 127: Israel GDP and Population, 2023-2030 ($)
Figure 128: Israel GDP – Composition of 2023, By Sector of Origin
Figure 129: Israel Export and Import Value & Volume, 2023-2030 ($)
Figure 130: Entropy Share, By Strategies, 2023-2030* (%)Software Defined Radios Market
Figure 131: Developments, 2023-2030*Software Defined Radios Market
Figure 132: Company 1 Software Defined Radios Market Net Revenue, By Years, 2023-2030* ($)
Figure 133: Company 1 Software Defined Radios Market Net Revenue Share, By Business segments, 2023 (%)
Figure 134: Company 1 Software Defined Radios Market Net Sales Share, By Geography, 2023 (%)
Figure 135: Company 2 Software Defined Radios Market Net Revenue, By Years, 2023-2030* ($)
Figure 136: Company 2 Software Defined Radios Market Net Revenue Share, By Business segments, 2023 (%)
Figure 137: Company 2 Software Defined Radios Market Net Sales Share, By Geography, 2023 (%)
Figure 138: Company 3 Software Defined Radios Market Net Revenue, By Years, 2023-2030* ($)
Figure 139: Company 3 Software Defined Radios Market Net Revenue Share, By Business segments, 2023 (%)
Figure 140: Company 3 Software Defined Radios Market Net Sales Share, By Geography, 2023 (%)
Figure 141: Company 4 Software Defined Radios Market Net Revenue, By Years, 2023-2030* ($)
Figure 142: Company 4 Software Defined Radios Market Net Revenue Share, By Business segments, 2023 (%)
Figure 143: Company 4 Software Defined Radios Market Net Sales Share, By Geography, 2023 (%)
Figure 144: Company 5 Software Defined Radios Market Net Revenue, By Years, 2023-2030* ($)
Figure 145: Company 5 Software Defined Radios Market Net Revenue Share, By Business segments, 2023 (%)
Figure 146: Company 5 Software Defined Radios Market Net Sales Share, By Geography, 2023 (%)
Figure 147: Company 6 Software Defined Radios Market Net Revenue, By Years, 2023-2030* ($)
Figure 148: Company 6 Software Defined Radios Market Net Revenue Share, By Business segments, 2023 (%)
Figure 149: Company 6 Software Defined Radios Market Net Sales Share, By Geography, 2023 (%)
Figure 150: Company 7 Software Defined Radios Market Net Revenue, By Years, 2023-2030* ($)
Figure 151: Company 7 Software Defined Radios Market Net Revenue Share, By Business segments, 2023 (%)
Figure 152: Company 7 Software Defined Radios Market Net Sales Share, By Geography, 2023 (%)
Figure 153: Company 8 Software Defined Radios Market Net Revenue, By Years, 2023-2030* ($)
Figure 154: Company 8 Software Defined Radios Market Net Revenue Share, By Business segments, 2023 (%)
Figure 155: Company 8 Software Defined Radios Market Net Sales Share, By Geography, 2023 (%)
Figure 156: Company 9 Software Defined Radios Market Net Revenue, By Years, 2023-2030* ($)
Figure 157: Company 9 Software Defined Radios Market Net Revenue Share, By Business segments, 2023 (%)
Figure 158: Company 9 Software Defined Radios Market Net Sales Share, By Geography, 2023 (%)
Figure 159: Company 10 Software Defined Radios Market Net Revenue, By Years, 2023-2030* ($)
Figure 160: Company 10 Software Defined Radios Market Net Revenue Share, By Business segments, 2023 (%)
Figure 161: Company 10 Software Defined Radios Market Net Sales Share, By Geography, 2023 (%)
Figure 162: Company 11 Software Defined Radios Market Net Revenue, By Years, 2023-2030* ($)
Figure 163: Company 11 Software Defined Radios Market Net Revenue Share, By Business segments, 2023 (%)
Figure 164: Company 11 Software Defined Radios Market Net Sales Share, By Geography, 2023 (%)
Figure 165: Company 12 Software Defined Radios Market Net Revenue, By Years, 2023-2030* ($)
Figure 166: Company 12 Software Defined Radios Market Net Revenue Share, By Business segments, 2023 (%)
Figure 167: Company 12 Software Defined Radios Market Net Sales Share, By Geography, 2023 (%)
Figure 168: Company 13 Software Defined Radios Market Net Revenue, By Years, 2023-2030* ($)
Figure 169: Company 13 Software Defined Radios Market Net Revenue Share, By Business segments, 2023 (%)
Figure 170: Company 13 Software Defined Radios Market Net Sales Share, By Geography, 2023 (%)
Figure 171: Company 14 Software Defined Radios Market Net Revenue, By Years, 2023-2030* ($)
Figure 172: Company 14 Software Defined Radios Market Net Revenue Share, By Business segments, 2023 (%)
Figure 173: Company 14 Software Defined Radios Market Net Sales Share, By Geography, 2023 (%)
Figure 174: Company 15 Software Defined Radios Market Net Revenue, By Years, 2023-2030* ($)
Figure 175: Company 15 Software Defined Radios Market Net Revenue Share, By Business segments, 2023 (%)
Figure 176: Company 15 Software Defined Radios Market Net Sales Share, By Geography, 2023 (%)