 Email
Email Print
Print


Engineering Plastics Market - Forecast(2024 - 2030)
Engineering Plastics Market Overview:
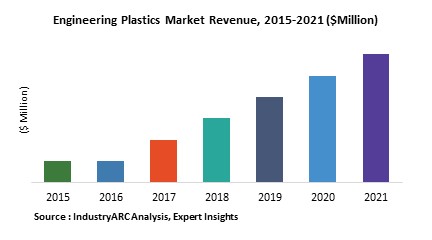
Engineering plastics are performance polymer materials that have better mechanical and thermal properties than the more widely used commodity plastics such as polystyrene, PVC, polypropylene and polyethylene. Owing to its peculiar traits such as stability, flame resilient, chemical resilient, exceptional machinability, dimension constancy, wear resistance, and minimal damaging friction, it has found tremendous scope of applications in various industries including automotive, aerospace, building and construction, mechanical, and medical. Capitalizing on the industrial trend of ‘lightweighting’ engineering plastics have been successfully replacing other engineering materials such as wood and metal and its global market size is valued at around $79716 million as of 2018. The analyst of this business intelligence report has tracked the engineering plastic market to be progressing at a global CAGR of around 6.6% during the forecast period of 2019-2025.
Engineering Plastics Market Outlook:
According to the International Organization of Motor Vehicle Manufacturers, 97.3 million vehicles were produced in 2017, a 2.36% increase compared to 2016[1]. The rapidly revolutionizing automotive sector with determined efforts to match up with the ‘lightweighting’ trend is implementing engineering plastics in several automotive parts. After metal parts, engineering plastics materials dominates the automotive composition materials. As a consequence of this trend, automotive sector is the major employer of engineering plastics market, growing with the application CAGR of around 7.5% going through 2025.
One of the prime reason for the sheer affluence of engineering plastic is its flexible physicality, predominantly missing from competitor engineering materials such as metal and wood. Due to this significant trait it has found tremendous scope of application in the modern era construction dealing with intricate infrastructures. Aesthetically appeasing glass frontages or arched and suspended structures and skyscrapers are filling the modern infrastructural setting, and engineering plastics with its flexibility benefits is augmenting the market demand through its application.
As per the Institute of Civil Engineers report directed by Oxford Economics, the volume of construction production will grow by 85% to $15.5 trillion globally by 2030, with two countries from APAC including China and India and the U.S leading the way and accounting for 57% of all global growth[2]. APAC with is augmenting automotive industry growth rate, India (5.83%), China (3.19%), and Japan (5.31%) as of 2017 and blooming construction sector is leading engineering plastic market with more than 42% of global demand falling under its own frontiers.
Engineering Plastics Market Growth Drivers and Trends:
- One of the major growth driver for the implementation of plastics in industrial operations is the ongoing ‘lightweighing’ trend. With amplified stress on reducing the load of the car, refining fuel efficacy and emissions, engineering plastics are swapping itself with numerous other materials.
- To comply with the similar trends, construction sector is equally preferring plastics for its operations. The construction production is adapting engineering plastic in its routines for a wide range of uses because of its versatility, strength-to-weight ratio, durability, corrosion resistance, and so on. Plastic can be artificial converted into pipes, cables, coverings, panels, films, sheets and so on and are being employed in this sector worldwide.
- Bio-based engineering plastics such as PLA and PHA and PET has found tremendous scope application in packaging, food service ware, bags, and agriculture applications. Owing to the growing demand for bio-based products, numerous vendors are offering bio-based engineering plastics in the market.
- Mitsubishi Chemical, a Japanese market giant, came up with its product DURABIO™, and found a major employer in automotive sector. It is employed as automotive housings interior and exterior décor.
Engineering Plastics Market Players Perspective:
Some of the major companies profiled in this business intelligence report operating in the global engineering plastic market are BASF SE, Solvay S.A., DowDuPont, SABIC, and DSM. BASF SE is offering engineering plastics to support autonomous driving and increase driving comfort. In order to allow automotive manufacturers to achieve the optimum combination of lightweight construction, and vibration damping, BASF is providing noise, vibration, harshness solutions.
Engineering Plastics Market Research Scope:
The base year of the study is 2017, with forecast done up to 2023. The study presents a thorough analysis of the competitive landscape, taking into account the market shares of the leading companies. It also provides information on unit shipments. These provide the key market participants with the necessary business intelligence and help them understand the future of the engineering plastics market. The assessment includes the forecast, an overview of the competitive structure, the market shares of the competitors, as well as the market trends, market demands, market drivers, market challenges, and product analysis. The market drivers and restraints have been assessed to fathom their impact over the forecast period. This report further identifies the key opportunities for growth while also detailing the key challenges and possible threats. The key areas of focus include the types of plastics in the engineering plastics market, and their specific applications in different types of industries.
Engineering Plastics Market Report: Industry Coverage
Types of Engineering Plastic: ABS, PA, PC, POM, PMMA, PEEK, PET, PBT, Cast Nylon
Types of End-User: Aerospace, Building & Construction, Food, Mechanical, Medical, Others
Types of Applications: CD/DVD, Medical implants, advanced batteries, Shoes, others
The Engineering Plastics Market report also analyzes the major geographic regions for the market as well as the major countries for the market in these regions. The regions and countries covered in the study include:
- North America: The U.S., Canada, Mexico
- South America: Brazil, Venezuela, Argentina, Ecuador, Peru, Colombia, Costa Rica
- Europe: The U.K., Germany, Italy, France, The Netherlands, Belgium, Spain, Denmark
- APAC: China, Japan, Australia, South Korea, India, Taiwan, Malaysia, Hong Kong
- Middle East and Africa: Israel, South Africa, Saudi Arabia
Key Questions Addressed in the Engineering Plastics Market Report
1. Is the market for Engineering Plastics growing? How long will it continue to grow and at what rate?
2. Which type of plastic presents the major growth opportunities?
3. Is there a possibility for change in the market structure over time?
4. Are additional developments needed for the existing product or services offerings or do the existing products meet the customer demands?
5. Do the key vendors look for partnerships to expand their businesses with respect to geography or product?
6. What are the short-term, long-term, and medium-term growth drivers for the market?
7. What are the short-term, medium-term, and long-term challenges for the market?
8. What are the short-term, medium-term, and long-term opportunities for the market
9. Who are the top players/companies of the market?
10. What are the recent innovations in the market?
11. How many patents have been filed by the leading players?
12. What are the types of patents filed by the leading players?
13. What is our Vision 2030 for plastics in Engineering Plastics Market?
A few focus points of this Research are given below:
- Give a deep-dive analysis of the key operational strategies with focus on the corporate structure, R&D strategies, localization strategies, production capabilities, and sales performance of various companies
- Provide an overview of the product portfolio, including product planning, development, and positioning
- Discuss the role of technology companies in partnerships
- Explore the regional sales activities
- Analyze the market size and giving the forecast for current and future engineering plastics during the forecast 2018–2023
- Analyze the competitive factors, competitors’ market shares, product capabilities, and supply chain structures
Reference:
[1]https://www.worldsteel.org/steel-by-topic/steel-markets/automotive.html
[2]https://www.ice.org.uk/ICEDevelopmentWebPortal/media/Documents/News/ICE%20News/Global-Construction-press-release.pdf
1. Engineering Plastics Market - Overview
1.1. Definitions and Scope
2. Engineering Plastics Market - Executive summary
2.1. Market Revenue, Market Size and Key Trends by Company
2.2. Key Trends by type of Application
2.3. Key Trends segmented by Geography
3. Engineering Plastics Market
3.1. Comparative analysis
3.1.1. Product Benchmarking - Top 10 companies
3.1.2. Top 5 Financials Analysis
3.1.3. Market Value split by Top 10 companies
3.1.4. Patent Analysis - Top 10 companies
3.1.5. Pricing Analysis
4. Engineering Plastics Market – Startup companies Scenario Premium
4.1. Top 10 startup company Analysis by
4.1.1. Investment
4.1.2. Revenue
4.1.3. Market Shares
4.1.4. Market Size and Application Analysis
4.1.5. Venture Capital and Funding Scenario
5. Engineering Plastics Market – Industry Market Entry Scenario Premium
5.1. Regulatory Framework Overview
5.2. New Business and Ease of Doing business index
5.3. Case studies of successful ventures
5.4. Customer Analysis – Top 10 companies
6. Engineering Plastics Market Forces
6.1. Drivers
6.2. Constraints
6.3. Challenges
6.4. Porters five force model
6.4.1. Bargaining power of suppliers
6.4.2. Bargaining powers of customers
6.4.3. Threat of new entrants
6.4.4. Rivalry among existing players
6.4.5. Threat of substitutes
7. Engineering Plastics Market - Strategic analysis
7.1. Value chain analysis
7.2. Opportunities analysis
7.3. Product life cycle
7.4. Suppliers and distributors Market Share
8. Engineering Plastics Market – By Type (Market Size -$Million / $Billion)
8.1. Market Size and Market Share Analysis
8.2. Application Revenue and Trend Research
8.3. Product Segment Analysis
8.3.1. Introduction
8.3.2. ABS
8.3.3. Acetal
8.3.4. Acrylic
8.3.5. Bakelite
8.3.6. High Performance Materials
8.3.7. Nylon
8.3.8. PETP
8.3.9. Polycarbonate
8.3.10. Polyethylenes (PE)
8.3.11. Polypropylene (PP)
8.3.12. Polyurethane
8.3.13. PTFE
8.3.14. PVC
8.3.15. PEK
8.3.16. PEEK
9. Engineering Plastics Market – By Applications (Market Size -$Million / $Billion)
9.1. Abrasion Resistant Liners
9.2. Acid Trays
9.3. Anti-Corrosive Liners
9.4. Braking Tray Liners
9.5. Bearings
9.6. Bench Top
9.7. Boat Chopping Board
9.8. Boat Windscreen
9.9. Bolts & Nuts
9.10. Bottle Line Wear Plate
9.11. Buffer Pads
9.12. Bushes
9.13. Chain Guide
9.14. Chevron Packing’s
9.15. Conveyor Mechanisms
9.16. Cooling Towers
9.17. Cutting Boards
9.18. Display
9.19. Electrical Insulator
9.20. Exhaust Ducts
9.21. Feedscrolls
9.22. Food Production
9.23. Fume Ducting
9.24. Gaskets
9.25. Gears
9.26. Guards
9.27. Guide Strips
9.28. Guide Wheels
9.29. Heat Seal Surfaces
9.30. High Precision Parts
9.31. Hoppers
9.32. Insulators
9.33. Kicker Arms
9.34. Lantern Rings
9.35. Level Indicators
9.36. Lighting
9.37. Machine Guards
9.38. Metal Detector Chutes
9.39. Nuts and Bolts
9.40. Piston Rings
9.41. Piston Seals and Cups
9.42. Plating Tanks and Hoods
9.43. Pressure Plates
9.44. Pump Components
9.45. Rollers
9.46. Safety Glass and Guards
9.47. Scraper Blades
9.48. Seals
9.49. Security Windows
9.50. Self-Lubricating Parts
9.51. Sightglass
9.52. Skylights
9.53. Slide Bearings
9.54. Slideways
9.55. Terminal Boards
9.56. Thermal Insulators
9.57. Thrust Washers
9.58. Valve Bodies
9.59. Valve Components
9.60. Washer
9.61. Wear Pads
9.62. Wear Plates
9.63. Others
10. Engineering Plastics – By End Use Industry(Market Size -$Million / $Billion)
10.1. Segment type Size and Market Share Analysis
10.2. Application Revenue and Trends by type of Application
10.3. Application Segment Analysis by Type
10.3.1. Introduction
10.3.2. Aerospace
10.3.3. Automotive
10.3.4. Building
10.3.5. Food
10.3.6. Packaging
10.3.7. Mechanical
10.3.8. Medical
10.3.9. Oil & gas
10.3.10. Semiconductor
10.3.11. Construction
10.3.12. Others
11. Engineering Plastics - By Geography (Market Size -$Million / $Billion)
11.1. Engineering Plastics Market - North America Segment Research
11.2. North America Market Research (Million / $Billion)
11.2.1. Segment type Size and Market Size Analysis
11.2.2. Revenue and Trends
11.2.3. Application Revenue and Trends by type of Application
11.2.4. Company Revenue and Product Analysis
11.2.5. North America Product type and Application Market Size
11.2.5.1. U.S.
11.2.5.2. Canada
11.2.5.3. Mexico
11.2.5.4. Rest of North America
11.3. Engineering Plastics - South America Segment Research
11.4. South America Market Research (Market Size -$Million / $Billion)
11.4.1. Segment type Size and Market Size Analysis
11.4.2. Revenue and Trends
11.4.3. Application Revenue and Trends by type of Application
11.4.4. Company Revenue and Product Analysis
11.4.5. South America Product type and Application Market Size
11.4.5.1. Brazil
11.4.5.2. Venezuela
11.4.5.3. Argentina
11.4.5.4. Ecuador
11.4.5.5. Peru
11.4.5.6. Colombia
11.4.5.7. Costa Rica
11.4.5.8. Rest of South America
11.5. Engineering Plastics - Europe Segment Research
11.6. Europe Market Research (Market Size -$Million / $Billion)
11.6.1. Segment type Size and Market Size Analysis
11.6.2. Revenue and Trends
11.6.3. Application Revenue and Trends by type of Application
11.6.4. Company Revenue and Product Analysis
11.6.5. Europe Segment Product type and Application Market Size
11.6.5.1. U.K
11.6.5.2. Germany
11.6.5.3. Italy
11.6.5.4. France
11.6.5.5. Netherlands
11.6.5.6. Belgium
11.6.5.7. Spain
11.6.5.8. Denmark
11.6.5.9. Rest of Europe
11.7. Engineering Plastics – APAC Segment Research
11.8. APAC Market Research (Market Size -$Million / $Billion)
11.8.1. Segment type Size and Market Size Analysis
11.8.2. Revenue and Trends
11.8.3. Application Revenue and Trends by type of Application
11.8.4. Company Revenue and Product Analysis
11.8.5. APAC Segment – Product type and Application Market Size
11.8.5.1. China
11.8.5.2. Australia
11.8.5.3. Japan
11.8.5.4. South Korea
11.8.5.5. India
11.8.5.6. Taiwan
11.8.5.7. Malaysia
12. Engineering Plastics Market - Entropy
12.1. New product launches
12.2. M&A's, collaborations, JVs and partnerships
13. Engineering Plastics Market – Industry / Segment Competition landscape Premium
13.1. Market Share Analysis
13.1.1. Market Share by Country- Top companies
13.1.2. Market Share by Region- Top 10 companies
13.1.3. Market Share by type of Application – Top 10 companies
13.1.4. Market Share by type of Product / Product category- Top 10 companies
13.1.5. Market Share at global level- Top 10 companies
13.1.6. Best Practises for companies
14. Engineering Plastics Market – Key Company List by Country Premium
15. Engineering Plastics Market Company Analysis
15.1. Market Share, Company Revenue, Products, M&A, Developments
15.2. BASF SE
15.3. Covestro
15.4. Solvay S.A
15.5. Celanese corporation
15.6. DuPont
15.7. LG chemical industry
15.8. Evonik industry AG
15.9. Lanxess AG
15.10. Company 9
15.11. Company 10
15.12. Company 11 and more
"*Financials would be provided on a best efforts basis for private companies"
16. Engineering Plastics Market - Appendix
16.1. Abbreviations
16.2. Sources
17. Engineering Plastics Market - Methodology
17.1. Research Methodology
17.1.1. Company Expert Interviews
17.1.2. Industry Databases
17.1.3. Associations
17.1.4. Company News
17.1.5. Company Annual Reports
17.1.6. Application Trends
17.1.7. New Products and Product database
17.1.8. Company Transcripts
17.1.9. R&D Trends
17.1.10. Key Opinion Leaders Interviews
17.1.11. Supply and Demand Trends
List of Tables
Table 1: Engineering Plastics Market Overview 2023-2030
Table 2: Engineering Plastics Market Leader Analysis 2023-2030 (US$)
Table 3: Engineering Plastics Market Product Analysis 2023-2030 (US$)
Table 4: Engineering Plastics Market End User Analysis 2023-2030 (US$)
Table 5: Engineering Plastics Market Patent Analysis 2013-2023* (US$)
Table 6: Engineering Plastics Market Financial Analysis 2023-2030 (US$)
Table 7: Engineering Plastics Market Driver Analysis 2023-2030 (US$)
Table 8: Engineering Plastics Market Challenges Analysis 2023-2030 (US$)
Table 9: Engineering Plastics Market Constraint Analysis 2023-2030 (US$)
Table 10: Engineering Plastics Market Supplier Bargaining Power Analysis 2023-2030 (US$)
Table 11: Engineering Plastics Market Buyer Bargaining Power Analysis 2023-2030 (US$)
Table 12: Engineering Plastics Market Threat of Substitutes Analysis 2023-2030 (US$)
Table 13: Engineering Plastics Market Threat of New Entrants Analysis 2023-2030 (US$)
Table 14: Engineering Plastics Market Degree of Competition Analysis 2023-2030 (US$)
Table 15: Engineering Plastics Market Value Chain Analysis 2023-2030 (US$)
Table 16: Engineering Plastics Market Pricing Analysis 2023-2030 (US$)
Table 17: Engineering Plastics Market Opportunities Analysis 2023-2030 (US$)
Table 18: Engineering Plastics Market Product Life Cycle Analysis 2023-2030 (US$)
Table 19: Engineering Plastics Market Supplier Analysis 2023-2030 (US$)
Table 20: Engineering Plastics Market Distributor Analysis 2023-2030 (US$)
Table 21: Engineering Plastics Market Trend Analysis 2023-2030 (US$)
Table 22: Engineering Plastics Market Size 2023 (US$)
Table 23: Engineering Plastics Market Forecast Analysis 2023-2030 (US$)
Table 24: Engineering Plastics Market Sales Forecast Analysis 2023-2030 (Units)
Table 25: Engineering Plastics Market, Revenue & Volume, By Type, 2023-2030 ($)
Table 26: Engineering Plastics Market By Type, Revenue & Volume, By ABS, 2023-2030 ($)
Table 27: Engineering Plastics Market By Type, Revenue & Volume, By Acetal, 2023-2030 ($)
Table 28: Engineering Plastics Market By Type, Revenue & Volume, By Acrylic, 2023-2030 ($)
Table 29: Engineering Plastics Market By Type, Revenue & Volume, By Bakelite, 2023-2030 ($)
Table 30: Engineering Plastics Market By Type, Revenue & Volume, By High Performance Materials, 2023-2030 ($)
Table 31: Engineering Plastics Market, Revenue & Volume, By Applications, 2023-2030 ($)
Table 32: Engineering Plastics Market By Applications, Revenue & Volume, By Abrasion Resistant Liners, 2023-2030 ($)
Table 33: Engineering Plastics Market By Applications, Revenue & Volume, By Acid Trays, 2023-2030 ($)
Table 34: Engineering Plastics Market By Applications, Revenue & Volume, By Anti-Corrosive Liners, 2023-2030 ($)
Table 35: Engineering Plastics Market By Applications, Revenue & Volume, By Braking Tray Liners, 2023-2030 ($)
Table 36: Engineering Plastics Market By Applications, Revenue & Volume, By Bearings, 2023-2030 ($)
Table 37: Engineering Plastics Market, Revenue & Volume, By End User Industry, 2023-2030 ($)
Table 38: Engineering Plastics Market By End User Industry, Revenue & Volume, By Aerospace, 2023-2030 ($)
Table 39: Engineering Plastics Market By End User Industry, Revenue & Volume, By Automotive, 2023-2030 ($)
Table 40: Engineering Plastics Market By End User Industry, Revenue & Volume, By Building, 2023-2030 ($)
Table 41: Engineering Plastics Market By End User Industry, Revenue & Volume, By Food, 2023-2030 ($)
Table 42: Engineering Plastics Market By End User Industry, Revenue & Volume, By Packaging, 2023-2030 ($)
Table 43: North America Engineering Plastics Market, Revenue & Volume, By Type, 2023-2030 ($)
Table 44: North America Engineering Plastics Market, Revenue & Volume, By Applications, 2023-2030 ($)
Table 45: North America Engineering Plastics Market, Revenue & Volume, By End User Industry, 2023-2030 ($)
Table 46: South america Engineering Plastics Market, Revenue & Volume, By Type, 2023-2030 ($)
Table 47: South america Engineering Plastics Market, Revenue & Volume, By Applications, 2023-2030 ($)
Table 48: South america Engineering Plastics Market, Revenue & Volume, By End User Industry, 2023-2030 ($)
Table 49: Europe Engineering Plastics Market, Revenue & Volume, By Type, 2023-2030 ($)
Table 50: Europe Engineering Plastics Market, Revenue & Volume, By Applications, 2023-2030 ($)
Table 51: Europe Engineering Plastics Market, Revenue & Volume, By End User Industry, 2023-2030 ($)
Table 52: APAC Engineering Plastics Market, Revenue & Volume, By Type, 2023-2030 ($)
Table 53: APAC Engineering Plastics Market, Revenue & Volume, By Applications, 2023-2030 ($)
Table 54: APAC Engineering Plastics Market, Revenue & Volume, By End User Industry, 2023-2030 ($)
Table 55: Middle East & Africa Engineering Plastics Market, Revenue & Volume, By Type, 2023-2030 ($)
Table 56: Middle East & Africa Engineering Plastics Market, Revenue & Volume, By Applications, 2023-2030 ($)
Table 57: Middle East & Africa Engineering Plastics Market, Revenue & Volume, By End User Industry, 2023-2030 ($)
Table 58: Russia Engineering Plastics Market, Revenue & Volume, By Type, 2023-2030 ($)
Table 59: Russia Engineering Plastics Market, Revenue & Volume, By Applications, 2023-2030 ($)
Table 60: Russia Engineering Plastics Market, Revenue & Volume, By End User Industry, 2023-2030 ($)
Table 61: Israel Engineering Plastics Market, Revenue & Volume, By Type, 2023-2030 ($)
Table 62: Israel Engineering Plastics Market, Revenue & Volume, By Applications, 2023-2030 ($)
Table 63: Israel Engineering Plastics Market, Revenue & Volume, By End User Industry, 2023-2030 ($)
Table 64: Top Companies 2023 (US$)Engineering Plastics Market, Revenue & Volume
Table 65: Product Launch 2023-2030Engineering Plastics Market, Revenue & Volume
Table 66: Mergers & Acquistions 2023-2030Engineering Plastics Market, Revenue & Volume
List of Figures
Figure 1: Overview of Engineering Plastics Market 2023-2030
Figure 2: Market Share Analysis for Engineering Plastics Market 2023 (US$)
Figure 3: Product Comparison in Engineering Plastics Market 2023-2030 (US$)
Figure 4: End User Profile for Engineering Plastics Market 2023-2030 (US$)
Figure 5: Patent Application and Grant in Engineering Plastics Market 2013-2023* (US$)
Figure 6: Top 5 Companies Financial Analysis in Engineering Plastics Market 2023-2030 (US$)
Figure 7: Market Entry Strategy in Engineering Plastics Market 2023-2030
Figure 8: Ecosystem Analysis in Engineering Plastics Market 2023
Figure 9: Average Selling Price in Engineering Plastics Market 2023-2030
Figure 10: Top Opportunites in Engineering Plastics Market 2023-2030
Figure 11: Market Life Cycle Analysis in Engineering Plastics Market
Figure 12: GlobalBy TypeEngineering Plastics Market Revenue, 2023-2030 ($)
Figure 13: GlobalBy ApplicationsEngineering Plastics Market Revenue, 2023-2030 ($)
Figure 14: GlobalBy End User IndustryEngineering Plastics Market Revenue, 2023-2030 ($)
Figure 15: Global Engineering Plastics Market - By Geography
Figure 16: Global Engineering Plastics Market Value & Volume, By Geography, 2023-2030 ($)
Figure 17: Global Engineering Plastics Market CAGR, By Geography, 2023-2030 (%)
Figure 18: North America Engineering Plastics Market Value & Volume, 2023-2030 ($)
Figure 19: US Engineering Plastics Market Value & Volume, 2023-2030 ($)
Figure 20: US GDP and Population, 2023-2030 ($)
Figure 21: US GDP – Composition of 2023, By Sector of Origin
Figure 22: US Export and Import Value & Volume, 2023-2030 ($)
Figure 23: Canada Engineering Plastics Market Value & Volume, 2023-2030 ($)
Figure 24: Canada GDP and Population, 2023-2030 ($)
Figure 25: Canada GDP – Composition of 2023, By Sector of Origin
Figure 26: Canada Export and Import Value & Volume, 2023-2030 ($)
Figure 27: Mexico Engineering Plastics Market Value & Volume, 2023-2030 ($)
Figure 28: Mexico GDP and Population, 2023-2030 ($)
Figure 29: Mexico GDP – Composition of 2023, By Sector of Origin
Figure 30: Mexico Export and Import Value & Volume, 2023-2030 ($)
Figure 31: South America Engineering Plastics Market Value & Volume, 2023-2030 ($)
Figure 32: Brazil Engineering Plastics Market Value & Volume, 2023-2030 ($)
Figure 33: Brazil GDP and Population, 2023-2030 ($)
Figure 34: Brazil GDP – Composition of 2023, By Sector of Origin
Figure 35: Brazil Export and Import Value & Volume, 2023-2030 ($)
Figure 36: Venezuela Engineering Plastics Market Value & Volume, 2023-2030 ($)
Figure 37: Venezuela GDP and Population, 2023-2030 ($)
Figure 38: Venezuela GDP – Composition of 2023, By Sector of Origin
Figure 39: Venezuela Export and Import Value & Volume, 2023-2030 ($)
Figure 40: Argentina Engineering Plastics Market Value & Volume, 2023-2030 ($)
Figure 41: Argentina GDP and Population, 2023-2030 ($)
Figure 42: Argentina GDP – Composition of 2023, By Sector of Origin
Figure 43: Argentina Export and Import Value & Volume, 2023-2030 ($)
Figure 44: Ecuador Engineering Plastics Market Value & Volume, 2023-2030 ($)
Figure 45: Ecuador GDP and Population, 2023-2030 ($)
Figure 46: Ecuador GDP – Composition of 2023, By Sector of Origin
Figure 47: Ecuador Export and Import Value & Volume, 2023-2030 ($)
Figure 48: Peru Engineering Plastics Market Value & Volume, 2023-2030 ($)
Figure 49: Peru GDP and Population, 2023-2030 ($)
Figure 50: Peru GDP – Composition of 2023, By Sector of Origin
Figure 51: Peru Export and Import Value & Volume, 2023-2030 ($)
Figure 52: Colombia Engineering Plastics Market Value & Volume, 2023-2030 ($)
Figure 53: Colombia GDP and Population, 2023-2030 ($)
Figure 54: Colombia GDP – Composition of 2023, By Sector of Origin
Figure 55: Colombia Export and Import Value & Volume, 2023-2030 ($)
Figure 56: Costa Rica Engineering Plastics Market Value & Volume, 2023-2030 ($)
Figure 57: Costa Rica GDP and Population, 2023-2030 ($)
Figure 58: Costa Rica GDP – Composition of 2023, By Sector of Origin
Figure 59: Costa Rica Export and Import Value & Volume, 2023-2030 ($)
Figure 60: Europe Engineering Plastics Market Value & Volume, 2023-2030 ($)
Figure 61: U.K Engineering Plastics Market Value & Volume, 2023-2030 ($)
Figure 62: U.K GDP and Population, 2023-2030 ($)
Figure 63: U.K GDP – Composition of 2023, By Sector of Origin
Figure 64: U.K Export and Import Value & Volume, 2023-2030 ($)
Figure 65: Germany Engineering Plastics Market Value & Volume, 2023-2030 ($)
Figure 66: Germany GDP and Population, 2023-2030 ($)
Figure 67: Germany GDP – Composition of 2023, By Sector of Origin
Figure 68: Germany Export and Import Value & Volume, 2023-2030 ($)
Figure 69: Italy Engineering Plastics Market Value & Volume, 2023-2030 ($)
Figure 70: Italy GDP and Population, 2023-2030 ($)
Figure 71: Italy GDP – Composition of 2023, By Sector of Origin
Figure 72: Italy Export and Import Value & Volume, 2023-2030 ($)
Figure 73: France Engineering Plastics Market Value & Volume, 2023-2030 ($)
Figure 74: France GDP and Population, 2023-2030 ($)
Figure 75: France GDP – Composition of 2023, By Sector of Origin
Figure 76: France Export and Import Value & Volume, 2023-2030 ($)
Figure 77: Netherlands Engineering Plastics Market Value & Volume, 2023-2030 ($)
Figure 78: Netherlands GDP and Population, 2023-2030 ($)
Figure 79: Netherlands GDP – Composition of 2023, By Sector of Origin
Figure 80: Netherlands Export and Import Value & Volume, 2023-2030 ($)
Figure 81: Belgium Engineering Plastics Market Value & Volume, 2023-2030 ($)
Figure 82: Belgium GDP and Population, 2023-2030 ($)
Figure 83: Belgium GDP – Composition of 2023, By Sector of Origin
Figure 84: Belgium Export and Import Value & Volume, 2023-2030 ($)
Figure 85: Spain Engineering Plastics Market Value & Volume, 2023-2030 ($)
Figure 86: Spain GDP and Population, 2023-2030 ($)
Figure 87: Spain GDP – Composition of 2023, By Sector of Origin
Figure 88: Spain Export and Import Value & Volume, 2023-2030 ($)
Figure 89: Denmark Engineering Plastics Market Value & Volume, 2023-2030 ($)
Figure 90: Denmark GDP and Population, 2023-2030 ($)
Figure 91: Denmark GDP – Composition of 2023, By Sector of Origin
Figure 92: Denmark Export and Import Value & Volume, 2023-2030 ($)
Figure 93: APAC Engineering Plastics Market Value & Volume, 2023-2030 ($)
Figure 94: China Engineering Plastics Market Value & Volume, 2023-2030
Figure 95: China GDP and Population, 2023-2030 ($)
Figure 96: China GDP – Composition of 2023, By Sector of Origin
Figure 97: China Export and Import Value & Volume, 2023-2030 ($)Engineering Plastics Market China Export and Import Value & Volume, 2023-2030 ($)
Figure 98: Australia Engineering Plastics Market Value & Volume, 2023-2030 ($)
Figure 99: Australia GDP and Population, 2023-2030 ($)
Figure 100: Australia GDP – Composition of 2023, By Sector of Origin
Figure 101: Australia Export and Import Value & Volume, 2023-2030 ($)
Figure 102: South Korea Engineering Plastics Market Value & Volume, 2023-2030 ($)
Figure 103: South Korea GDP and Population, 2023-2030 ($)
Figure 104: South Korea GDP – Composition of 2023, By Sector of Origin
Figure 105: South Korea Export and Import Value & Volume, 2023-2030 ($)
Figure 106: India Engineering Plastics Market Value & Volume, 2023-2030 ($)
Figure 107: India GDP and Population, 2023-2030 ($)
Figure 108: India GDP – Composition of 2023, By Sector of Origin
Figure 109: India Export and Import Value & Volume, 2023-2030 ($)
Figure 110: Taiwan Engineering Plastics Market Value & Volume, 2023-2030 ($)
Figure 111: Taiwan GDP and Population, 2023-2030 ($)
Figure 112: Taiwan GDP – Composition of 2023, By Sector of Origin
Figure 113: Taiwan Export and Import Value & Volume, 2023-2030 ($)
Figure 114: Malaysia Engineering Plastics Market Value & Volume, 2023-2030 ($)
Figure 115: Malaysia GDP and Population, 2023-2030 ($)
Figure 116: Malaysia GDP – Composition of 2023, By Sector of Origin
Figure 117: Malaysia Export and Import Value & Volume, 2023-2030 ($)
Figure 118: Hong Kong Engineering Plastics Market Value & Volume, 2023-2030 ($)
Figure 119: Hong Kong GDP and Population, 2023-2030 ($)
Figure 120: Hong Kong GDP – Composition of 2023, By Sector of Origin
Figure 121: Hong Kong Export and Import Value & Volume, 2023-2030 ($)
Figure 122: Middle East & Africa Engineering Plastics Market Middle East & Africa 3D Printing Market Value & Volume, 2023-2030 ($)
Figure 123: Russia Engineering Plastics Market Value & Volume, 2023-2030 ($)
Figure 124: Russia GDP and Population, 2023-2030 ($)
Figure 125: Russia GDP – Composition of 2023, By Sector of Origin
Figure 126: Russia Export and Import Value & Volume, 2023-2030 ($)
Figure 127: Israel Engineering Plastics Market Value & Volume, 2023-2030 ($)
Figure 128: Israel GDP and Population, 2023-2030 ($)
Figure 129: Israel GDP – Composition of 2023, By Sector of Origin
Figure 130: Israel Export and Import Value & Volume, 2023-2030 ($)
Figure 131: Entropy Share, By Strategies, 2023-2030* (%)Engineering Plastics Market
Figure 132: Developments, 2023-2030*Engineering Plastics Market
Figure 133: Company 1 Engineering Plastics Market Net Revenue, By Years, 2023-2030* ($)
Figure 134: Company 1 Engineering Plastics Market Net Revenue Share, By Business segments, 2023 (%)
Figure 135: Company 1 Engineering Plastics Market Net Sales Share, By Geography, 2023 (%)
Figure 136: Company 2 Engineering Plastics Market Net Revenue, By Years, 2023-2030* ($)
Figure 137: Company 2 Engineering Plastics Market Net Revenue Share, By Business segments, 2023 (%)
Figure 138: Company 2 Engineering Plastics Market Net Sales Share, By Geography, 2023 (%)
Figure 139: Company 3 Engineering Plastics Market Net Revenue, By Years, 2023-2030* ($)
Figure 140: Company 3 Engineering Plastics Market Net Revenue Share, By Business segments, 2023 (%)
Figure 141: Company 3 Engineering Plastics Market Net Sales Share, By Geography, 2023 (%)
Figure 142: Company 4 Engineering Plastics Market Net Revenue, By Years, 2023-2030* ($)
Figure 143: Company 4 Engineering Plastics Market Net Revenue Share, By Business segments, 2023 (%)
Figure 144: Company 4 Engineering Plastics Market Net Sales Share, By Geography, 2023 (%)
Figure 145: Company 5 Engineering Plastics Market Net Revenue, By Years, 2023-2030* ($)
Figure 146: Company 5 Engineering Plastics Market Net Revenue Share, By Business segments, 2023 (%)
Figure 147: Company 5 Engineering Plastics Market Net Sales Share, By Geography, 2023 (%)
Figure 148: Company 6 Engineering Plastics Market Net Revenue, By Years, 2023-2030* ($)
Figure 149: Company 6 Engineering Plastics Market Net Revenue Share, By Business segments, 2023 (%)
Figure 150: Company 6 Engineering Plastics Market Net Sales Share, By Geography, 2023 (%)
Figure 151: Company 7 Engineering Plastics Market Net Revenue, By Years, 2023-2030* ($)
Figure 152: Company 7 Engineering Plastics Market Net Revenue Share, By Business segments, 2023 (%)
Figure 153: Company 7 Engineering Plastics Market Net Sales Share, By Geography, 2023 (%)
Figure 154: Company 8 Engineering Plastics Market Net Revenue, By Years, 2023-2030* ($)
Figure 155: Company 8 Engineering Plastics Market Net Revenue Share, By Business segments, 2023 (%)
Figure 156: Company 8 Engineering Plastics Market Net Sales Share, By Geography, 2023 (%)
Figure 157: Company 9 Engineering Plastics Market Net Revenue, By Years, 2023-2030* ($)
Figure 158: Company 9 Engineering Plastics Market Net Revenue Share, By Business segments, 2023 (%)
Figure 159: Company 9 Engineering Plastics Market Net Sales Share, By Geography, 2023 (%)
Figure 160: Company 10 Engineering Plastics Market Net Revenue, By Years, 2023-2030* ($)
Figure 161: Company 10 Engineering Plastics Market Net Revenue Share, By Business segments, 2023 (%)
Figure 162: Company 10 Engineering Plastics Market Net Sales Share, By Geography, 2023 (%)
Figure 163: Company 11 Engineering Plastics Market Net Revenue, By Years, 2023-2030* ($)
Figure 164: Company 11 Engineering Plastics Market Net Revenue Share, By Business segments, 2023 (%)
Figure 165: Company 11 Engineering Plastics Market Net Sales Share, By Geography, 2023 (%)
Figure 166: Company 12 Engineering Plastics Market Net Revenue, By Years, 2023-2030* ($)
Figure 167: Company 12 Engineering Plastics Market Net Revenue Share, By Business segments, 2023 (%)
Figure 168: Company 12 Engineering Plastics Market Net Sales Share, By Geography, 2023 (%)
Figure 169: Company 13 Engineering Plastics Market Net Revenue, By Years, 2023-2030* ($)
Figure 170: Company 13 Engineering Plastics Market Net Revenue Share, By Business segments, 2023 (%)
Figure 171: Company 13 Engineering Plastics Market Net Sales Share, By Geography, 2023 (%)
Figure 172: Company 14 Engineering Plastics Market Net Revenue, By Years, 2023-2030* ($)
Figure 173: Company 14 Engineering Plastics Market Net Revenue Share, By Business segments, 2023 (%)
Figure 174: Company 14 Engineering Plastics Market Net Sales Share, By Geography, 2023 (%)
Figure 175: Company 15 Engineering Plastics Market Net Revenue, By Years, 2023-2030* ($)
Figure 176: Company 15 Engineering Plastics Market Net Revenue Share, By Business segments, 2023 (%)
Figure 177: Company 15 Engineering Plastics Market Net Sales Share, By Geography, 2023 (%)