 Email
Email Print
Print


Central Nervous System (CNS) Lymphoma Market Overview
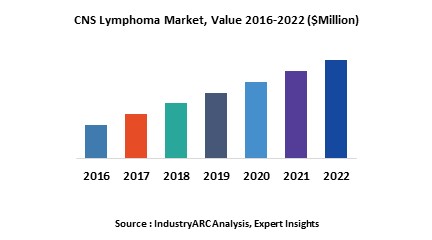
Central Nervous System (CNS) Lymphoma or microglioma is a disease in which cancer cells are formed in the lymph tissue of the brain or spinal cord. This is observed primarily in patients with very weak immune systems, patients suffering from immunosuppression, and AIDS patients. Patients who have undergone recent kidney or other organ transplants are also at a high risk of having CNS lymphoma due to their low count of T-Cells or low level of immunity. The major symptoms of this disease include headaches, memory problem, drowsiness, seizures, nausea, vomiting, personality changes, throat infection, body weakness, and sometimes, even hearing loss and double vision. This disease may occur in all age groups; however, it is mostly noticed in people in the 50+ age group. The global central nervous system lymphoma market is estimated to surpass $1,127m by 2023, growing at an estimated CAGR of 6.65% from 2018 to 2023. The North America region is the largest market for CNS lymphoma.
CNS Lymphoma Market Outlook
The report covers the major diagnosis methods including lumber puncture, pathological analysis of cerebrospinal fluid (CSF), brain biopsy sampling, magnetic resonance imaging (MRI), computed topography (CT) scan, stereostatic biopsy, and complete blood count. The market is further categorized by prognosis types, which include Immunocompetent and AIDS. Based on treatment types, the market is segmented into radiation therapy, chemotherapy, steroid therapy, targeted therapy, and others.
CNS Lymphoma Market Growth Drivers
The market is expected to be majorly driven by the rising prevalence of primary CNS lymphoma, increasing awareness regarding the advanced technologies in the market, and rising governmental spending on healthcare. The demand for diagnostic methods is on the surge; thus, propelling the demand for CNS lymphoma treatment across the regions.
CNS Lymphoma Market Challenges
Stringent regulations imposed on drugs by the regulatory bodies coupled with the rising R&D costs pose major challenges for the CNS lymphoma market. Owing to the intake of drug, chances of occurrence of side effects such as fatigue, gastrointestinal complication, graft versus host disease, and late effects of cancer survivors will negatively impact the growth of the market.
CNS Lymphoma Assembly Market Research Scope
The base year of the study is 2017, with forecast done up to 2023. The study presents a thorough analysis of the competitive landscape, taking into account the market shares of the leading companies. It also provides information on unit shipments. These provide the key market participants with the necessary business intelligence and help them understand the future of the CNS lymphoma market. The assessment includes the forecast, an overview of the competitive structure, the market shares of the competitors, as well as the market trends, market demands, market drivers, market challenges, and product analysis. The market drivers and restraints have been assessed to fathom their impact over the forecast period. This report further identifies the key opportunities for growth while also detailing the key challenges and possible threats. The key areas of focus include the types of prognosis and diagnosis in the CNS Lymphoma market, and their treatment methods.
CNS Lymphoma Market Report: Industry Coverage
Prognosis in CNS Lymphoma Market: Immunocompetent and AIDS
Diagnosis in CNS Lymphoma Market: Lumbar Puncture/Pathological Analysis of Cerebrospinal Fluid (CSF), Brain Biopsy Sampling and Stereotactic Biopsy, Magnetic Resonance Imaging (MRI), Computed Topography (CT scan), Complete Blood Count, and Others
Treatment in CNS Lymphoma Market: Radiation Therapy, Chemotherapy, Steroid Therapy, and Others
The CNS lymphoma Market report also analyzes the major geographic regions for the market as well as the major countries for the market in these regions. The regions and countries covered in the study include:
- North America: The U.S., Canada, Mexico
- Europe: The U.K., Germany, Italy, France, Spain, Rest of Europe
- APAC: China, Japan, Australia & New Zealand, South Korea, India, Rest of APAC
- RoW: The Middle East, Africa, South America
CNS Lymphoma Market Key Players Perspective
Some of the key players mentioned in this report are Amgen Inc., Celegene Corp., Cipla Inc., Dr. Reddy’s Laboratories, F. Hoffmann-La Roche Ltd., Fresenius SE & CO. KGAA, Gilead Science, Inc., Johnson & Johnson, Merck & CO., Inc., and Sanofi S.A.
CNS Lymphoma Market Trends
- Increased investments in healthcare, and research and development
- Growing prevalence of primary CNS lymphoma, and increasing awareness about advanced technologies in the market
- Advancements in MRI and CT scan technology coupled with increasing healthcare expenditure are driving the growth of the market.
- Diagnosis methods such as Magnetic Resonance Imaging (MRI) accounted for the major share of the total market in 2017. As per IndustryARC analysis, the chemotherapy segment will generate healthy revenue by 2023.
1. CNS Lymphoma Market - Overview
1.1. Definitions and Scope
2. CNS Lymphoma Market - Executive summary
2.1. Market Revenue, Market Size and Key Trends by Company
2.2. Key Trends by type of Application
2.3. Key Trends segmented by Geography
3. CNS Lymphoma Market
3.1. Comparative analysis
3.1.1. Product Benchmarking - Top 10 companies
3.1.2. Top 5 Financials Analysis
3.1.3. Market Value split by Top 10 companies
3.1.4. Patent Analysis - Top 10 companies
3.1.5. Pricing Analysis
4. CNS Lymphoma Market – Startup companies Scenario Premium
4.1. Top 10 startup company Analysis by
4.1.1. Investment
4.1.2. Revenue
4.1.3. Market Shares
4.1.4. Market Size and Application Analysis
4.1.5. Venture Capital and Funding Scenario
5. CNS Lymphoma Market – Industry Market Entry Scenario Premium
5.1. Regulatory Framework Overview
5.2. New Business and Ease of Doing business index
5.3. Case studies of successful ventures
5.4. Customer Analysis – Top 10 companies
6. CNS Lymphoma Market Forces
6.1. Drivers
6.2. Constraints
6.3. Challenges
6.4. Porters five force model
6.4.1. Bargaining power of suppliers
6.4.2. Bargaining powers of customers
6.4.3. Threat of new entrants
6.4.4. Rivalry among existing players
6.4.5. Threat of substitutes
7. CNS Lymphoma Market -Strategic analysis
7.1. Value chain analysis
7.2. Opportunities analysis
7.3. Product life cycle
7.4. Suppliers and distributors Market Share
8. CNS Lymphoma Market – By Prognosis Type (Market Size -$Million / $Billion)
8.1. Market Size and Market Share Analysis
8.2. Application Revenue and Trend Research
8.3. Product Segment Analysis
8.3.1. Immunocompetent
8.3.2. AIDS
9. CNS Lymphoma Market – By Type of Diagnosis (Market Size -$Million / $Billion)
9.1. Introduction
9.2. Lumbar Puncture/Pathological Analysis of cerebrospinal fluid (CSF)
9.3. Brain biopsy sampling
9.4. MRI (Magnetic Resonance Imaging)
9.5. CT Scan (Computed Tomography)
9.6. Stereotactic Biopsy
9.9. Complete Blood Count
9.8. Others
10. CNS Lymphoma Market – By Type of Treatment (Market Size -$Million / $Billion)
10.1. Introduction
10.2. Radiation Therapy
10.3. Chemotherapy
10.4. Steroid Therapy
10.5. Targeted Therapy
10.6. Others
11. CNS Lymphoma - By Geography (Market Size -$Million / $Billion)
11.1. CNS Lymphoma Market - North America Segment Research
11.2. North America Market Research (Million / $Billion)
11.2.1. Segment type Size and Market Size Analysis
11.2.2. Revenue and Trends
11.2.3. Application Revenue and Trends by type of Application
11.2.4. Company Revenue and Product Analysis
11.2.5. North America Product type and Application Market Size
11.2.5.1. U.S.
11.2.5.2. Canada
11.2.5.3. Mexico
11.2.5.4. Rest of North America
11.3. CNS Lymphoma - South America Segment Research
11.4. South America Market Research (Market Size -$Million / $Billion)
11.4.1. Segment type Size and Market Size Analysis
11.4.2. Revenue and Trends
11.4.3. Application Revenue and Trends by type of Application
11.4.4. Company Revenue and Product Analysis
11.4.5. South America Product type and Application Market Size
11.4.5.1. Brazil
11.4.5.2. Venezuela
11.4.5.3. Argentina
11.4.5.4. Ecuador
11.4.5.5. Peru
11.4.5.6. Colombia
11.4.5.7. Costa Rica
11.4.5.8. Rest of South America
11.5. CNS Lymphoma - Europe Segment Research
11.6. Europe Market Research (Market Size -$Million / $Billion)
11.6.1. Segment type Size and Market Size Analysis
11.6.2. Revenue and Trends
11.6.3. Application Revenue and Trends by type of Application
11.6.4. Company Revenue and Product Analysis
11.6.5. Europe Segment Product type and Application Market Size
11.6.5.1. U.K
11.6.5.2. Germany
11.6.5.3. Italy
11.6.5.4. France
11.6.5.5. Netherlands
11.6.5.6. Belgium
11.6.5.7. Spain
11.6.5.8. Denmark
11.6.5.9. Rest of Europe
11.7. CNS Lymphoma – APAC Segment Research
11.8. APAC Market Research (Market Size -$Million / $Billion)
11.8.1. Segment type Size and Market Size Analysis
11.8.2. Revenue and Trends
11.8.3. Application Revenue and Trends by type of Application
11.8.4. Company Revenue and Product Analysis
11.8.5. APAC Segment – Product type and Application Market Size
11.8.5.1. China
11.8.5.2. Australia
11.8.5.3. Japan
11.8.5.4. South Korea
11.8.5.5. India
11.8.5.6. Taiwan
11.8.5.7. Malaysia
12. CNS Lymphoma Market - Entropy
12.1. New product launches
12.2. M&A's, collaborations, JVs and partnerships
13. CNS Lymphoma Market – Industry / Segment Competition landscape Premium
13.1. Market Share Analysis
13.1.1. Market Share by Country- Top companies
13.1.2. Market Share by Region- Top 10 companies
13.1.3. Market Share by type of Application – Top 10 companies
13.1.4. Market Share by type of Product / Product category- Top 10 companies
13.1.5. Market Share at global level- Top 10 companies
13.1.6. Best Practises for companies
14. CNS Lymphoma Market – Key Company List by Country Premium
15. CNS Lymphoma Market Company Analysis
15.1. Market Share, Company Revenue, Products, M&A, Developments
15.2. Amgen Inc.
15.3. Celegene Corp.
15.4. Cipla Inc.
15.5. Dr. Reddy’s Laboratories
15.6. F. Hoffmann-La Roche Ltd.
15.7. Fresenius SE & CO. KGAA
15.8. Gilead Science Inc.
15.9. Johnson & Johnson
15.10. Merck & CO., Inc.,
15.11. Company 10
15.12. Company 11
15.13. Company 12 and more
"*Financials would be provided on a best efforts basis for private companies"
16. CNS Lymphoma Market -Appendix
16.1. Abbreviations
16.2. Sources
17. CNS Lymphoma Market -Methodology Premium
17.1. Research Methodology
17.1.1. Company Expert Interviews
17.1.2. Industry Databases
17.1.3. Associations
17.1.4. Company News
17.1.5. Company Annual Reports
17.1.6. Application Trends
17.1.7. New Products and Product database
17.1.8. Company Transcripts
17.1.9. R&D Trends
17.1.10. Key Opinion Leaders Interviews
17.1.11. Supply and Demand Trends
List of Tables
Table 1: CNS Lymphoma Market Overview 2023-2030
Table 2: CNS Lymphoma Market Leader Analysis 2023-2030 (US$)
Table 3: CNS Lymphoma Market Product Analysis 2023-2030 (US$)
Table 4: CNS Lymphoma Market End User Analysis 2023-2030 (US$)
Table 5: CNS Lymphoma Market Patent Analysis 2013-2023* (US$)
Table 6: CNS Lymphoma Market Financial Analysis 2023-2030 (US$)
Table 7: CNS Lymphoma Market Driver Analysis 2023-2030 (US$)
Table 8: CNS Lymphoma Market Challenges Analysis 2023-2030 (US$)
Table 9: CNS Lymphoma Market Constraint Analysis 2023-2030 (US$)
Table 10: CNS Lymphoma Market Supplier Bargaining Power Analysis 2023-2030 (US$)
Table 11: CNS Lymphoma Market Buyer Bargaining Power Analysis 2023-2030 (US$)
Table 12: CNS Lymphoma Market Threat of Substitutes Analysis 2023-2030 (US$)
Table 13: CNS Lymphoma Market Threat of New Entrants Analysis 2023-2030 (US$)
Table 14: CNS Lymphoma Market Degree of Competition Analysis 2023-2030 (US$)
Table 15: CNS Lymphoma Market Value Chain Analysis 2023-2030 (US$)
Table 16: CNS Lymphoma Market Pricing Analysis 2023-2030 (US$)
Table 17: CNS Lymphoma Market Opportunities Analysis 2023-2030 (US$)
Table 18: CNS Lymphoma Market Product Life Cycle Analysis 2023-2030 (US$)
Table 19: CNS Lymphoma Market Supplier Analysis 2023-2030 (US$)
Table 20: CNS Lymphoma Market Distributor Analysis 2023-2030 (US$)
Table 21: CNS Lymphoma Market Trend Analysis 2023-2030 (US$)
Table 22: CNS Lymphoma Market Size 2023 (US$)
Table 23: CNS Lymphoma Market Forecast Analysis 2023-2030 (US$)
Table 24: CNS Lymphoma Market Sales Forecast Analysis 2023-2030 (Units)
Table 25: CNS Lymphoma Market , Revenue & Volume,By Prognosis Type , 2023-2030 ($)
Table 26: CNS Lymphoma Market By Prognosis Type , Revenue & Volume,By Immunocompetent , 2023-2030 ($)
Table 27: CNS Lymphoma Market By Prognosis Type , Revenue & Volume,By AIDS , 2023-2030 ($)
Table 28: CNS Lymphoma Market , Revenue & Volume,By Types of Treatments, 2023-2030 ($)
Table 29: CNS Lymphoma Market By Types of Treatments, Revenue & Volume,By Radiation Therapy, 2023-2030 ($)
Table 30: CNS Lymphoma Market By Types of Treatments, Revenue & Volume,By Chemotherapy, 2023-2030 ($)
Table 31: CNS Lymphoma Market By Types of Treatments, Revenue & Volume,By Steroid Therapy, 2023-2030 ($)
Table 32: CNS Lymphoma Market By Types of Treatments, Revenue & Volume,By High-dose chemotherapy with stem cell transplant, 2023-2030 ($)
Table 33: CNS Lymphoma Market By Types of Treatments, Revenue & Volume,By Targeted Therapy, 2023-2030 ($)
Table 34: North America CNS Lymphoma Market , Revenue & Volume,By Prognosis Type , 2023-2030 ($)
Table 35: North America CNS Lymphoma Market , Revenue & Volume,By Types of Treatments, 2023-2030 ($)
Table 36: South america CNS Lymphoma Market , Revenue & Volume,By Prognosis Type , 2023-2030 ($)
Table 37: South america CNS Lymphoma Market , Revenue & Volume,By Types of Treatments, 2023-2030 ($)
Table 38: Europe CNS Lymphoma Market , Revenue & Volume,By Prognosis Type , 2023-2030 ($)
Table 39: Europe CNS Lymphoma Market , Revenue & Volume,By Types of Treatments, 2023-2030 ($)
Table 40: APAC CNS Lymphoma Market , Revenue & Volume,By Prognosis Type , 2023-2030 ($)
Table 41: APAC CNS Lymphoma Market , Revenue & Volume,By Types of Treatments, 2023-2030 ($)
Table 42: Middle East & Africa CNS Lymphoma Market , Revenue & Volume,By Prognosis Type , 2023-2030 ($)
Table 43: Middle East & Africa CNS Lymphoma Market , Revenue & Volume,By Types of Treatments, 2023-2030 ($)
Table 44: Russia CNS Lymphoma Market , Revenue & Volume,By Prognosis Type , 2023-2030 ($)
Table 45: Russia CNS Lymphoma Market , Revenue & Volume,By Types of Treatments, 2023-2030 ($)
Table 46: Israel CNS Lymphoma Market , Revenue & Volume,By Prognosis Type , 2023-2030 ($)
Table 47: Israel CNS Lymphoma Market , Revenue & Volume,By Types of Treatments, 2023-2030 ($)
Table 48: Top Companies 2023 (US$)CNS Lymphoma Market , Revenue & Volume,,
Table 49: Product Launch 2023-2030CNS Lymphoma Market , Revenue & Volume,,
Table 50: Mergers & Acquistions 2023-2030CNS Lymphoma Market , Revenue & Volume,,
List of Figures
Figure 1: Overview of CNS Lymphoma Market 2023-2030
Figure 2: Market Share Analysis for CNS Lymphoma Market 2023 (US$)
Figure 3: Product Comparison in CNS Lymphoma Market 2023-2030 (US$)
Figure 4: End User Profile for CNS Lymphoma Market 2023-2030 (US$)
Figure 5: Patent Application and Grant in CNS Lymphoma Market 2013-2023* (US$)
Figure 6: Top 5 Companies Financial Analysis in CNS Lymphoma Market 2023-2030 (US$)
Figure 7: Market Entry Strategy in CNS Lymphoma Market 2023-2030
Figure 8: Ecosystem Analysis in CNS Lymphoma Market 2023
Figure 9: Average Selling Price in CNS Lymphoma Market 2023-2030
Figure 10: Top Opportunites in CNS Lymphoma Market 2023-2030
Figure 11: Market Life Cycle Analysis in CNS Lymphoma Market
Figure 12: GlobalBy Prognosis Type CNS Lymphoma Market Revenue, 2023-2030 ($)
Figure 13: GlobalBy Types of TreatmentsCNS Lymphoma Market Revenue, 2023-2030 ($)
Figure 14: Global CNS Lymphoma Market - By Geography
Figure 15: Global CNS Lymphoma Market Value & Volume, By Geography, 2023-2030 ($)
Figure 16: Global CNS Lymphoma Market CAGR, By Geography, 2023-2030 (%)
Figure 17: North America CNS Lymphoma Market Value & Volume, 2023-2030 ($)
Figure 18: US CNS Lymphoma Market Value & Volume, 2023-2030 ($)
Figure 19: US GDP and Population, 2023-2030 ($)
Figure 20: US GDP – Composition of 2023, By Sector of Origin
Figure 21: US Export and Import Value & Volume, 2023-2030 ($)
Figure 22: Canada CNS Lymphoma Market Value & Volume, 2023-2030 ($)
Figure 23: Canada GDP and Population, 2023-2030 ($)
Figure 24: Canada GDP – Composition of 2023, By Sector of Origin
Figure 25: Canada Export and Import Value & Volume, 2023-2030 ($)
Figure 26: Mexico CNS Lymphoma Market Value & Volume, 2023-2030 ($)
Figure 27: Mexico GDP and Population, 2023-2030 ($)
Figure 28: Mexico GDP – Composition of 2023, By Sector of Origin
Figure 29: Mexico Export and Import Value & Volume, 2023-2030 ($)
Figure 30: South America CNS Lymphoma Market South America 3D Printing Market Value & Volume, 2023-2030 ($)
Figure 31: Brazil CNS Lymphoma Market Value & Volume, 2023-2030 ($)
Figure 32: Brazil GDP and Population, 2023-2030 ($)
Figure 33: Brazil GDP – Composition of 2023, By Sector of Origin
Figure 34: Brazil Export and Import Value & Volume, 2023-2030 ($)
Figure 35: Venezuela CNS Lymphoma Market Value & Volume, 2023-2030 ($)
Figure 36: Venezuela GDP and Population, 2023-2030 ($)
Figure 37: Venezuela GDP – Composition of 2023, By Sector of Origin
Figure 38: Venezuela Export and Import Value & Volume, 2023-2030 ($)
Figure 39: Argentina CNS Lymphoma Market Value & Volume, 2023-2030 ($)
Figure 40: Argentina GDP and Population, 2023-2030 ($)
Figure 41: Argentina GDP – Composition of 2023, By Sector of Origin
Figure 42: Argentina Export and Import Value & Volume, 2023-2030 ($)
Figure 43: Ecuador CNS Lymphoma Market Value & Volume, 2023-2030 ($)
Figure 44: Ecuador GDP and Population, 2023-2030 ($)
Figure 45: Ecuador GDP – Composition of 2023, By Sector of Origin
Figure 46: Ecuador Export and Import Value & Volume, 2023-2030 ($)
Figure 47: Peru CNS Lymphoma Market Value & Volume, 2023-2030 ($)
Figure 48: Peru GDP and Population, 2023-2030 ($)
Figure 49: Peru GDP – Composition of 2023, By Sector of Origin
Figure 50: Peru Export and Import Value & Volume, 2023-2030 ($)
Figure 51: Colombia CNS Lymphoma Market Value & Volume, 2023-2030 ($)
Figure 52: Colombia GDP and Population, 2023-2030 ($)
Figure 53: Colombia GDP – Composition of 2023, By Sector of Origin
Figure 54: Colombia Export and Import Value & Volume, 2023-2030 ($)
Figure 55: Costa Rica CNS Lymphoma Market Costa Rica 3D Printing Market Value & Volume, 2023-2030 ($)
Figure 56: Costa Rica GDP and Population, 2023-2030 ($)
Figure 57: Costa Rica GDP – Composition of 2023, By Sector of Origin
Figure 58: Costa Rica Export and Import Value & Volume, 2023-2030 ($)
Figure 59: Europe CNS Lymphoma Market Value & Volume, 2023-2030 ($)
Figure 60: U.K CNS Lymphoma Market Value & Volume, 2023-2030 ($)
Figure 61: U.K GDP and Population, 2023-2030 ($)
Figure 62: U.K GDP – Composition of 2023, By Sector of Origin
Figure 63: U.K Export and Import Value & Volume, 2023-2030 ($)
Figure 64: Germany CNS Lymphoma Market Value & Volume, 2023-2030 ($)
Figure 65: Germany GDP and Population, 2023-2030 ($)
Figure 66: Germany GDP – Composition of 2023, By Sector of Origin
Figure 67: Germany Export and Import Value & Volume, 2023-2030 ($)
Figure 68: Italy CNS Lymphoma Market Value & Volume, 2023-2030 ($)
Figure 69: Italy GDP and Population, 2023-2030 ($)
Figure 70: Italy GDP – Composition of 2023, By Sector of Origin
Figure 71: Italy Export and Import Value & Volume, 2023-2030 ($)
Figure 72: France CNS Lymphoma Market Value & Volume, 2023-2030 ($)
Figure 73: France GDP and Population, 2023-2030 ($)
Figure 74: France GDP – Composition of 2023, By Sector of Origin
Figure 75: France Export and Import Value & Volume, 2023-2030 ($)
Figure 76: Netherlands CNS Lymphoma Market Value & Volume, 2023-2030 ($)
Figure 77: Netherlands GDP and Population, 2023-2030 ($)
Figure 78: Netherlands GDP – Composition of 2023, By Sector of Origin
Figure 79: Netherlands Export and Import Value & Volume, 2023-2030 ($)
Figure 80: Belgium CNS Lymphoma Market Value & Volume, 2023-2030 ($)
Figure 81: Belgium GDP and Population, 2023-2030 ($)
Figure 82: Belgium GDP – Composition of 2023, By Sector of Origin
Figure 83: Belgium Export and Import Value & Volume, 2023-2030 ($)
Figure 84: Spain CNS Lymphoma Market Value & Volume, 2023-2030 ($)
Figure 85: Spain GDP and Population, 2023-2030 ($)
Figure 86: Spain GDP – Composition of 2023, By Sector of Origin
Figure 87: Spain Export and Import Value & Volume, 2023-2030 ($)
Figure 88: Denmark CNS Lymphoma Market Value & Volume, 2023-2030 ($)
Figure 89: Denmark GDP and Population, 2023-2030 ($)
Figure 90: Denmark GDP – Composition of 2023, By Sector of Origin
Figure 91: Denmark Export and Import Value & Volume, 2023-2030 ($)
Figure 92: APAC CNS Lymphoma Market Value & Volume, 2023-2030 ($)
Figure 93: China CNS Lymphoma Market Value & Volume, 2023-2030
Figure 94: China GDP and Population, 2023-2030 ($)
Figure 95: China GDP – Composition of 2023, By Sector of Origin
Figure 96: China Export and Import Value & Volume, 2023-2030 ($)CNS Lymphoma Market China Export and Import Value & Volume, 2023-2030 ($)
Figure 97: Australia CNS Lymphoma Market Value & Volume, 2023-2030 ($)
Figure 98: Australia GDP and Population, 2023-2030 ($)
Figure 99: Australia GDP – Composition of 2023, By Sector of Origin
Figure 100: Australia Export and Import Value & Volume, 2023-2030 ($)
Figure 101: South Korea CNS Lymphoma Market Value & Volume, 2023-2030 ($)
Figure 102: South Korea GDP and Population, 2023-2030 ($)
Figure 103: South Korea GDP – Composition of 2023, By Sector of Origin
Figure 104: South Korea Export and Import Value & Volume, 2023-2030 ($)
Figure 105: India CNS Lymphoma Market Value & Volume, 2023-2030 ($)
Figure 106: India GDP and Population, 2023-2030 ($)
Figure 107: India GDP – Composition of 2023, By Sector of Origin
Figure 108: India Export and Import Value & Volume, 2023-2030 ($)
Figure 109: Taiwan CNS Lymphoma Market Taiwan 3D Printing Market Value & Volume, 2023-2030 ($)
Figure 110: Taiwan GDP and Population, 2023-2030 ($)
Figure 111: Taiwan GDP – Composition of 2023, By Sector of Origin
Figure 112: Taiwan Export and Import Value & Volume, 2023-2030 ($)
Figure 113: Malaysia CNS Lymphoma Market Malaysia 3D Printing Market Value & Volume, 2023-2030 ($)
Figure 114: Malaysia GDP and Population, 2023-2030 ($)
Figure 115: Malaysia GDP – Composition of 2023, By Sector of Origin
Figure 116: Malaysia Export and Import Value & Volume, 2023-2030 ($)
Figure 117: Hong Kong CNS Lymphoma Market Hong Kong 3D Printing Market Value & Volume, 2023-2030 ($)
Figure 118: Hong Kong GDP and Population, 2023-2030 ($)
Figure 119: Hong Kong GDP – Composition of 2023, By Sector of Origin
Figure 120: Hong Kong Export and Import Value & Volume, 2023-2030 ($)
Figure 121: Middle East & Africa CNS Lymphoma Market Middle East & Africa 3D Printing Market Value & Volume, 2023-2030 ($)
Figure 122: Russia CNS Lymphoma Market Russia 3D Printing Market Value & Volume, 2023-2030 ($)
Figure 123: Russia GDP and Population, 2023-2030 ($)
Figure 124: Russia GDP – Composition of 2023, By Sector of Origin
Figure 125: Russia Export and Import Value & Volume, 2023-2030 ($)
Figure 126: Israel CNS Lymphoma Market Value & Volume, 2023-2030 ($)
Figure 127: Israel GDP and Population, 2023-2030 ($)
Figure 128: Israel GDP – Composition of 2023, By Sector of Origin
Figure 129: Israel Export and Import Value & Volume, 2023-2030 ($)
Figure 130: Entropy Share, By Strategies, 2023-2030* (%)CNS Lymphoma Market
Figure 131: Developments, 2023-2030*CNS Lymphoma Market
Figure 132: Company 1 CNS Lymphoma Market Net Revenue, By Years, 2023-2030* ($)
Figure 133: Company 1 CNS Lymphoma Market Net Revenue Share, By Business segments, 2023 (%)
Figure 134: Company 1 CNS Lymphoma Market Net Sales Share, By Geography, 2023 (%)
Figure 135: Company 2 CNS Lymphoma Market Net Revenue, By Years, 2023-2030* ($)
Figure 136: Company 2 CNS Lymphoma Market Net Revenue Share, By Business segments, 2023 (%)
Figure 137: Company 2 CNS Lymphoma Market Net Sales Share, By Geography, 2023 (%)
Figure 138: Company 3CNS Lymphoma Market Net Revenue, By Years, 2023-2030* ($)
Figure 139: Company 3CNS Lymphoma Market Net Revenue Share, By Business segments, 2023 (%)
Figure 140: Company 3CNS Lymphoma Market Net Sales Share, By Geography, 2023 (%)
Figure 141: Company 4 CNS Lymphoma Market Net Revenue, By Years, 2023-2030* ($)
Figure 142: Company 4 CNS Lymphoma Market Net Revenue Share, By Business segments, 2023 (%)
Figure 143: Company 4 CNS Lymphoma Market Net Sales Share, By Geography, 2023 (%)
Figure 144: Company 5 CNS Lymphoma Market Net Revenue, By Years, 2023-2030* ($)
Figure 145: Company 5 CNS Lymphoma Market Net Revenue Share, By Business segments, 2023 (%)
Figure 146: Company 5 CNS Lymphoma Market Net Sales Share, By Geography, 2023 (%)
Figure 147: Company 6 CNS Lymphoma Market Net Revenue, By Years, 2023-2030* ($)
Figure 148: Company 6 CNS Lymphoma Market Net Revenue Share, By Business segments, 2023 (%)
Figure 149: Company 6 CNS Lymphoma Market Net Sales Share, By Geography, 2023 (%)
Figure 150: Company 7 CNS Lymphoma Market Net Revenue, By Years, 2023-2030* ($)
Figure 151: Company 7 CNS Lymphoma Market Net Revenue Share, By Business segments, 2023 (%)
Figure 152: Company 7 CNS Lymphoma Market Net Sales Share, By Geography, 2023 (%)
Figure 153: Company 8 CNS Lymphoma Market Net Revenue, By Years, 2023-2030* ($)
Figure 154: Company 8 CNS Lymphoma Market Net Revenue Share, By Business segments, 2023 (%)
Figure 155: Company 8 CNS Lymphoma Market Net Sales Share, By Geography, 2023 (%)
Figure 156: Company 9 CNS Lymphoma Market Net Revenue, By Years, 2023-2030* ($)
Figure 157: Company 9 CNS Lymphoma Market Net Revenue Share, By Business segments, 2023 (%)
Figure 158: Company 9 CNS Lymphoma Market Net Sales Share, By Geography, 2023 (%)
Figure 159: Company 10 CNS Lymphoma Market Net Revenue, By Years, 2023-2030* ($)
Figure 160: Company 10 CNS Lymphoma Market Net Revenue Share, By Business segments, 2023 (%)
Figure 161: Company 10 CNS Lymphoma Market Net Sales Share, By Geography, 2023 (%)
Figure 162: Company 11 CNS Lymphoma Market Net Revenue, By Years, 2023-2030* ($)
Figure 163: Company 11 CNS Lymphoma Market Net Revenue Share, By Business segments, 2023 (%)
Figure 164: Company 11 CNS Lymphoma Market Net Sales Share, By Geography, 2023 (%)
Figure 165: Company 12 CNS Lymphoma Market Net Revenue, By Years, 2023-2030* ($)
Figure 166: Company 12 CNS Lymphoma Market Net Revenue Share, By Business segments, 2023 (%)
Figure 167: Company 12 CNS Lymphoma Market Net Sales Share, By Geography, 2023 (%)
Figure 168: Company 13CNS Lymphoma Market Net Revenue, By Years, 2023-2030* ($)
Figure 169: Company 13CNS Lymphoma Market Net Revenue Share, By Business segments, 2023 (%)
Figure 170: Company 13CNS Lymphoma Market Net Sales Share, By Geography, 2023 (%)
Figure 171: Company 14 CNS Lymphoma Market Net Revenue, By Years, 2023-2030* ($)
Figure 172: Company 14 CNS Lymphoma Market Net Revenue Share, By Business segments, 2023 (%)
Figure 173: Company 14 CNS Lymphoma Market Net Sales Share, By Geography, 2023 (%)
Figure 174: Company 15 CNS Lymphoma Market Net Revenue, By Years, 2023-2030* ($)
Figure 175: Company 15 CNS Lymphoma Market Net Revenue Share, By Business segments, 2023 (%)
Figure 176: Company 15 CNS Lymphoma Market Net Sales Share, By Geography, 2023 (%)