 Email
Email Print
Print


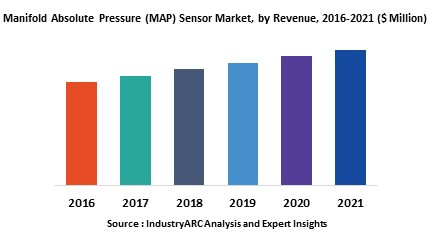
Manifold Absolute Pressure (MAP) Sensor Market - Forecast(2024 - 2030)
The automotive industry has always been vulnerable to major macro economic factors, which in turn impacts the demand for the different sensors and actuators. Manifold absolute pressure (MAP) sensor is also one of these sensors, whose market is affected by these factors. However the equation within the types of vehicles is completely different. For instance, the industry has witnessed downfall in the shipments of passenger cars and other commercial vehicles such as heavy trucks and buses from 2014 to first quarter of 2016. Unlike, the shipments of light commercial vehicles have increased over the same period. Similar dynamics is observed in the MAP sensors market. However, it is anticipated that the MAP sensors market will show a positive growth trend till 2020. One of the major factors behind this positive trend is stringent government regulations for fuel emission on OEMs.
The report gives comprehensive and precise insights on the factors affecting the growth of the MAP sensors market. The demand and supply side factors are analyzed in detail to understand the impact on the MAP sensors market. The historical pricing trend and expected price erosion analysis is also devised in the report to forecast the dynamics in the market. The Porter’s five forces analysis in the report gives detailed insights on the estimated threats of substitutes and new entrants. It also analyzes the bargaining power of buyers and suppliers in the value chain. The value chain analysis covered in the report analyzes the major suppliers and OEMs in the market, with detailed analysis on the factors affecting the price of MAP sensors throughout the supply chain.
The report classifies the MAP sensors market in different segments such as market by MAP sensor pressure ratings, market by vehicle type, and market by application. The major vehicle types covered in the report are light commercial vehicles, passenger vehicles, and heavy trucks and buses. The report also classifies the market by engine type such as diesel, gasoline, and petrol.
The report includes the global coverage of MAP sensors market in terms of geography. All the major regions such as North America, South America, Europe, Asia-Pacific, and Middle-East and Africa are analyzed in the report. Apart from this, country level analysis is also covered in the report.
The market entropy section of the report gives broad coverage of all the competitive strategies adopted by the key vendors of MAP sensors. The strategic developments such as partnerships with OEMs and suppliers, new product launches and developments, mergers and acquisitions, and joint ventures among others are also covered in the report.
Sample Companies profiled in this Report are:
- Denso
- Delphi
- Continental
- Bosch
- Hella
- 10+.
1. MAP Market Overview
2. Executive Summary
3. MAP Market Landscape
3.1. Market Share Analysis
3.2. Comparative Analysis
3.2.1. Product Benchmarking
3.2.2. End-User Profiling
3.2.3. Financial Analysis of Top 5 Players
4. MAP Market Forces
4.1. Market Drivers
4.2. Market Constraints
4.3. Market Challenges
4.4. Attractiveness of Industry
4.4.1. Power of Supplier
4.4.2. Power of Consumer
4.4.3. Threat of New Entrant
4.4.4. Threat of Substitute
4.4.5. Degree of Competition
5. MAP Market Strategic Analysis
5.1. Value Chain Analysis
5.2. Pricing Analysis
5.3. Opportunity Analysis
5.4. Product Life Cycle Analysis
5.5. Supplier & Distributor Analysis
6. MAP Market - By Pressure Rating
6.1. 1 Bar
6.2. 2 Bar
6.3. 3 Bar
6.4. 4 Bar
6.5. Others
7. MAP Market - By Vehicle Type
7.1. Light Commercial Vehicles
7.1.1. Diesel
7.1.2. Petrol
7.1.3. Others
7.2. Heavy Trucks & Buses
7.3. Passenger Cars
7.3.1. Diesel
7.3.2. Petrol
7.3.3. Others
7.4. Other Vehicles
8. MAP Market - By Channel
8.1. OE
8.2. Aftermarket
9. MAP Market - By Application
9.1. EGR
9.2. Barometric Pressure
10. MAP Market – By Geography
10.1. North America
10.1.1. The U.S.
10.1.2. Canada
10.1.3. Others
10.2. Europe
10.2.1. Germany
10.2.2. U.K.
10.2.3. France
10.2.4. Others
10.3. Asia-Pacific
10.3.1. China
10.3.2. India
10.3.3. Japan
10.3.4. Others
10.4. Middle-East & Africa
10.5. Latin America
10.5.1. Brazil
10.5.2. Argentina
10.5.3. Others
11. MAP Market Entropy
11.1. New Product Launches
11.2. M&A, Collaboration, Partnerships, & JVs
12. Company Profiles (Overview, Financials, Products & Services, Recent Developments, Competitors, and Customers)
12.1. Airtex Vehicle Electronics
12.2. Allegro Microsystems LLC
12.3. Amphenol Corporation
12.4. ams AG
12.5. Bosch
12.6. Continental AG
12.7. CTS Corporation
12.8. Delphi
12.9. DENSO
12.10. Freescale
12.11. Hella KGaA Hueck & Co
12.12. Infineon Technologies
12.13. IST
12.14. Melexis
12.15. Micronas
12.16. Murata
12.17. Mitsubishi Electric Corporation
12.18. NGK/NTK
12.19. NXP
12.20. Preh
12.21. Sensata
12.22. Silicon Microstructures
12.23. TE Connectivity
*More than 10 Companies are profiled in this Research Report*
"*Financials would be provided on a best efforts basis for private companies"
13. Appendix
13.1. Abbreviations
13.2. Sources
13.3. Research Methodology
13.4. Bibliography
13.5. Compilation of Expert Insights
List of Tables
Table 1: Manifold Absolute Pressure (MAP) Sensor Market Overview 2023-2030
Table 2: Manifold Absolute Pressure (MAP) Sensor Market Leader Analysis 2023-2030 (US$)
Table 3: Manifold Absolute Pressure (MAP) Sensor Market Product Analysis 2023-2030 (US$)
Table 4: Manifold Absolute Pressure (MAP) Sensor Market End User Analysis 2023-2030 (US$)
Table 5: Manifold Absolute Pressure (MAP) Sensor Market Patent Analysis 2013-2023* (US$)
Table 6: Manifold Absolute Pressure (MAP) Sensor Market Financial Analysis 2023-2030 (US$)
Table 7: Manifold Absolute Pressure (MAP) Sensor Market Driver Analysis 2023-2030 (US$)
Table 8: Manifold Absolute Pressure (MAP) Sensor Market Challenges Analysis 2023-2030 (US$)
Table 9: Manifold Absolute Pressure (MAP) Sensor Market Constraint Analysis 2023-2030 (US$)
Table 10: Manifold Absolute Pressure (MAP) Sensor Market Supplier Bargaining Power Analysis 2023-2030 (US$)
Table 11: Manifold Absolute Pressure (MAP) Sensor Market Buyer Bargaining Power Analysis 2023-2030 (US$)
Table 12: Manifold Absolute Pressure (MAP) Sensor Market Threat of Substitutes Analysis 2023-2030 (US$)
Table 13: Manifold Absolute Pressure (MAP) Sensor Market Threat of New Entrants Analysis 2023-2030 (US$)
Table 14: Manifold Absolute Pressure (MAP) Sensor Market Degree of Competition Analysis 2023-2030 (US$)
Table 15: Manifold Absolute Pressure (MAP) Sensor Market Value Chain Analysis 2023-2030 (US$)
Table 16: Manifold Absolute Pressure (MAP) Sensor Market Pricing Analysis 2023-2030 (US$)
Table 17: Manifold Absolute Pressure (MAP) Sensor Market Opportunities Analysis 2023-2030 (US$)
Table 18: Manifold Absolute Pressure (MAP) Sensor Market Product Life Cycle Analysis 2023-2030 (US$)
Table 19: Manifold Absolute Pressure (MAP) Sensor Market Supplier Analysis 2023-2030 (US$)
Table 20: Manifold Absolute Pressure (MAP) Sensor Market Distributor Analysis 2023-2030 (US$)
Table 21: Manifold Absolute Pressure (MAP) Sensor Market Trend Analysis 2023-2030 (US$)
Table 22: Manifold Absolute Pressure (MAP) Sensor Market Size 2023 (US$)
Table 23: Manifold Absolute Pressure (MAP) Sensor Market Forecast Analysis 2023-2030 (US$)
Table 24: Manifold Absolute Pressure (MAP) Sensor Market Sales Forecast Analysis 2023-2030 (Units)
Table 25: Manifold Absolute Pressure (MAP) Sensor Market, Revenue & Volume, By Pressure Rating, 2023-2030 ($)
Table 26: Manifold Absolute Pressure (MAP) Sensor Market By Pressure Rating, Revenue & Volume, By 1 Bar, 2023-2030 ($)
Table 27: Manifold Absolute Pressure (MAP) Sensor Market By Pressure Rating, Revenue & Volume, By 2 Bar, 2023-2030 ($)
Table 28: Manifold Absolute Pressure (MAP) Sensor Market By Pressure Rating, Revenue & Volume, By 3 Bar, 2023-2030 ($)
Table 29: Manifold Absolute Pressure (MAP) Sensor Market By Pressure Rating, Revenue & Volume, By 4 Bar, 2023-2030 ($)
Table 30: Manifold Absolute Pressure (MAP) Sensor Market, Revenue & Volume, By Vehicle Type, 2023-2030 ($)
Table 31: Manifold Absolute Pressure (MAP) Sensor Market By Vehicle Type, Revenue & Volume, By Light Commercial Vehicles, 2023-2030 ($)
Table 32: Manifold Absolute Pressure (MAP) Sensor Market By Vehicle Type, Revenue & Volume, By Heavy Trucks & Buses, 2023-2030 ($)
Table 33: Manifold Absolute Pressure (MAP) Sensor Market By Vehicle Type, Revenue & Volume, By Passenger Cars, 2023-2030 ($)
Table 34: Manifold Absolute Pressure (MAP) Sensor Market, Revenue & Volume, By Channel, 2023-2030 ($)
Table 35: Manifold Absolute Pressure (MAP) Sensor Market By Channel, Revenue & Volume, By OE, 2023-2030 ($)
Table 36: Manifold Absolute Pressure (MAP) Sensor Market By Channel, Revenue & Volume, By AfterMarket, 2023-2030 ($)
Table 37: Manifold Absolute Pressure (MAP) Sensor Market, Revenue & Volume, By Application, 2023-2030 ($)
Table 38: Manifold Absolute Pressure (MAP) Sensor Market By Application, Revenue & Volume, By EGR, 2023-2030 ($)
Table 39: Manifold Absolute Pressure (MAP) Sensor Market By Application, Revenue & Volume, By Barometric Pressure, 2023-2030 ($)
Table 40: North America Manifold Absolute Pressure (MAP) Sensor Market, Revenue & Volume, By Pressure Rating, 2023-2030 ($)
Table 41: North America Manifold Absolute Pressure (MAP) Sensor Market, Revenue & Volume, By Vehicle Type, 2023-2030 ($)
Table 42: North America Manifold Absolute Pressure (MAP) Sensor Market, Revenue & Volume, By Channel, 2023-2030 ($)
Table 43: North America Manifold Absolute Pressure (MAP) Sensor Market, Revenue & Volume, By Application, 2023-2030 ($)
Table 44: South america Manifold Absolute Pressure (MAP) Sensor Market, Revenue & Volume, By Pressure Rating, 2023-2030 ($)
Table 45: South america Manifold Absolute Pressure (MAP) Sensor Market, Revenue & Volume, By Vehicle Type, 2023-2030 ($)
Table 46: South america Manifold Absolute Pressure (MAP) Sensor Market, Revenue & Volume, By Channel, 2023-2030 ($)
Table 47: South america Manifold Absolute Pressure (MAP) Sensor Market, Revenue & Volume, By Application, 2023-2030 ($)
Table 48: Europe Manifold Absolute Pressure (MAP) Sensor Market, Revenue & Volume, By Pressure Rating, 2023-2030 ($)
Table 49: Europe Manifold Absolute Pressure (MAP) Sensor Market, Revenue & Volume, By Vehicle Type, 2023-2030 ($)
Table 50: Europe Manifold Absolute Pressure (MAP) Sensor Market, Revenue & Volume, By Channel, 2023-2030 ($)
Table 51: Europe Manifold Absolute Pressure (MAP) Sensor Market, Revenue & Volume, By Application, 2023-2030 ($)
Table 52: APAC Manifold Absolute Pressure (MAP) Sensor Market, Revenue & Volume, By Pressure Rating, 2023-2030 ($)
Table 53: APAC Manifold Absolute Pressure (MAP) Sensor Market, Revenue & Volume, By Vehicle Type, 2023-2030 ($)
Table 54: APAC Manifold Absolute Pressure (MAP) Sensor Market, Revenue & Volume, By Channel, 2023-2030 ($)
Table 55: APAC Manifold Absolute Pressure (MAP) Sensor Market, Revenue & Volume, By Application, 2023-2030 ($)
Table 56: Middle East & Africa Manifold Absolute Pressure (MAP) Sensor Market, Revenue & Volume, By Pressure Rating, 2023-2030 ($)
Table 57: Middle East & Africa Manifold Absolute Pressure (MAP) Sensor Market, Revenue & Volume, By Vehicle Type, 2023-2030 ($)
Table 58: Middle East & Africa Manifold Absolute Pressure (MAP) Sensor Market, Revenue & Volume, By Channel, 2023-2030 ($)
Table 59: Middle East & Africa Manifold Absolute Pressure (MAP) Sensor Market, Revenue & Volume, By Application, 2023-2030 ($)
Table 60: Russia Manifold Absolute Pressure (MAP) Sensor Market, Revenue & Volume, By Pressure Rating, 2023-2030 ($)
Table 61: Russia Manifold Absolute Pressure (MAP) Sensor Market, Revenue & Volume, By Vehicle Type, 2023-2030 ($)
Table 62: Russia Manifold Absolute Pressure (MAP) Sensor Market, Revenue & Volume, By Channel, 2023-2030 ($)
Table 63: Russia Manifold Absolute Pressure (MAP) Sensor Market, Revenue & Volume, By Application, 2023-2030 ($)
Table 64: Israel Manifold Absolute Pressure (MAP) Sensor Market, Revenue & Volume, By Pressure Rating, 2023-2030 ($)
Table 65: Israel Manifold Absolute Pressure (MAP) Sensor Market, Revenue & Volume, By Vehicle Type, 2023-2030 ($)
Table 66: Israel Manifold Absolute Pressure (MAP) Sensor Market, Revenue & Volume, By Channel, 2023-2030 ($)
Table 67: Israel Manifold Absolute Pressure (MAP) Sensor Market, Revenue & Volume, By Application, 2023-2030 ($)
Table 68: Top Companies 2023 (US$)Manifold Absolute Pressure (MAP) Sensor Market, Revenue & Volume
Table 69: Product Launch 2023-2030Manifold Absolute Pressure (MAP) Sensor Market, Revenue & Volume
Table 70: Mergers & Acquistions 2023-2030Manifold Absolute Pressure (MAP) Sensor Market, Revenue & Volume
List of Figures
Figure 1: Overview of Manifold Absolute Pressure (MAP) Sensor Market 2023-2030
Figure 2: Market Share Analysis for Manifold Absolute Pressure (MAP) Sensor Market 2023 (US$)
Figure 3: Product Comparison in Manifold Absolute Pressure (MAP) Sensor Market 2023-2030 (US$)
Figure 4: End User Profile for Manifold Absolute Pressure (MAP) Sensor Market 2023-2030 (US$)
Figure 5: Patent Application and Grant in Manifold Absolute Pressure (MAP) Sensor Market 2013-2023* (US$)
Figure 6: Top 5 Companies Financial Analysis in Manifold Absolute Pressure (MAP) Sensor Market 2023-2030 (US$)
Figure 7: Market Entry Strategy in Manifold Absolute Pressure (MAP) Sensor Market 2023-2030
Figure 8: Ecosystem Analysis in Manifold Absolute Pressure (MAP) Sensor Market 2023
Figure 9: Average Selling Price in Manifold Absolute Pressure (MAP) Sensor Market 2023-2030
Figure 10: Top Opportunites in Manifold Absolute Pressure (MAP) Sensor Market 2023-2030
Figure 11: Market Life Cycle Analysis in Manifold Absolute Pressure (MAP) Sensor Market
Figure 12: GlobalBy Pressure RatingManifold Absolute Pressure (MAP) Sensor Market Revenue, 2023-2030 ($)
Figure 13: GlobalBy Vehicle TypeManifold Absolute Pressure (MAP) Sensor Market Revenue, 2023-2030 ($)
Figure 14: GlobalBy ChannelManifold Absolute Pressure (MAP) Sensor Market Revenue, 2023-2030 ($)
Figure 15: GlobalBy ApplicationManifold Absolute Pressure (MAP) Sensor Market Revenue, 2023-2030 ($)
Figure 16: Global Manifold Absolute Pressure (MAP) Sensor Market - By Geography
Figure 17: Global Manifold Absolute Pressure (MAP) Sensor Market Value & Volume, By Geography, 2023-2030 ($)
Figure 18: Global Manifold Absolute Pressure (MAP) Sensor Market CAGR, By Geography, 2023-2030 (%)
Figure 19: North America Manifold Absolute Pressure (MAP) Sensor Market Value & Volume, 2023-2030 ($)
Figure 20: US Manifold Absolute Pressure (MAP) Sensor Market Value & Volume, 2023-2030 ($)
Figure 21: US GDP and Population, 2023-2030 ($)
Figure 22: US GDP – Composition of 2023, By Sector of Origin
Figure 23: US Export and Import Value & Volume, 2023-2030 ($)
Figure 24: Canada Manifold Absolute Pressure (MAP) Sensor Market Value & Volume, 2023-2030 ($)
Figure 25: Canada GDP and Population, 2023-2030 ($)
Figure 26: Canada GDP – Composition of 2023, By Sector of Origin
Figure 27: Canada Export and Import Value & Volume, 2023-2030 ($)
Figure 28: Mexico Manifold Absolute Pressure (MAP) Sensor Market Value & Volume, 2023-2030 ($)
Figure 29: Mexico GDP and Population, 2023-2030 ($)
Figure 30: Mexico GDP – Composition of 2023, By Sector of Origin
Figure 31: Mexico Export and Import Value & Volume, 2023-2030 ($)
Figure 32: South America Manifold Absolute Pressure (MAP) Sensor Market Value & Volume, 2023-2030 ($)
Figure 33: Brazil Manifold Absolute Pressure (MAP) Sensor Market Value & Volume, 2023-2030 ($)
Figure 34: Brazil GDP and Population, 2023-2030 ($)
Figure 35: Brazil GDP – Composition of 2023, By Sector of Origin
Figure 36: Brazil Export and Import Value & Volume, 2023-2030 ($)
Figure 37: Venezuela Manifold Absolute Pressure (MAP) Sensor Market Value & Volume, 2023-2030 ($)
Figure 38: Venezuela GDP and Population, 2023-2030 ($)
Figure 39: Venezuela GDP – Composition of 2023, By Sector of Origin
Figure 40: Venezuela Export and Import Value & Volume, 2023-2030 ($)
Figure 41: Argentina Manifold Absolute Pressure (MAP) Sensor Market Value & Volume, 2023-2030 ($)
Figure 42: Argentina GDP and Population, 2023-2030 ($)
Figure 43: Argentina GDP – Composition of 2023, By Sector of Origin
Figure 44: Argentina Export and Import Value & Volume, 2023-2030 ($)
Figure 45: Ecuador Manifold Absolute Pressure (MAP) Sensor Market Value & Volume, 2023-2030 ($)
Figure 46: Ecuador GDP and Population, 2023-2030 ($)
Figure 47: Ecuador GDP – Composition of 2023, By Sector of Origin
Figure 48: Ecuador Export and Import Value & Volume, 2023-2030 ($)
Figure 49: Peru Manifold Absolute Pressure (MAP) Sensor Market Value & Volume, 2023-2030 ($)
Figure 50: Peru GDP and Population, 2023-2030 ($)
Figure 51: Peru GDP – Composition of 2023, By Sector of Origin
Figure 52: Peru Export and Import Value & Volume, 2023-2030 ($)
Figure 53: Colombia Manifold Absolute Pressure (MAP) Sensor Market Value & Volume, 2023-2030 ($)
Figure 54: Colombia GDP and Population, 2023-2030 ($)
Figure 55: Colombia GDP – Composition of 2023, By Sector of Origin
Figure 56: Colombia Export and Import Value & Volume, 2023-2030 ($)
Figure 57: Costa Rica Manifold Absolute Pressure (MAP) Sensor Market Value & Volume, 2023-2030 ($)
Figure 58: Costa Rica GDP and Population, 2023-2030 ($)
Figure 59: Costa Rica GDP – Composition of 2023, By Sector of Origin
Figure 60: Costa Rica Export and Import Value & Volume, 2023-2030 ($)
Figure 61: Europe Manifold Absolute Pressure (MAP) Sensor Market Value & Volume, 2023-2030 ($)
Figure 62: U.K Manifold Absolute Pressure (MAP) Sensor Market Value & Volume, 2023-2030 ($)
Figure 63: U.K GDP and Population, 2023-2030 ($)
Figure 64: U.K GDP – Composition of 2023, By Sector of Origin
Figure 65: U.K Export and Import Value & Volume, 2023-2030 ($)
Figure 66: Germany Manifold Absolute Pressure (MAP) Sensor Market Value & Volume, 2023-2030 ($)
Figure 67: Germany GDP and Population, 2023-2030 ($)
Figure 68: Germany GDP – Composition of 2023, By Sector of Origin
Figure 69: Germany Export and Import Value & Volume, 2023-2030 ($)
Figure 70: Italy Manifold Absolute Pressure (MAP) Sensor Market Value & Volume, 2023-2030 ($)
Figure 71: Italy GDP and Population, 2023-2030 ($)
Figure 72: Italy GDP – Composition of 2023, By Sector of Origin
Figure 73: Italy Export and Import Value & Volume, 2023-2030 ($)
Figure 74: France Manifold Absolute Pressure (MAP) Sensor Market Value & Volume, 2023-2030 ($)
Figure 75: France GDP and Population, 2023-2030 ($)
Figure 76: France GDP – Composition of 2023, By Sector of Origin
Figure 77: France Export and Import Value & Volume, 2023-2030 ($)
Figure 78: Netherlands Manifold Absolute Pressure (MAP) Sensor Market Value & Volume, 2023-2030 ($)
Figure 79: Netherlands GDP and Population, 2023-2030 ($)
Figure 80: Netherlands GDP – Composition of 2023, By Sector of Origin
Figure 81: Netherlands Export and Import Value & Volume, 2023-2030 ($)
Figure 82: Belgium Manifold Absolute Pressure (MAP) Sensor Market Value & Volume, 2023-2030 ($)
Figure 83: Belgium GDP and Population, 2023-2030 ($)
Figure 84: Belgium GDP – Composition of 2023, By Sector of Origin
Figure 85: Belgium Export and Import Value & Volume, 2023-2030 ($)
Figure 86: Spain Manifold Absolute Pressure (MAP) Sensor Market Value & Volume, 2023-2030 ($)
Figure 87: Spain GDP and Population, 2023-2030 ($)
Figure 88: Spain GDP – Composition of 2023, By Sector of Origin
Figure 89: Spain Export and Import Value & Volume, 2023-2030 ($)
Figure 90: Denmark Manifold Absolute Pressure (MAP) Sensor Market Value & Volume, 2023-2030 ($)
Figure 91: Denmark GDP and Population, 2023-2030 ($)
Figure 92: Denmark GDP – Composition of 2023, By Sector of Origin
Figure 93: Denmark Export and Import Value & Volume, 2023-2030 ($)
Figure 94: APAC Manifold Absolute Pressure (MAP) Sensor Market Value & Volume, 2023-2030 ($)
Figure 95: China Manifold Absolute Pressure (MAP) Sensor Market Value & Volume, 2023-2030
Figure 96: China GDP and Population, 2023-2030 ($)
Figure 97: China GDP – Composition of 2023, By Sector of Origin
Figure 98: China Export and Import Value & Volume, 2023-2030 ($)Manifold Absolute Pressure (MAP) Sensor Market China Export and Import Value & Volume, 2023-2030 ($)
Figure 99: Australia Manifold Absolute Pressure (MAP) Sensor Market Value & Volume, 2023-2030 ($)
Figure 100: Australia GDP and Population, 2023-2030 ($)
Figure 101: Australia GDP – Composition of 2023, By Sector of Origin
Figure 102: Australia Export and Import Value & Volume, 2023-2030 ($)
Figure 103: South Korea Manifold Absolute Pressure (MAP) Sensor Market Value & Volume, 2023-2030 ($)
Figure 104: South Korea GDP and Population, 2023-2030 ($)
Figure 105: South Korea GDP – Composition of 2023, By Sector of Origin
Figure 106: South Korea Export and Import Value & Volume, 2023-2030 ($)
Figure 107: India Manifold Absolute Pressure (MAP) Sensor Market Value & Volume, 2023-2030 ($)
Figure 108: India GDP and Population, 2023-2030 ($)
Figure 109: India GDP – Composition of 2023, By Sector of Origin
Figure 110: India Export and Import Value & Volume, 2023-2030 ($)
Figure 111: Taiwan Manifold Absolute Pressure (MAP) Sensor Market Value & Volume, 2023-2030 ($)
Figure 112: Taiwan GDP and Population, 2023-2030 ($)
Figure 113: Taiwan GDP – Composition of 2023, By Sector of Origin
Figure 114: Taiwan Export and Import Value & Volume, 2023-2030 ($)
Figure 115: Malaysia Manifold Absolute Pressure (MAP) Sensor Market Value & Volume, 2023-2030 ($)
Figure 116: Malaysia GDP and Population, 2023-2030 ($)
Figure 117: Malaysia GDP – Composition of 2023, By Sector of Origin
Figure 118: Malaysia Export and Import Value & Volume, 2023-2030 ($)
Figure 119: Hong Kong Manifold Absolute Pressure (MAP) Sensor Market Value & Volume, 2023-2030 ($)
Figure 120: Hong Kong GDP and Population, 2023-2030 ($)
Figure 121: Hong Kong GDP – Composition of 2023, By Sector of Origin
Figure 122: Hong Kong Export and Import Value & Volume, 2023-2030 ($)
Figure 123: Middle East & Africa Manifold Absolute Pressure (MAP) Sensor Market Middle East & Africa 3D Printing Market Value & Volume, 2023-2030 ($)
Figure 124: Russia Manifold Absolute Pressure (MAP) Sensor Market Value & Volume, 2023-2030 ($)
Figure 125: Russia GDP and Population, 2023-2030 ($)
Figure 126: Russia GDP – Composition of 2023, By Sector of Origin
Figure 127: Russia Export and Import Value & Volume, 2023-2030 ($)
Figure 128: Israel Manifold Absolute Pressure (MAP) Sensor Market Value & Volume, 2023-2030 ($)
Figure 129: Israel GDP and Population, 2023-2030 ($)
Figure 130: Israel GDP – Composition of 2023, By Sector of Origin
Figure 131: Israel Export and Import Value & Volume, 2023-2030 ($)
Figure 132: Entropy Share, By Strategies, 2023-2030* (%)Manifold Absolute Pressure (MAP) Sensor Market
Figure 133: Developments, 2023-2030*Manifold Absolute Pressure (MAP) Sensor Market
Figure 134: Company 1 Manifold Absolute Pressure (MAP) Sensor Market Net Revenue, By Years, 2023-2030* ($)
Figure 135: Company 1 Manifold Absolute Pressure (MAP) Sensor Market Net Revenue Share, By Business segments, 2023 (%)
Figure 136: Company 1 Manifold Absolute Pressure (MAP) Sensor Market Net Sales Share, By Geography, 2023 (%)
Figure 137: Company 2 Manifold Absolute Pressure (MAP) Sensor Market Net Revenue, By Years, 2023-2030* ($)
Figure 138: Company 2 Manifold Absolute Pressure (MAP) Sensor Market Net Revenue Share, By Business segments, 2023 (%)
Figure 139: Company 2 Manifold Absolute Pressure (MAP) Sensor Market Net Sales Share, By Geography, 2023 (%)
Figure 140: Company 3 Manifold Absolute Pressure (MAP) Sensor Market Net Revenue, By Years, 2023-2030* ($)
Figure 141: Company 3 Manifold Absolute Pressure (MAP) Sensor Market Net Revenue Share, By Business segments, 2023 (%)
Figure 142: Company 3 Manifold Absolute Pressure (MAP) Sensor Market Net Sales Share, By Geography, 2023 (%)
Figure 143: Company 4 Manifold Absolute Pressure (MAP) Sensor Market Net Revenue, By Years, 2023-2030* ($)
Figure 144: Company 4 Manifold Absolute Pressure (MAP) Sensor Market Net Revenue Share, By Business segments, 2023 (%)
Figure 145: Company 4 Manifold Absolute Pressure (MAP) Sensor Market Net Sales Share, By Geography, 2023 (%)
Figure 146: Company 5 Manifold Absolute Pressure (MAP) Sensor Market Net Revenue, By Years, 2023-2030* ($)
Figure 147: Company 5 Manifold Absolute Pressure (MAP) Sensor Market Net Revenue Share, By Business segments, 2023 (%)
Figure 148: Company 5 Manifold Absolute Pressure (MAP) Sensor Market Net Sales Share, By Geography, 2023 (%)
Figure 149: Company 6 Manifold Absolute Pressure (MAP) Sensor Market Net Revenue, By Years, 2023-2030* ($)
Figure 150: Company 6 Manifold Absolute Pressure (MAP) Sensor Market Net Revenue Share, By Business segments, 2023 (%)
Figure 151: Company 6 Manifold Absolute Pressure (MAP) Sensor Market Net Sales Share, By Geography, 2023 (%)
Figure 152: Company 7 Manifold Absolute Pressure (MAP) Sensor Market Net Revenue, By Years, 2023-2030* ($)
Figure 153: Company 7 Manifold Absolute Pressure (MAP) Sensor Market Net Revenue Share, By Business segments, 2023 (%)
Figure 154: Company 7 Manifold Absolute Pressure (MAP) Sensor Market Net Sales Share, By Geography, 2023 (%)
Figure 155: Company 8 Manifold Absolute Pressure (MAP) Sensor Market Net Revenue, By Years, 2023-2030* ($)
Figure 156: Company 8 Manifold Absolute Pressure (MAP) Sensor Market Net Revenue Share, By Business segments, 2023 (%)
Figure 157: Company 8 Manifold Absolute Pressure (MAP) Sensor Market Net Sales Share, By Geography, 2023 (%)
Figure 158: Company 9 Manifold Absolute Pressure (MAP) Sensor Market Net Revenue, By Years, 2023-2030* ($)
Figure 159: Company 9 Manifold Absolute Pressure (MAP) Sensor Market Net Revenue Share, By Business segments, 2023 (%)
Figure 160: Company 9 Manifold Absolute Pressure (MAP) Sensor Market Net Sales Share, By Geography, 2023 (%)
Figure 161: Company 10 Manifold Absolute Pressure (MAP) Sensor Market Net Revenue, By Years, 2023-2030* ($)
Figure 162: Company 10 Manifold Absolute Pressure (MAP) Sensor Market Net Revenue Share, By Business segments, 2023 (%)
Figure 163: Company 10 Manifold Absolute Pressure (MAP) Sensor Market Net Sales Share, By Geography, 2023 (%)
Figure 164: Company 11 Manifold Absolute Pressure (MAP) Sensor Market Net Revenue, By Years, 2023-2030* ($)
Figure 165: Company 11 Manifold Absolute Pressure (MAP) Sensor Market Net Revenue Share, By Business segments, 2023 (%)
Figure 166: Company 11 Manifold Absolute Pressure (MAP) Sensor Market Net Sales Share, By Geography, 2023 (%)
Figure 167: Company 12 Manifold Absolute Pressure (MAP) Sensor Market Net Revenue, By Years, 2023-2030* ($)
Figure 168: Company 12 Manifold Absolute Pressure (MAP) Sensor Market Net Revenue Share, By Business segments, 2023 (%)
Figure 169: Company 12 Manifold Absolute Pressure (MAP) Sensor Market Net Sales Share, By Geography, 2023 (%)
Figure 170: Company 13 Manifold Absolute Pressure (MAP) Sensor Market Net Revenue, By Years, 2023-2030* ($)
Figure 171: Company 13 Manifold Absolute Pressure (MAP) Sensor Market Net Revenue Share, By Business segments, 2023 (%)
Figure 172: Company 13 Manifold Absolute Pressure (MAP) Sensor Market Net Sales Share, By Geography, 2023 (%)
Figure 173: Company 14 Manifold Absolute Pressure (MAP) Sensor Market Net Revenue, By Years, 2023-2030* ($)
Figure 174: Company 14 Manifold Absolute Pressure (MAP) Sensor Market Net Revenue Share, By Business segments, 2023 (%)
Figure 175: Company 14 Manifold Absolute Pressure (MAP) Sensor Market Net Sales Share, By Geography, 2023 (%)
Figure 176: Company 15 Manifold Absolute Pressure (MAP) Sensor Market Net Revenue, By Years, 2023-2030* ($)
Figure 177: Company 15 Manifold Absolute Pressure (MAP) Sensor Market Net Revenue Share, By Business segments, 2023 (%)
Figure 178: Company 15 Manifold Absolute Pressure (MAP) Sensor Market Net Sales Share, By Geography, 2023 (%)