 Email
Email Print
Print


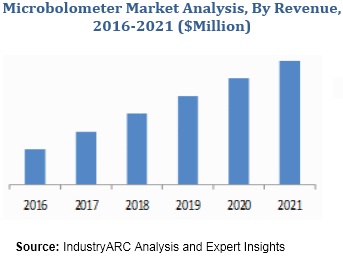
The biggest driving force for the growth of microbolometers market is the fact that it helps to overcome the use of exotic and expensive cooling methods in a thermal imaging camera. They also are smaller form factor, lower power consumption, cheaper, reliable, and lightweight unlike other substitute technologies. These factors of microbolometers are fueling the application of thermal cameras into next generation commercial applications.
The major microbolometers and thermal camera manufacturers are focusing to address low cost applications and high-volume markets by investing largely on R&D to develop detector materials such as VOX and a-Si. The report focuses on major two types of materials used in microbolometers amorphous silicon (a-Si) and vanadium oxide (VOX); wherein currently VOX has dominant share in the market.
The report also gives in-depth insights on different application markets served by microbolometers; among those are automotive, aerospace & defense, thermography, and vision enhancement. Safety regulations mandate in the U.S. and few countries in Europe have trigged the use of thermal cameras in passenger cars and light commercial vehicles. Owing to the compact size and cost-effectiveness of microbolometers the demand for thermal imaging systems in commercial applications is ever increasing.
The report gives analysis of various factors such as demand and supply side factors, market dynamics, and driving and inhibiting forces in the microbolometers market. The pricing analysis of microbolometers and its impact on value chain of the industry is also analyzed in the report. The opportunity matrix, product lifecycle analysis and mapping of major suppliers and OEMs are also covered in the report extensively.
The report analyzes the different geographic markets such as North America, Europe, Asia-Pacific, South America, and Middle-East and Africa. Likewise, market insights on country level with special focus on leading developed and developing nations is also covered in the report.
The competitiveness among the microbolometers players is measured based on the business developments strategies adopted such as new product launches and developments, mergers and acquisitions, partnerships, and collaborations.
The leading microbolometers profiled in the report are
- BAE Systems
- ULIS
- Fluke Corporation
- Teledyne DALSA
- Seek Thermal Inc
1. Microbolometer Market - Overview
1.1. Definitions and Scope
2. Microbolometer Market - Executive summary
2.1. Market Revenue, Market Size and Key Trends by Company
2.2. Key Trends by type of Application
2.3. Key Trends segmented by Geography
3. Microbolometer Market
3.1. Comparative analysis
3.1.1. Product Benchmarking - Top 10 companies
3.1.2. Top 5 Financials Analysis
3.1.3. Market Value split by Top 10 companies
3.1.4. Patent Analysis - Top 10 companies
3.1.5. Pricing Analysis
4. Microbolometer Market – Startup companies Scenario Premium
4.1. Top 10 startup company Analysis by
4.1.1. Investment
4.1.2. Revenue
4.1.3. Market Shares
4.1.4. Market Size and Application Analysis
4.1.5. Venture Capital and Funding Scenario
5. Microbolometer Market – Industry Market Entry Scenario Premium
5.1. Regulatory Framework Overview
5.2. New Business and Ease of Doing business index
5.3. Case studies of successful ventures
5.4. Customer Analysis – Top 10 companies
6. Microbolometer Market Forces
6.1. Drivers
6.2. Constraints
6.3. Challenges
6.4. Porters five force model
6.4.1. Bargaining power of suppliers
6.4.2. Bargaining powers of customers
6.4.3. Threat of new entrants
6.4.4. Rivalry among existing players
6.4.5. Threat of substitutes
7. Microbolometer Market -Strategic analysis
7.1. Value chain analysis
7.2. Opportunities analysis
7.3. Product life cycle
7.4. Suppliers and distributors Market Share
8. Microbolometer Market – By Format (Market Size -$Million / $Billion)
8.1. Market Size and Market Share Analysis
8.2. Application Revenue and Trend Research
8.3. Product Segment Analysis
8.3.1. Small
8.3.2. Medium
8.3.3. Large
9. Microbolometer Market – By Materials (Market Size -$Million / $Billion)
9.1. Amorphous Silicon (a-Si)
9.2. Vanadium-oxide (VOX)
10. Microbolometer Market – By Application (Market Size -$Million / $Billion)
10.1. Aerospace & Defense
10.2. Automotive
10.3. Video Surveillance
10.4. Thermography
10.5. Vision Enhancement
11. Microbolometer - By Geography (Market Size -$Million / $Billion)
11.1. Microbolometer Market - North America Segment Research
11.2. North America Market Research (Million / $Billion)
11.2.1. Segment type Size and Market Size Analysis
11.2.2. Revenue and Trends
11.2.3. Application Revenue and Trends by type of Application
11.2.4. Company Revenue and Product Analysis
11.2.5. North America Product type and Application Market Size
11.2.5.1. U.S.
11.2.5.2. Canada
11.2.5.3. Mexico
11.2.5.4. Rest of North America
11.3. Microbolometer - South America Segment Research
11.4. South America Market Research (Market Size -$Million / $Billion)
11.4.1. Segment type Size and Market Size Analysis
11.4.2. Revenue and Trends
11.4.3. Application Revenue and Trends by type of Application
11.4.4. Company Revenue and Product Analysis
11.4.5. South America Product type and Application Market Size
11.4.5.1. Brazil
11.4.5.2. Venezuela
11.4.5.3. Argentina
11.4.5.4. Ecuador
11.4.5.5. Peru
11.4.5.6. Colombia
11.4.5.7. Costa Rica
11.4.5.8. Rest of South America
11.5. Microbolometer - Europe Segment Research
11.6. Europe Market Research (Market Size -$Million / $Billion)
11.6.1. Segment type Size and Market Size Analysis
11.6.2. Revenue and Trends
11.6.3. Application Revenue and Trends by type of Application
11.6.4. Company Revenue and Product Analysis
11.6.5. Europe Segment Product type and Application Market Size
11.6.5.1. U.K
11.6.5.2. Germany
11.6.5.3. Italy
11.6.5.4. France
11.6.5.5. Netherlands
11.6.5.6. Belgium
11.6.5.7. Spain
11.6.5.8. Denmark
11.6.5.9. Rest of Europe
11.7. Microbolometer – APAC Segment Research
11.8. APAC Market Research (Market Size -$Million / $Billion)
11.8.1. Segment type Size and Market Size Analysis
11.8.2. Revenue and Trends
11.8.3. Application Revenue and Trends by type of Application
11.8.4. Company Revenue and Product Analysis
11.8.5. APAC Segment – Product type and Application Market Size
11.8.5.1. China
11.8.5.2. Australia
11.8.5.3. Japan
11.8.5.4. South Korea
11.8.5.5. India
11.8.5.6. Taiwan
11.8.5.7. Malaysia
12. Microbolometer Market - Entropy
12.1. New product launches
12.2. M&A's, collaborations, JVs and partnerships
13. Microbolometer Market – Industry / Segment Competition landscape Premium
13.1. Market Share Analysis
13.1.1. Market Share by Country- Top companies
13.1.2. Market Share by Region- Top 10 companies
13.1.3. Market Share by type of Application – Top 10 companies
13.1.4. Market Share by type of Product / Product category- Top 10 companies
13.1.5. Market Share at global level- Top 10 companies
13.1.6. Best Practises for companies
14. Microbolometer Market – Key Company List by Country Premium
15. Microbolometer Market Company Analysis
15.1. Market Share, Company Revenue, Products, M&A, Developments
15.2. BAE Systems
15.3. ULIS
15.4. Fluke Corporation
15.5. Teledyne DALSA
15.6. Seek Thermal Inc
15.7. Company 6
15.8. Company 7
15.9. Company 8
15.10. Company 9
15.11. Company 10
"*Financials would be provided on a best efforts basis for private companies"
16. Microbolometer Market -Appendix
16.1. Abbreviations
16.2. Sources
17. Microbolometer Market -Methodology Premium
17.1. Research Methodology
17.1.1. Company Expert Interviews
17.1.2. Industry Databases
17.1.3. Associations
17.1.4. Company News
17.1.5. Company Annual Reports
17.1.6. Application Trends
17.1.7. New Products and Product database
17.1.8. Company Transcripts
17.1.9. R&D Trends
17.1.10. Key Opinion Leaders Interviews
17.1.11. Supply and Demand Trends
List of Tables
Table1: Microbolometer Market Overview 2023-2030
Table2: Microbolometer Market Leader Analysis 2023-2030 (US$)
Table3: Microbolometer Market Product Analysis 2023-2030 (US$)
Table4: Microbolometer Market End User Analysis 2023-2030 (US$)
Table5: Microbolometer Market Patent Analysis 2013-2023* (US$)
Table6: Microbolometer Market Financial Analysis 2023-2030 (US$)
Table7: Microbolometer Market Driver Analysis 2023-2030 (US$)
Table8: Microbolometer Market Challenges Analysis 2023-2030 (US$)
Table9: Microbolometer Market Constraint Analysis 2023-2030 (US$)
Table10: Microbolometer Market Supplier Bargaining Power Analysis 2023-2030 (US$)
Table11: Microbolometer Market Buyer Bargaining Power Analysis 2023-2030 (US$)
Table12: Microbolometer Market Threat of Substitutes Analysis 2023-2030 (US$)
Table13: Microbolometer Market Threat of New Entrants Analysis 2023-2030 (US$)
Table14: Microbolometer Market Degree of Competition Analysis 2023-2030 (US$)
Table15: Microbolometer Market Value Chain Analysis 2023-2030 (US$)
Table16: Microbolometer Market Pricing Analysis 2023-2030 (US$)
Table17: Microbolometer Market Opportunities Analysis 2023-2030 (US$)
Table18: Microbolometer Market Product Life Cycle Analysis 2023-2030 (US$)
Table19: Microbolometer Market Supplier Analysis 2023-2030 (US$)
Table20: Microbolometer Market Distributor Analysis 2023-2030 (US$)
Table21: Microbolometer Market Trend Analysis 2023-2030 (US$)
Table22: Microbolometer Market Size 2023 (US$)
Table23: Microbolometer Market Forecast Analysis 2023-2030 (US$)
Table24: Microbolometer Market Sales Forecast Analysis 2023-2030 (Units)
Table25: Microbolometer Market, Revenue & Volume, By Format, 2023-2030 ($)
Table26: Microbolometer Market By Format, Revenue & Volume, By Small, 2023-2030 ($)
Table27: Microbolometer Market By Format, Revenue & Volume, By Medium, 2023-2030 ($)
Table28: Microbolometer Market By Format, Revenue & Volume, By Large, 2023-2030 ($)
Table29: Microbolometer Market, Revenue & Volume, By Materials, 2023-2030 ($)
Table30: Microbolometer Market By Materials, Revenue & Volume, By Amorphous Silicon (a-Si), 2023-2030 ($)
Table31: Microbolometer Market By Materials, Revenue & Volume, By Vanadium-oxide (VOX), 2023-2030 ($)
Table32: Microbolometer Market, Revenue & Volume, By Application, 2023-2030 ($)
Table33: Microbolometer Market By Application, Revenue & Volume, By Aerospace & Defense, 2023-2030 ($)
Table34: Microbolometer Market By Application, Revenue & Volume, By Automotive, 2023-2030 ($)
Table35: Microbolometer Market By Application, Revenue & Volume, By Video Surveillance, 2023-2030 ($)
Table36: Microbolometer Market By Application, Revenue & Volume, By Thermography, 2023-2030 ($)
Table37: Microbolometer Market By Application, Revenue & Volume, By Vision Enhancement, 2023-2030 ($)
Table38: North America Microbolometer Market, Revenue & Volume, By Format, 2023-2030 ($)
Table39: North America Microbolometer Market, Revenue & Volume, By Materials, 2023-2030 ($)
Table40: North America Microbolometer Market, Revenue & Volume, By Application, 2023-2030 ($)
Table41: South america Microbolometer Market, Revenue & Volume, By Format, 2023-2030 ($)
Table42: South america Microbolometer Market, Revenue & Volume, By Materials, 2023-2030 ($)
Table43: South america Microbolometer Market, Revenue & Volume, By Application, 2023-2030 ($)
Table44: Europe Microbolometer Market, Revenue & Volume, By Format, 2023-2030 ($)
Table45: Europe Microbolometer Market, Revenue & Volume, By Materials, 2023-2030 ($)
Table46: Europe Microbolometer Market, Revenue & Volume, By Application, 2023-2030 ($)
Table47: APAC Microbolometer Market, Revenue & Volume, By Format, 2023-2030 ($)
Table48: APAC Microbolometer Market, Revenue & Volume, By Materials, 2023-2030 ($)
Table49: APAC Microbolometer Market, Revenue & Volume, By Application, 2023-2030 ($)
Table50: Middle East & Africa Microbolometer Market, Revenue & Volume, By Format, 2023-2030 ($)
Table51: Middle East & Africa Microbolometer Market, Revenue & Volume, By Materials, 2023-2030 ($)
Table52: Middle East & Africa Microbolometer Market, Revenue & Volume, By Application, 2023-2030 ($)
Table53: Russia Microbolometer Market, Revenue & Volume, By Format, 2023-2030 ($)
Table54: Russia Microbolometer Market, Revenue & Volume, By Materials, 2023-2030 ($)
Table55: Russia Microbolometer Market, Revenue & Volume, By Application, 2023-2030 ($)
Table56: Israel Microbolometer Market, Revenue & Volume, By Format, 2023-2030 ($)
Table57: Israel Microbolometer Market, Revenue & Volume, By Materials, 2023-2030 ($)
Table58: Israel Microbolometer Market, Revenue & Volume, By Application, 2023-2030 ($)
Table59: Top Companies 2023 (US$)Microbolometer Market, Revenue & Volume
Table60: Product Launch 2023-2030Microbolometer Market, Revenue & Volume
Table61: Mergers & Acquistions 2023-2030Microbolometer Market, Revenue & Volume
List of Figures
Figure 1: Overview of Microbolometer Market 2023-2030
Figure 2: Market Share Analysis for Microbolometer Market 2023 (US$)
Figure 3: Product Comparison in Microbolometer Market 2023-2030 (US$)
Figure 4: End User Profile for Microbolometer Market 2023-2030 (US$)
Figure 5: Patent Application and Grant in Microbolometer Market 2013-2023* (US$)
Figure 6: Top 5 Companies Financial Analysis in Microbolometer Market 2023-2030 (US$)
Figure 7: Market Entry Strategy in Microbolometer Market 2023-2030
Figure 8: Ecosystem Analysis in Microbolometer Market 2023
Figure 9: Average Selling Price in Microbolometer Market 2023-2030
Figure 10: Top Opportunites in Microbolometer Market 2023-2030
Figure 11: Market Life Cycle Analysis in Microbolometer Market
Figure 12: GlobalBy FormatMicrobolometer Market Revenue, 2023-2030 ($)
Figure 13: GlobalBy MaterialsMicrobolometer Market Revenue, 2023-2030 ($)
Figure 14: GlobalBy ApplicationMicrobolometer Market Revenue, 2023-2030 ($)
Figure 15: Global Microbolometer Market - By Geography
Figure 16: Global Microbolometer Market Value & Volume, By Geography, 2023-2030 ($)
Figure 17: Global Microbolometer Market CAGR, By Geography, 2023-2030 (%)
Figure 18: North America Microbolometer Market Value & Volume, 2023-2030 ($)
Figure 19: US Microbolometer Market Value & Volume, 2023-2030 ($)
Figure 20: US GDP and Population, 2023-2030 ($)
Figure 21: US GDP – Composition of 2023, By Sector of Origin
Figure 22: US Export and Import Value & Volume, 2023-2030 ($)
Figure 23: Canada Microbolometer Market Value & Volume, 2023-2030 ($)
Figure 24: Canada GDP and Population, 2023-2030 ($)
Figure 25: Canada GDP – Composition of 2023, By Sector of Origin
Figure 26: Canada Export and Import Value & Volume, 2023-2030 ($)
Figure 27: Mexico Microbolometer Market Value & Volume, 2023-2030 ($)
Figure 28: Mexico GDP and Population, 2023-2030 ($)
Figure 29: Mexico GDP – Composition of 2023, By Sector of Origin
Figure 30: Mexico Export and Import Value & Volume, 2023-2030 ($)
Figure 31: South America Microbolometer Market Value & Volume, 2023-2030 ($)
Figure 32: Brazil Microbolometer Market Value & Volume, 2023-2030 ($)
Figure 33: Brazil GDP and Population, 2023-2030 ($)
Figure 34: Brazil GDP – Composition of 2023, By Sector of Origin
Figure 35: Brazil Export and Import Value & Volume, 2023-2030 ($)
Figure 36: Venezuela Microbolometer Market Value & Volume, 2023-2030 ($)
Figure 37: Venezuela GDP and Population, 2023-2030 ($)
Figure 38: Venezuela GDP – Composition of 2023, By Sector of Origin
Figure 39: Venezuela Export and Import Value & Volume, 2023-2030 ($)
Figure 40: Argentina Microbolometer Market Value & Volume, 2023-2030 ($)
Figure 41: Argentina GDP and Population, 2023-2030 ($)
Figure 42: Argentina GDP – Composition of 2023, By Sector of Origin
Figure 43: Argentina Export and Import Value & Volume, 2023-2030 ($)
Figure 44: Ecuador Microbolometer Market Value & Volume, 2023-2030 ($)
Figure 45: Ecuador GDP and Population, 2023-2030 ($)
Figure 46: Ecuador GDP – Composition of 2023, By Sector of Origin
Figure 47: Ecuador Export and Import Value & Volume, 2023-2030 ($)
Figure 48: Peru Microbolometer Market Value & Volume, 2023-2030 ($)
Figure 49: Peru GDP and Population, 2023-2030 ($)
Figure 50: Peru GDP – Composition of 2023, By Sector of Origin
Figure 51: Peru Export and Import Value & Volume, 2023-2030 ($)
Figure 52: Colombia Microbolometer Market Value & Volume, 2023-2030 ($)
Figure 53: Colombia GDP and Population, 2023-2030 ($)
Figure 54: Colombia GDP – Composition of 2023, By Sector of Origin
Figure 55: Colombia Export and Import Value & Volume, 2023-2030 ($)
Figure 56: Costa Rica Microbolometer Market Value & Volume, 2023-2030 ($)
Figure 57: Costa Rica GDP and Population, 2023-2030 ($)
Figure 58: Costa Rica GDP – Composition of 2023, By Sector of Origin
Figure 59: Costa Rica Export and Import Value & Volume, 2023-2030 ($)
Figure 60: Europe Microbolometer Market Value & Volume, 2023-2030 ($)
Figure 61: U.K Microbolometer Market Value & Volume, 2023-2030 ($)
Figure 62: U.K GDP and Population, 2023-2030 ($)
Figure 63: U.K GDP – Composition of 2023, By Sector of Origin
Figure 64: U.K Export and Import Value & Volume, 2023-2030 ($)
Figure 65: Germany Microbolometer Market Value & Volume, 2023-2030 ($)
Figure 66: Germany GDP and Population, 2023-2030 ($)
Figure 67: Germany GDP – Composition of 2023, By Sector of Origin
Figure 68: Germany Export and Import Value & Volume, 2023-2030 ($)
Figure 69: Italy Microbolometer Market Value & Volume, 2023-2030 ($)
Figure 70: Italy GDP and Population, 2023-2030 ($)
Figure 71: Italy GDP – Composition of 2023, By Sector of Origin
Figure 72: Italy Export and Import Value & Volume, 2023-2030 ($)
Figure 73: France Microbolometer Market Value & Volume, 2023-2030 ($)
Figure 74: France GDP and Population, 2023-2030 ($)
Figure 75: France GDP – Composition of 2023, By Sector of Origin
Figure 76: France Export and Import Value & Volume, 2023-2030 ($)
Figure 77: Netherlands Microbolometer Market Value & Volume, 2023-2030 ($)
Figure 78: Netherlands GDP and Population, 2023-2030 ($)
Figure 79: Netherlands GDP – Composition of 2023, By Sector of Origin
Figure 80: Netherlands Export and Import Value & Volume, 2023-2030 ($)
Figure 81: Belgium Microbolometer Market Value & Volume, 2023-2030 ($)
Figure 82: Belgium GDP and Population, 2023-2030 ($)
Figure 83: Belgium GDP – Composition of 2023, By Sector of Origin
Figure 84: Belgium Export and Import Value & Volume, 2023-2030 ($)
Figure 85: Spain Microbolometer Market Value & Volume, 2023-2030 ($)
Figure 86: Spain GDP and Population, 2023-2030 ($)
Figure 87: Spain GDP – Composition of 2023, By Sector of Origin
Figure 88: Spain Export and Import Value & Volume, 2023-2030 ($)
Figure 89: Denmark Microbolometer Market Value & Volume, 2023-2030 ($)
Figure 90: Denmark GDP and Population, 2023-2030 ($)
Figure 91: Denmark GDP – Composition of 2023, By Sector of Origin
Figure 92: Denmark Export and Import Value & Volume, 2023-2030 ($)
Figure 93: APAC Microbolometer Market Value & Volume, 2023-2030 ($)
Figure 94: China Microbolometer Market Value & Volume, 2023-2030
Figure 95: China GDP and Population, 2023-2030 ($)
Figure 96: China GDP – Composition of 2023, By Sector of Origin
Figure 97: China Export and Import Value & Volume, 2023-2030 ($)Microbolometer Market China Export and Import Value & Volume, 2023-2030 ($)
Figure 98: Australia Microbolometer Market Value & Volume, 2023-2030 ($)
Figure 99: Australia GDP and Population, 2023-2030 ($)
Figure 100: Australia GDP – Composition of 2023, By Sector of Origin
Figure 101: Australia Export and Import Value & Volume, 2023-2030 ($)
Figure 102: South Korea Microbolometer Market Value & Volume, 2023-2030 ($)
Figure 103: South Korea GDP and Population, 2023-2030 ($)
Figure 104: South Korea GDP – Composition of 2023, By Sector of Origin
Figure 105: South Korea Export and Import Value & Volume, 2023-2030 ($)
Figure 106: India Microbolometer Market Value & Volume, 2023-2030 ($)
Figure 107: India GDP and Population, 2023-2030 ($)
Figure 108: India GDP – Composition of 2023, By Sector of Origin
Figure 109: India Export and Import Value & Volume, 2023-2030 ($)
Figure 110: Taiwan Microbolometer Market Value & Volume, 2023-2030 ($)
Figure 111: Taiwan GDP and Population, 2023-2030 ($)
Figure 112: Taiwan GDP – Composition of 2023, By Sector of Origin
Figure 113: Taiwan Export and Import Value & Volume, 2023-2030 ($)
Figure 114: Malaysia Microbolometer Market Value & Volume, 2023-2030 ($)
Figure 115: Malaysia GDP and Population, 2023-2030 ($)
Figure 116: Malaysia GDP – Composition of 2023, By Sector of Origin
Figure 117: Malaysia Export and Import Value & Volume, 2023-2030 ($)
Figure 118: Hong Kong Microbolometer Market Value & Volume, 2023-2030 ($)
Figure 119: Hong Kong GDP and Population, 2023-2030 ($)
Figure 120: Hong Kong GDP – Composition of 2023, By Sector of Origin
Figure 121: Hong Kong Export and Import Value & Volume, 2023-2030 ($)
Figure 122: Middle East & Africa Microbolometer Market Middle East & Africa 3D Printing Market Value & Volume, 2023-2030 ($)
Figure 123: Russia Microbolometer Market Value & Volume, 2023-2030 ($)
Figure 124: Russia GDP and Population, 2023-2030 ($)
Figure 125: Russia GDP – Composition of 2023, By Sector of Origin
Figure 126: Russia Export and Import Value & Volume, 2023-2030 ($)
Figure 127: Israel Microbolometer Market Value & Volume, 2023-2030 ($)
Figure 128: Israel GDP and Population, 2023-2030 ($)
Figure 129: Israel GDP – Composition of 2023, By Sector of Origin
Figure 130: Israel Export and Import Value & Volume, 2023-2030 ($)
Figure 131: Entropy Share, By Strategies, 2023-2030* (%)Microbolometer Market
Figure 132: Developments, 2023-2030*Microbolometer Market
Figure 133: Company 1 Microbolometer Market Net Revenue, By Years, 2023-2030* ($)
Figure 134: Company 1 Microbolometer Market Net Revenue Share, By Business segments, 2023 (%)
Figure 135: Company 1 Microbolometer Market Net Sales Share, By Geography, 2023 (%)
Figure 136: Company 2 Microbolometer Market Net Revenue, By Years, 2023-2030* ($)
Figure 137: Company 2 Microbolometer Market Net Revenue Share, By Business segments, 2023 (%)
Figure 138: Company 2 Microbolometer Market Net Sales Share, By Geography, 2023 (%)
Figure 139: Company 3 Microbolometer Market Net Revenue, By Years, 2023-2030* ($)
Figure 140: Company 3 Microbolometer Market Net Revenue Share, By Business segments, 2023 (%)
Figure 141: Company 3 Microbolometer Market Net Sales Share, By Geography, 2023 (%)
Figure 142: Company 4 Microbolometer Market Net Revenue, By Years, 2023-2030* ($)
Figure 143: Company 4 Microbolometer Market Net Revenue Share, By Business segments, 2023 (%)
Figure 144: Company 4 Microbolometer Market Net Sales Share, By Geography, 2023 (%)
Figure 145: Company 5 Microbolometer Market Net Revenue, By Years, 2023-2030* ($)
Figure 146: Company 5 Microbolometer Market Net Revenue Share, By Business segments, 2023 (%)
Figure 147: Company 5 Microbolometer Market Net Sales Share, By Geography, 2023 (%)
Figure 148: Company 6 Microbolometer Market Net Revenue, By Years, 2023-2030* ($)
Figure 149: Company 6 Microbolometer Market Net Revenue Share, By Business segments, 2023 (%)
Figure 150: Company 6 Microbolometer Market Net Sales Share, By Geography, 2023 (%)
Figure 151: Company 7 Microbolometer Market Net Revenue, By Years, 2023-2030* ($)
Figure 152: Company 7 Microbolometer Market Net Revenue Share, By Business segments, 2023 (%)
Figure 153: Company 7 Microbolometer Market Net Sales Share, By Geography, 2023 (%)
Figure 154: Company 8 Microbolometer Market Net Revenue, By Years, 2023-2030* ($)
Figure 155: Company 8 Microbolometer Market Net Revenue Share, By Business segments, 2023 (%)
Figure 156: Company 8 Microbolometer Market Net Sales Share, By Geography, 2023 (%)
Figure 157: Company 9 Microbolometer Market Net Revenue, By Years, 2023-2030* ($)
Figure 158: Company 9 Microbolometer Market Net Revenue Share, By Business segments, 2023 (%)
Figure 159: Company 9 Microbolometer Market Net Sales Share, By Geography, 2023 (%)
Figure 160: Company 10 Microbolometer Market Net Revenue, By Years, 2023-2030* ($)
Figure 161: Company 10 Microbolometer Market Net Revenue Share, By Business segments, 2023 (%)
Figure 162: Company 10 Microbolometer Market Net Sales Share, By Geography, 2023 (%)
Figure 163: Company 11 Microbolometer Market Net Revenue, By Years, 2023-2030* ($)
Figure 164: Company 11 Microbolometer Market Net Revenue Share, By Business segments, 2023 (%)
Figure 165: Company 11 Microbolometer Market Net Sales Share, By Geography, 2023 (%)
Figure 166: Company 12 Microbolometer Market Net Revenue, By Years, 2023-2030* ($)
Figure 167: Company 12 Microbolometer Market Net Revenue Share, By Business segments, 2023 (%)
Figure 168: Company 12 Microbolometer Market Net Sales Share, By Geography, 2023 (%)
Figure 169: Company 13 Microbolometer Market Net Revenue, By Years, 2023-2030* ($)
Figure 170: Company 13 Microbolometer Market Net Revenue Share, By Business segments, 2023 (%)
Figure 171: Company 13 Microbolometer Market Net Sales Share, By Geography, 2023 (%)
Figure 172: Company 14 Microbolometer Market Net Revenue, By Years, 2023-2030* ($)
Figure 173: Company 14 Microbolometer Market Net Revenue Share, By Business segments, 2023 (%)
Figure 174: Company 14 Microbolometer Market Net Sales Share, By Geography, 2023 (%)
Figure 175: Company 15 Microbolometer Market Net Revenue, By Years, 2023-2030* ($)
Figure 176: Company 15 Microbolometer Market Net Revenue Share, By Business segments, 2023 (%)
Figure 177: Company 15 Microbolometer Market Net Sales Share, By Geography, 2023 (%)