 Email
Email Print
Print


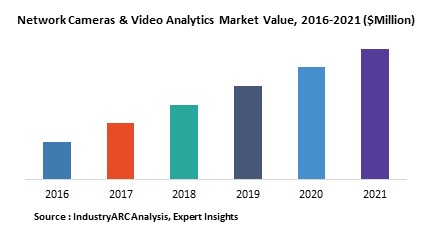
Network Cameras & Video Analytics Market - Forecast(2024 - 2030)
Public, government institutions, military & defense bases, and commercial structures safety issues are prime concern in todays world. Network cameras in association with video content analytics have been so far successfully addressed safety concerns, owing to the fact that network cameras and video analytics work together on cloud platform for better analytics. The biggest aid of the technology is to provide real time analysis and provide instant threat alerts to the security systems. These factors have enabled the growth of both the network cameras and video analytics market. With increasing awareness more and more people are now relying on these technologies which in turn are driving the momentum in the production and supply among the vendors of network cameras and service providers of video analytics.
The report gives comprehensive analysis of different aspects of both network cameras and video content analytics market. The network cameras analyzed in the report are based on different types, technologies, resolution, and application. The cameras are analog and digital with different image sensor type, connectivity technology and image processing technology. The resolution types covered are HD, SD, and megapixel, whereas the different types are fixed, dome, and PTZ. The network camera finds its application in Commercial Security, Aerospace & Defense Security, Border Security, Hospitality & Entertainment, and Residential Security. Apart from this, the report also covers the regional North America, Europe, APAC, South America, and Middle-East & Africa specific analysis and country level analysis on developing and developed markets.
In case of video analytics market the report focuses on the different architectures, software types, and applications. The architectures covered are server and edge based; the software types are detection, recognition, and crowd management; and the applications are Commercial, Residential, Transportation & Logistics, Hospitality & Entertainment, Border Security, Aerospace & Defense, and Government & Institutional. The geographical and country level analysis is also covered for video analytics market with regional coverage of North America, Europe, APAC, South America, and Middle-East & Africa.
Sample Companies profiled in this report are:
- ADT Security
- Cisco
- Hikvision
- Bosch Security
- Agent Video Intelligence
- 10+.
The market entropy section includes the market competitiveness based on the business developments strategies adopted which are new product launches and developments, partnerships, agreement, R&D investments, collaborations, JVs, and expansions by the leading vendors.
1. Network Cameras & Video Analytics Market Overview
2. Executive Summary
3. Network Cameras & Video Analytics Market Landscape
3.1. Market Share Analysis
3.2. Comparative Analysis
3.2.1. Product Benchmarking
3.2.2. End-User Profiling
3.2.3. Financial Analysis of Top 5 Players
4. Network Cameras & Video Analytics Market Forces
4.1. Market Drivers
4.2. Market Constraints
4.3. Market Challenges
4.4. Attractiveness of Industry
4.4.1. Power of Supplier
4.4.2. Power of Consumer
4.4.3. Threat of New Entrant
4.4.4. Threat of Substitute
4.4.5. Degree of Competition
5. Network Cameras & Video Analytics Market Strategic Analysis
5.1. Value Chain Analysis
5.2. Pricing Analysis
5.3. Opportunity Analysis
5.4. Product Life Cycle Analysis
5.5. Supplier & Distributor Analysis
6. Network Cameras Market
6.1. Network Cameras Market By Technology
6.1.1. Analog
6.1.1.1. Connectivity PoE and Wi-Fi
6.1.1.2. Components CCD and CMOS
6.1.1.3. Image Processing & Video Compression M-JPEG, MPEG, H.264
6.1.2. Digital
6.1.2.1. Connectivity PoE and Wi-Fi
6.1.2.2. Components CCD and CMOS
6.1.2.3. Image Processing & Video Compression M-JPEG, MPEG, H.264
6.2. Network Cameras Market By Resolution
6.2.1. SD
6.2.2. HD
6.2.3. Megapixel
6.3. Network Cameras Market By Type
6.3.1. Dome
6.3.2. Fixed
6.3.3. Pan/Tilt/Zoom (PTZ)
6.4. Network Cameras Market By Application
6.4.1. Commercial Security
6.4.2. Aerospace & Defense Security
6.4.3. Border Security
6.4.4. Hospitality & Entertainment
6.4.5. Residential Security
6.4.6. Government & Institutional Security
6.5. Network Cameras Market By Geography
6.5.1. North America
6.5.1.1. U.S.
6.5.1.2. Canada
6.5.1.3. Mexico
6.5.2. Europe
6.5.2.1. U.K.
6.5.2.2. Germany
6.5.2.3. France
6.5.2.4. Others
6.5.3. APAC
6.5.3.1. India
6.5.3.2. China
6.5.3.3. Japan
6.5.3.4. Others
6.5.4. South America
6.5.4.1. Brazil
6.5.4.2. Argentina
6.5.5. Middle-East & Africa
7. Video Analytics Market
7.1. Video Analytics Market By Architecture
7.1.1. Server Based
7.1.2. Edge Based
7.2. Video Analytics Market By Software
7.2.1. Detection
7.2.1.1. Intrusion
7.2.1.2. Motion
7.2.1.3. Object
7.2.1.4. Style/Pattern
7.2.1.5. Tamper
7.2.2. Recognition
7.2.2.1. Facial
7.2.2.2. License Plate
7.2.3. Crowd Management
7.2.3.1. Traffic Management
7.2.3.2. People Counting
7.3. Video Analytics Market By Application
7.3.1. Commercial
7.3.2. Residential
7.3.3. Transportation & Logistics
7.3.4. Hospitality & Entertainment
7.3.5. Border Security
7.3.6. Aerospace & Defense
7.3.7. Government & Institutional
7.4. Video Analytics Market By Geography
7.4.1. North America
7.4.1.1. U.S.
7.4.1.2. Canada
7.4.1.3. Mexico
7.4.2. Europe
7.4.2.1. U.K.
7.4.2.2. Germany
7.4.2.3. France
7.4.2.4. Others
7.4.3. APAC
7.4.3.1. India
7.4.3.2. China
7.4.3.3. Japan
7.4.3.4. Others
7.4.4. South America
7.4.4.1. Brazil
7.4.4.2. Argentina
7.4.5. Middle-East & Africa
8. Network Cameras & Video Analytics Market Entropy
8.1. New Product Launches
8.2. M&A, Collaboration, Partnerships, & JVs
9. Company Profiles (Overview, Financials, Products & Services, Recent Developments, Competitors, and Customers)
9.1. Company 1
9.2. Company 2
9.3. Company 3
9.4. Company 4
9.5. Company 5
9.6. Company 6
9.7. Company 7
9.8. Company 8
9.9. Company 9
9.10. Company 10
*More than 10 Companies are profiled in this Research Report*
"*Financials would be provided on a best efforts basis for private companies"
10. Appendix
10.1. Abbreviations
10.2. Sources
10.3. Research Methodology
10.4. Bibliography
10.5. Compilation of Expert Insights
List of Tables:
Table 1: Network Cameras & Video Analytics Market Overview 2023-2030
Table 2: Network Cameras & Video Analytics Market Leader Analysis 2023-2030 (US$)
Table 3: Network Cameras & Video Analytics Market Product Analysis 2023-2030 (US$)
Table 4: Network Cameras & Video Analytics Market End User Analysis 2023-2030 (US$)
Table 5: Network Cameras & Video Analytics Market Patent Analysis 2013-2023* (US$)
Table 6: Network Cameras & Video Analytics Market Financial Analysis 2023-2030 (US$)
Table 7: Network Cameras & Video Analytics Market Driver Analysis 2023-2030 (US$)
Table 8: Network Cameras & Video Analytics Market Challenges Analysis 2023-2030 (US$)
Table 9: Network Cameras & Video Analytics Market Constraint Analysis 2023-2030 (US$)
Table 10: Network Cameras & Video Analytics Market Supplier Bargaining Power Analysis 2023-2030 (US$)
Table 11: Network Cameras & Video Analytics Market Buyer Bargaining Power Analysis 2023-2030 (US$)
Table 12: Network Cameras & Video Analytics Market Threat of Substitutes Analysis 2023-2030 (US$)
Table 13: Network Cameras & Video Analytics Market Threat of New Entrants Analysis 2023-2030 (US$)
Table 14: Network Cameras & Video Analytics Market Degree of Competition Analysis 2023-2030 (US$)
Table 15: Network Cameras & Video Analytics Market Value Chain Analysis 2023-2030 (US$)
Table 16: Network Cameras & Video Analytics Market Pricing Analysis 2023-2030 (US$)
Table 17: Network Cameras & Video Analytics Market Opportunities Analysis 2023-2030 (US$)
Table 18: Network Cameras & Video Analytics Market Product Life Cycle Analysis 2023-2030 (US$)
Table 19: Network Cameras & Video Analytics Market Supplier Analysis 2023-2030 (US$)
Table 20: Network Cameras & Video Analytics Market Distributor Analysis 2023-2030 (US$)
Table 21: Network Cameras & Video Analytics Market Trend Analysis 2023-2030 (US$)
Table 22: Network Cameras & Video Analytics Market Size 2023 (US$)
Table 23: Network Cameras & Video Analytics Market Forecast Analysis 2023-2030 (US$)
Table 24: Network Cameras & Video Analytics Market Sales Forecast Analysis 2023-2030 (Units)
Table 25: Network Cameras & Video Analytics Market, Revenue & Volume,By Type, 2023-2030 ($)
Table 26: Network Cameras & Video Analytics Market By Type, Revenue & Volume,By Dome, 2023-2030 ($)
Table 27: Network Cameras & Video Analytics Market By Type, Revenue & Volume,By Fixed, 2023-2030 ($)
Table 28: Network Cameras & Video Analytics Market By Type, Revenue & Volume,By Pan/Tilt/Zoom (PTZ), 2023-2030 ($)
Table 29: Network Cameras & Video Analytics Market, Revenue & Volume,By Resolution, 2023-2030 ($)
Table 30: Network Cameras & Video Analytics Market By Resolution, Revenue & Volume,By SD, 2023-2030 ($)
Table 31: Network Cameras & Video Analytics Market By Resolution, Revenue & Volume,By HD, 2023-2030 ($)
Table 32: Network Cameras & Video Analytics Market By Resolution, Revenue & Volume,By Megapixel, 2023-2030 ($)
Table 33: Network Cameras & Video Analytics Market By Resolution, Revenue & Volume,By Product 4, 2023-2030 ($)
Table 34: Network Cameras & Video Analytics Market By Resolution, Revenue & Volume,By Product 5, 2023-2030 ($)
Table 35: Network Cameras & Video Analytics Market, Revenue & Volume,By Technology, 2023-2030 ($)
Table 36: Network Cameras & Video Analytics Market By Technology, Revenue & Volume,By Analog, 2023-2030 ($)
Table 37: Network Cameras & Video Analytics Market By Technology, Revenue & Volume,By Connectivity PoE and Wi-Fi, 2023-2030 ($)
Table 38: Network Cameras & Video Analytics Market By Technology, Revenue & Volume,By Components CCD and CMOS, 2023-2030 ($)
Table 39: Network Cameras & Video Analytics Market By Technology, Revenue & Volume,By Digital, 2023-2030 ($)
Table 40: Network Cameras & Video Analytics Market By Technology, Revenue & Volume,By Image Processing & Video Compression M-JPEG, MPEG, H.264, 2023-2030 ($)
Table 41: Network Cameras & Video Analytics Market, Revenue & Volume,By Application, 2023-2030 ($)
Table 42: Network Cameras & Video Analytics Market By Application, Revenue & Volume,By Commercial Security, 2023-2030 ($)
Table 43: Network Cameras & Video Analytics Market By Application, Revenue & Volume,By Aerospace & Defense Security, 2023-2030 ($)
Table 44: Network Cameras & Video Analytics Market By Application, Revenue & Volume,By Border Security, 2023-2030 ($)
Table 45: Network Cameras & Video Analytics Market By Application, Revenue & Volume,By Hospitality & Entertainment, 2023-2030 ($)
Table 46: Network Cameras & Video Analytics Market By Application, Revenue & Volume,By Residential Security, 2023-2030 ($)
Table 47: North America Network Cameras & Video Analytics Market, Revenue & Volume,By Type, 2023-2030 ($)
Table 48: North America Network Cameras & Video Analytics Market, Revenue & Volume,By Resolution, 2023-2030 ($)
Table 49: North America Network Cameras & Video Analytics Market, Revenue & Volume,By Technology, 2023-2030 ($)
Table 50: North America Network Cameras & Video Analytics Market, Revenue & Volume,By Application, 2023-2030 ($)
Table 51: South america Network Cameras & Video Analytics Market, Revenue & Volume,By Type, 2023-2030 ($)
Table 52: South america Network Cameras & Video Analytics Market, Revenue & Volume,By Resolution, 2023-2030 ($)
Table 53: South america Network Cameras & Video Analytics Market, Revenue & Volume,By Technology, 2023-2030 ($)
Table 54: South america Network Cameras & Video Analytics Market, Revenue & Volume,By Application, 2023-2030 ($)
Table 55: Europe Network Cameras & Video Analytics Market, Revenue & Volume,By Type, 2023-2030 ($)
Table 56: Europe Network Cameras & Video Analytics Market, Revenue & Volume,By Resolution, 2023-2030 ($)
Table 57: Europe Network Cameras & Video Analytics Market, Revenue & Volume,By Technology, 2023-2030 ($)
Table 58: Europe Network Cameras & Video Analytics Market, Revenue & Volume,By Application, 2023-2030 ($)
Table 59: APAC Network Cameras & Video Analytics Market, Revenue & Volume,By Type, 2023-2030 ($)
Table 60: APAC Network Cameras & Video Analytics Market, Revenue & Volume,By Resolution, 2023-2030 ($)
Table 61: APAC Network Cameras & Video Analytics Market, Revenue & Volume,By Technology, 2023-2030 ($)
Table 62: APAC Network Cameras & Video Analytics Market, Revenue & Volume,By Application, 2023-2030 ($)
Table 63: Middle East & Africa Network Cameras & Video Analytics Market, Revenue & Volume,By Type, 2023-2030 ($)
Table 64: Middle East & Africa Network Cameras & Video Analytics Market, Revenue & Volume,By Resolution, 2023-2030 ($)
Table 65: Middle East & Africa Network Cameras & Video Analytics Market, Revenue & Volume,By Technology, 2023-2030 ($)
Table 66: Middle East & Africa Network Cameras & Video Analytics Market, Revenue & Volume,By Application, 2023-2030 ($)
Table 67: Russia Network Cameras & Video Analytics Market, Revenue & Volume,By Type, 2023-2030 ($)
Table 68: Russia Network Cameras & Video Analytics Market, Revenue & Volume,By Resolution, 2023-2030 ($)
Table 69: Russia Network Cameras & Video Analytics Market, Revenue & Volume,By Technology, 2023-2030 ($)
Table 70: Russia Network Cameras & Video Analytics Market, Revenue & Volume,By Application, 2023-2030 ($)
Table 71: Israel Network Cameras & Video Analytics Market, Revenue & Volume,By Type, 2023-2030 ($)
Table 72: Israel Network Cameras & Video Analytics Market, Revenue & Volume,By Resolution, 2023-2030 ($)
Table 73: Israel Network Cameras & Video Analytics Market, Revenue & Volume,By Technology, 2023-2030 ($)
Table 74: Israel Network Cameras & Video Analytics Market, Revenue & Volume,By Application, 2023-2030 ($)
Table 75: Top Companies 2023 (US$)Network Cameras & Video Analytics Market, Revenue & Volume
Table 76: Product Launch 2023-2030 Network Cameras & Video Analytics Market, Revenue & Volume
Table 77: Mergers & Acquistions 2023-2030 Network Cameras & Video Analytics Market, Revenue & Volume
List of Figures:
Figure 1: Overview of Network Cameras & Video Analytics Market 2023-2030
Figure 2: Market Share Analysis for Network Cameras & Video Analytics Market 2023 (US$)
Figure 3: Product Comparison in Network Cameras & Video Analytics Market 2023-2030 (US$)
Figure 4: End User Profile for Network Cameras & Video Analytics Market 2023-2030 (US$)
Figure 5: Patent Application and Grant in Network Cameras & Video Analytics Market 2013-2023* (US$)
Figure 6: Top 5 Companies Financial Analysis in Network Cameras & Video Analytics Market 2023-2030 (US$)
Figure 7: Market Entry Strategy in Network Cameras & Video Analytics Market 2023-2030
Figure 8: Ecosystem Analysis in Network Cameras & Video Analytics Market2023
Figure 9: Average Selling Price in Network Cameras & Video Analytics Market 2023-2030
Figure 10: Top Opportunites in Network Cameras & Video Analytics Market 2023-2030
Figure 11: Market Life Cycle Analysis in Network Cameras & Video Analytics Market
Figure 12: Global By Type Network Cameras & Video Analytics Market Revenue, 2023-2030 ($)
Figure 13: Global By Resolution Network Cameras & Video Analytics Market Revenue, 2023-2030 ($)
Figure 14: Global By Technology Network Cameras & Video Analytics Market Revenue, 2023-2030 ($)
Figure 15: Global By Application Network Cameras & Video Analytics Market Revenue, 2023-2030 ($)
Figure 16: Global Network Cameras & Video Analytics Market - By Geography
Figure 17: Global Network Cameras & Video Analytics Market Value & Volume, By Geography, 2023-2030 ($)
Figure 18: Global Network Cameras & Video Analytics Market CAGR, By Geography, 2023-2030 (%)
Figure 19: North America Network Cameras & Video Analytics Market Value & Volume, 2023-2030 ($)
Figure 20: US Network Cameras & Video Analytics Market Value & Volume, 2023-2030 ($)
Figure 21: US GDP and Population, 2023-2030 ($)
Figure 22: US GDP – Composition of 2023, By Sector of Origin
Figure 23: US Export and Import Value & Volume, 2023-2030 ($)
Figure 24: Canada Network Cameras & Video Analytics Market Value & Volume, 2023-2030 ($)
Figure 25: Canada GDP and Population, 2023-2030 ($)
Figure 26: Canada GDP – Composition of 2023, By Sector of Origin
Figure 27: Canada Export and Import Value & Volume, 2023-2030 ($)
Figure 28: Mexico Network Cameras & Video Analytics Market Value & Volume, 2023-2030 ($)
Figure 29: Mexico GDP and Population, 2023-2030 ($)
Figure 30: Mexico GDP – Composition of 2023, By Sector of Origin
Figure 31: Mexico Export and Import Value & Volume, 2023-2030 ($)
Figure 32: South America Network Cameras & Video Analytics Market South America 3D Printing Market Value & Volume, 2023-2030 ($)
Figure 33: Brazil Network Cameras & Video Analytics Market Value & Volume, 2023-2030 ($)
Figure 34: Brazil GDP and Population, 2023-2030 ($)
Figure 35: Brazil GDP – Composition of 2023, By Sector of Origin
Figure 36: Brazil Export and Import Value & Volume, 2023-2030 ($)
Figure 37: Venezuela Network Cameras & Video Analytics Market Value & Volume, 2023-2030 ($)
Figure 38: Venezuela GDP and Population, 2023-2030 ($)
Figure 39: Venezuela GDP – Composition of 2023, By Sector of Origin
Figure 40: Venezuela Export and Import Value & Volume, 2023-2030 ($)
Figure 41: Argentina Network Cameras & Video Analytics Market Value & Volume, 2023-2030 ($)
Figure 42: Argentina GDP and Population, 2023-2030 ($)
Figure 43: Argentina GDP – Composition of 2023, By Sector of Origin
Figure 44: Argentina Export and Import Value & Volume, 2023-2030 ($)
Figure 45: Ecuador Network Cameras & Video Analytics Market Value & Volume, 2023-2030 ($)
Figure 46: Ecuador GDP and Population, 2023-2030 ($)
Figure 47: Ecuador GDP – Composition of 2023, By Sector of Origin
Figure 48: Ecuador Export and Import Value & Volume, 2023-2030 ($)
Figure 49: Peru Network Cameras & Video Analytics Market Value & Volume, 2023-2030 ($)
Figure 50: Peru GDP and Population, 2023-2030 ($)
Figure 51: Peru GDP – Composition of 2023, By Sector of Origin
Figure 52: Peru Export and Import Value & Volume, 2023-2030 ($)
Figure 53: Colombia Network Cameras & Video Analytics Market Value & Volume, 2023-2030 ($)
Figure 54: Colombia GDP and Population, 2023-2030 ($)
Figure 55: Colombia GDP – Composition of 2023, By Sector of Origin
Figure 56: Colombia Export and Import Value & Volume, 2023-2030 ($)
Figure 57: Costa Rica Network Cameras & Video Analytics MarketCosta Rica 3D Printing Market Value & Volume, 2023-2030 ($)
Figure 58: Costa Rica GDP and Population, 2023-2030 ($)
Figure 59: Costa Rica GDP – Composition of 2023, By Sector of Origin
Figure 60: Costa Rica Export and Import Value & Volume, 2023-2030 ($)
Figure 61: Europe Network Cameras & Video Analytics Market Value & Volume, 2023-2030 ($)
Figure 62: U.K Network Cameras & Video Analytics Market Value & Volume, 2023-2030 ($)
Figure 63: U.K GDP and Population, 2023-2030 ($)
Figure 64: U.K GDP – Composition of 2023, By Sector of Origin
Figure 65: U.K Export and Import Value & Volume, 2023-2030 ($)
Figure 66: Germany Network Cameras & Video Analytics Market Value & Volume, 2023-2030 ($)
Figure 67: Germany GDP and Population, 2023-2030 ($)
Figure 68: Germany GDP – Composition of 2023, By Sector of Origin
Figure 69: Germany Export and Import Value & Volume, 2023-2030 ($)
Figure 70: Italy Network Cameras & Video Analytics Market Value & Volume, 2023-2030 ($)
Figure 71: Italy GDP and Population, 2023-2030 ($)
Figure 72: Italy GDP – Composition of 2023, By Sector of Origin
Figure 73: Italy Export and Import Value & Volume, 2023-2030 ($)
Figure 74: France Network Cameras & Video Analytics Market Value & Volume, 2023-2030 ($)
Figure 75: France GDP and Population, 2023-2030 ($)
Figure 76: France GDP – Composition of 2023, By Sector of Origin
Figure 77: France Export and Import Value & Volume, 2023-2030 ($)
Figure 78: Netherlands Network Cameras & Video Analytics Market Value & Volume, 2023-2030 ($)
Figure 79: Netherlands GDP and Population, 2023-2030 ($)
Figure 80: Netherlands GDP – Composition of 2023, By Sector of Origin
Figure 81: Netherlands Export and Import Value & Volume, 2023-2030 ($)
Figure 82: Belgium Network Cameras & Video Analytics Market Value & Volume, 2023-2030 ($)
Figure 83: Belgium GDP and Population, 2023-2030 ($)
Figure 84: Belgium GDP – Composition of 2023, By Sector of Origin
Figure 85: Belgium Export and Import Value & Volume, 2023-2030 ($)
Figure 86: Spain Network Cameras & Video Analytics Market Value & Volume, 2023-2030 ($)
Figure 87: Spain GDP and Population, 2023-2030 ($)
Figure 88: Spain GDP – Composition of 2023, By Sector of Origin
Figure 89: Spain Export and Import Value & Volume, 2023-2030 ($)
Figure 90: Denmark Network Cameras & Video Analytics Market Value & Volume, 2023-2030 ($)
Figure 91: Denmark GDP and Population, 2023-2030 ($)
Figure 92: Denmark GDP – Composition of 2023, By Sector of Origin
Figure 93: Denmark Export and Import Value & Volume, 2023-2030 ($)
Figure 94: APAC Network Cameras & Video Analytics Market Value & Volume, 2023-2030 ($)
Figure 95: China Network Cameras & Video Analytics Market Value & Volume, 2023-2030
Figure 96: China GDP and Population, 2023-2030 ($)
Figure 97: China GDP – Composition of 2023, By Sector of Origin
Figure 98: China Export and Import Value & Volume, 2023-2030 ($)Network Cameras & Video Analytics Market China Export and Import Value & Volume, 2023-2030 ($)
Figure 99: Australia Network Cameras & Video Analytics Market Value & Volume, 2023-2030 ($)
Figure 100: Australia GDP and Population, 2023-2030 ($)
Figure 101: Australia GDP – Composition of 2023, By Sector of Origin
Figure 102: Australia Export and Import Value & Volume, 2023-2030 ($)
Figure 103: South Korea Network Cameras & Video Analytics Market Value & Volume, 2023-2030 ($)
Figure 104: South Korea GDP and Population, 2023-2030 ($)
Figure 105: South Korea GDP – Composition of 2023, By Sector of Origin
Figure 106: South Korea Export and Import Value & Volume, 2023-2030 ($)
Figure 107: India Network Cameras & Video Analytics Market Value & Volume, 2023-2030 ($)
Figure 108: India GDP and Population, 2023-2030 ($)
Figure 109: India GDP – Composition of 2023, By Sector of Origin
Figure 110: India Export and Import Value & Volume, 2023-2030 ($)
Figure 111: Taiwan Network Cameras & Video Analytics Market Taiwan 3D Printing Market Value & Volume, 2023-2030 ($)
Figure 112: Taiwan GDP and Population, 2023-2030 ($)
Figure 113: Taiwan GDP – Composition of 2023, By Sector of Origin
Figure 114: Taiwan Export and Import Value & Volume, 2023-2030 ($)
Figure 115: Malaysia Network Cameras & Video Analytics Market Malaysia 3D Printing Market Value & Volume, 2023-2030 ($)
Figure 116: Malaysia GDP and Population, 2023-2030 ($)
Figure 117: Malaysia GDP – Composition of 2023, By Sector of Origin
Figure 118: Malaysia Export and Import Value & Volume, 2023-2030 ($)
Figure 119: Hong Kong Network Cameras & Video Analytics Market Hong Kong 3D Printing Market Value & Volume, 2023-2030 ($)
Figure 120: Hong Kong GDP and Population, 2023-2030 ($)
Figure 121: Hong Kong GDP – Composition of 2023, By Sector of Origin
Figure 122: Hong Kong Export and Import Value & Volume, 2023-2030 ($)
Figure 123: Middle East & Africa Network Cameras & Video Analytics Market Middle East & Africa 3D Printing Market Value & Volume, 2023-2030 ($)
Figure 124: Russia Network Cameras & Video Analytics Market Russia 3D Printing Market Value & Volume, 2023-2030 ($)
Figure 125: Russia GDP and Population, 2023-2030 ($)
Figure 126: Russia GDP – Composition of 2023, By Sector of Origin
Figure 127: Russia Export and Import Value & Volume, 2023-2030 ($)
Figure 128: Israel Network Cameras & Video Analytics Market Value & Volume, 2023-2030 ($)
Figure 129: Israel GDP and Population, 2023-2030 ($)
Figure 130: Israel GDP – Composition of 2023, By Sector of Origin
Figure 131: Israel Export and Import Value & Volume, 2023-2030 ($)
Figure 132: Entropy Share, By Strategies, 2023-2030* (%)Network Cameras & Video Analytics Market
Figure 133: Developments, 2023-2030*Network Cameras & Video Analytics Market
Figure 134: Company 1 Network Cameras & Video Analytics Market Net Revenue, By Years, 2023-2030* ($)
Figure 135: Company 1 Network Cameras & Video Analytics Market Net Revenue Share, By Business segments, 2023 (%)
Figure 136: Company 1 Network Cameras & Video Analytics Market Net Sales Share, By Geography, 2023 (%)
Figure 137: Company 2 Network Cameras & Video Analytics Market Net Revenue, By Years, 2023-2030* ($)
Figure 138: Company 2 Network Cameras & Video Analytics Market Net Revenue Share, By Business segments, 2023 (%)
Figure 139: Company 2 Network Cameras & Video Analytics Market Net Sales Share, By Geography, 2023 (%)
Figure 140: Company 3 Network Cameras & Video Analytics Market Net Revenue, By Years, 2023-2030* ($)
Figure 141: Company 3 Network Cameras & Video Analytics Market Net Revenue Share, By Business segments, 2023 (%)
Figure 142: Company 3 Network Cameras & Video Analytics Market Net Sales Share, By Geography, 2023 (%)
Figure 143: Company 4 Network Cameras & Video Analytics Market Net Revenue, By Years, 2023-2030* ($)
Figure 144: Company 4 Network Cameras & Video Analytics Market Net Revenue Share, By Business segments, 2023 (%)
Figure 145: Company 4 Network Cameras & Video Analytics Market Net Sales Share, By Geography, 2023 (%)
Figure 146: Company 5 Network Cameras & Video Analytics Market Net Revenue, By Years, 2023-2030* ($)
Figure 147: Company 5 Network Cameras & Video Analytics Market Net Revenue Share, By Business segments, 2023 (%)
Figure 148: Company 5 Network Cameras & Video Analytics Market Net Sales Share, By Geography, 2023 (%)
Figure 149: Company 6 Network Cameras & Video Analytics Market Net Revenue, By Years, 2023-2030* ($)
Figure 150: Company 6 Network Cameras & Video Analytics Market Net Revenue Share, By Business segments, 2023 (%)
Figure 151: Company 6 Network Cameras & Video Analytics Market Net Sales Share, By Geography, 2023 (%)
Figure 152: Company 7 Network Cameras & Video Analytics Market Net Revenue, By Years, 2023-2030* ($)
Figure 153: Company 7 Network Cameras & Video Analytics Market Net Revenue Share, By Business segments, 2023 (%)
Figure 154: Company 7 Network Cameras & Video Analytics Market Net Sales Share, By Geography, 2023 (%)
Figure 155: Company 8 Network Cameras & Video Analytics Market Net Revenue, By Years, 2023-2030* ($)
Figure 156: Company 8 Network Cameras & Video Analytics Market Net Revenue Share, By Business segments, 2023 (%)
Figure 157: Company 8 Network Cameras & Video Analytics Market Net Sales Share, By Geography, 2023 (%)
Figure 158: Company 9 Network Cameras & Video Analytics Market Net Revenue, By Years, 2023-2030* ($)
Figure 159: Company 9 Network Cameras & Video Analytics Market Net Revenue Share, By Business segments, 2023 (%)
Figure 160: Company 9 Network Cameras & Video Analytics Market Net Sales Share, By Geography, 2023 (%)
Figure 161: Company 10 Network Cameras & Video Analytics Market Net Revenue, By Years, 2023-2030* ($)
Figure 162: Company 10 Network Cameras & Video Analytics Market Net Revenue Share, By Business segments, 2023 (%)
Figure 163: Company 10 Network Cameras & Video Analytics Market Net Sales Share, By Geography, 2023 (%)
Figure 164: Company 11 Network Cameras & Video Analytics Market Net Revenue, By Years, 2023-2030* ($)
Figure 165: Company 11 Network Cameras & Video Analytics Market Net Revenue Share, By Business segments, 2023 (%)
Figure 166: Company 11 Network Cameras & Video Analytics Market Net Sales Share, By Geography, 2023 (%)
Figure 167: Company 12 Network Cameras & Video Analytics Market Net Revenue, By Years, 2023-2030* ($)
Figure 168: Company 12 Network Cameras & Video Analytics Market Net Revenue Share, By Business segments, 2023 (%)
Figure 169: Company 12 Network Cameras & Video Analytics Market Net Sales Share, By Geography, 2023 (%)
Figure 170: Company 13 Network Cameras & Video Analytics Market Net Revenue, By Years, 2023-2030* ($)
Figure 171: Company 13 Network Cameras & Video Analytics Market Net Revenue Share, By Business segments, 2023 (%)
Figure 172: Company 13 Network Cameras & Video Analytics Market Net Sales Share, By Geography, 2023 (%)
Figure 173: Company 14 Network Cameras & Video Analytics Market Net Revenue, By Years, 2023-2030* ($)
Figure 174: Company 14 Network Cameras & Video Analytics Market Net Revenue Share, By Business segments, 2023 (%)
Figure 175: Company 14 Network Cameras & Video Analytics Market Net Sales Share, By Geography, 2023 (%)
Figure 176: Company 15 Network Cameras & Video Analytics Market Net Revenue, By Years, 2023-2030* ($)
Figure 177: Company 15 Network Cameras & Video Analytics Market Net Revenue Share, By Business segments, 2023 (%)
Figure 178: Company 15 Network Cameras & Video Analytics Market Net Sales Share, By Geography, 2023 (%)