 Email
Email Print
Print


Neutron detection is an effective detection of neutrons. The two key aspects of effective neutron detection are software and hardware. Organic Scintillators is the technology currently being most preferred in the neutron detection market. When excited by radiation, the scintillation materials emit a flash of light.
These materials are in the form of crystals and paired with a photomultiplier tube, which converts the light flash into an electric signal that indicates the intensity and quantity of the observed radiation. The second major class of detector is the semiconductor-based radiation detectors. The dominant material in this type of detectors is high-purity germanium (HPGe). Neutron detection is finding more applications with growing technological superiority and it is further expected to climb at fast pace with nanotechnology market.
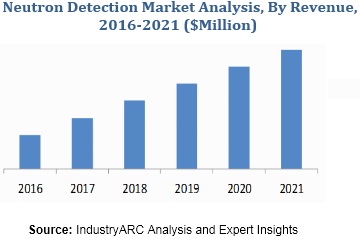
The market for neutron detectors was estimated to be $583.80 m in 2017 and it is expected to grow at a CAGR of 11.25% during forecast period i.e. 2018-2023.
What is Neutron Detection?
Neutron detection can be defined as the detection of neutrons by using an appropriately positioned detector. Detection of atomic and subatomic particles such as neutrons is usually carried out using the signature produced by these particles while they interact with the surroundings.. The key aspects to be taken care of for neutron detection to be effective are parameters such as detector shielding, source-detector distance, and solid angle as well as the graphical analysis tools involved in the set-up of the detection system. Neutral charge makes neutrons to resist direct ionization thus making detection difficult.
What are the major applications for Neutron Detection?
National security is one of the major end user of neutron detection techniques; they employ it for threat detection, arms control and nuclear material assessment. Directionally sensitive neutron detectors can help detect nuclear threats with good accuracy. Studies show that advanced semiconductor detectors loaded with boron are capable of sensing incoming neutron direction vectors.
Helium proportional tubes are used for thermal neutron detection of plutonium. Semiconductor neutron detectors are incorporated in security applications high efficiency, but their size is limited and they are expensive too. Other types of neutron detectors find applications in different sectors. For example, radiation detectors are highly useful in medical imaging, oil well logging and also in the automotive indutry.
Market Research and Market Trends of Neutron Detection Ecosystem
- Nuclear radiation detection has gained prominence across the globe owing to the huge destruction capabilities and security threats. The neutron detection 3He is the dominant material in neutron detection equipment currently. However, new materials are expected to replace the 3He, which is the biggest growth factor in the radiation detection industry. 3He is the byproduct of tritium production in nuclear weapons manufacturing, which is the major source of obtaining 3He. However, due to the end of cold war, the stock of 3He has decreased significantly. The substitutes such as 10B and 6Li loaded glass or coated fibers are thus being used to meet the increasing demand of neutron detection materials,
- Neutron detection techniques which include DT-neutron detection and neutron spectrometry are expected to be practiced in future. The growth of the overall market has been slow over the past few decades. There is a compelling need for enhanced neutron detection caused by a technology gap over the years. The research is being carried on to make neutron detection applicable for a wider range of devices and applications.
- In many applications it is expected that gas detectors which based on ionization methods will be replaced by solid-state neutron detectors in future due to their size and complexity. For improving the efficiency, cost-effectiveness and eco-friendliness of existing neutron detectors practitioners and researchers have been putting in considerable efforts. There is a need to remove the complications in detection process keeping in consideration the advances from nano science.
Who are the Major Players in Neutron Detection market?
The players profiled in the report include Rhombus Power Inc, Arktis Radiation Detectors Ltd, Silverside Detectors Inc, Leidos, Symetrica Ltd, Mirion Technologies, Atomtex , Canberra Industries , PHOTONIS , POLIMASTER , RAE Systems
What is our report scope?
The report incorporates in-depth assessment of the competitive landscape, product market sizing, product benchmarking, market trends, product developments, financial analysis, strategic analysis and so on to gauge the impact forces and potential opportunities of the market. Apart from this the report also includes a study of major developments in the market such as product launches, agreements, acquisitions, collaborations, mergers and so on to comprehend the prevailing market dynamics at present and its impact during the forecast period 2018-2024.
All our reports are customizable to your company needs to a certain extent, we do provide 20 free consulting hours along with purchase of each report, and this will allow you to request any additional data to customize the report to your needs.
Key Takeaways from this Report
- Evaluate market potential through analyzing growth rates (CAGR %), Volume (Units) and Value ($M) data given at country level – for product types, end use applications and by different industry verticals.
- Understand the different dynamics influencing the market – key driving factors, challenges and hidden opportunities.
- Get in-depth insights on your competitor performance – market shares, strategies, financial benchmarking, product benchmarking, SWOT and more.
- Analyze the sales and distribution channels across key geographies to improve top-line revenues.
- Understand the industry supply chain with a deep-dive on the value augmentation at each step, in order to optimize value and bring efficiencies in your processes.
- Get a quick outlook on the market entropy – M&A’s, deals, partnerships, product launches of all key players for the past 4 years.
- Evaluate the supply-demand gaps, import-export statistics and regulatory landscape for more than top 20 countries globally for the market.
1. Neutron Detection- Market Overview
2. Executive Summary
3. Neutron Detection - Market Landscape
3.1. Market Share Analysis
3.2. Comparative Analysis
3.2.1. Product Benchmarking
3.2.2. End User Profiling
3.2.3. Top 5 Financials Analysis
4. Neutron Detection- Market Forces
4.1. Market Drivers
4.2. Market Constraints
4.3. Market Challenges
4.4. Attractiveness of the Neutron Detection market
4.4.1. Power of Suppliers
4.4.2. Power of Customers
4.4.3. Threat of New Entrants
4.4.4. Threat of Substitution
4.4.5. Degree of Competition
5. Neutron Detection market- Strategic Analysis
5.1. Value Chain Analysis
5.2. Pricing Analysis
5.3. Opportunities Analysis
5.4. Product/Market Life Cycle Analysis
5.5. Suppliers and Distributors
6. Neutron Detection Market - By System Type
6.1. Introduction
6.2. Fast Detector
6.3. Lithium Large Area Neutron Detector
6.4. Scintillator
6.5. Semiconductor Detector
6.6. Gas Proportional Detector
6.7. Portal Monitor
6.8. Geiger Counter
6.9. Ionization Chamber
6.10. Dosimeter
6.11. Cryogenic Detector
6.12. RIID
6.13. Others
6.14. Spectrometers
6.15. Dosimeters
7. Neutron Detection Market - By Use
7.1. Portable Backpacks
7.2. Handheld Meters
7.3. Handheld Detectors
7.4. Vehicle-Mounted Device
7.5. Fixed Device
8. Neutron Detection Market – By Application
8.1. Safety / Monitoring
8.2. Medical Diagnostics
8.3. Specialty / Custom
9. Neutron Detection Market - By End User Industry
9.1. Medical and Healthcare
9.2. Aerospace and Defense
9.3. Homeland Security
9.4. Power Generation
9.5. Industrial
9.6. Maritime
9.7. Oil and Gas
9.8. Others
10. Global Neutron Detection Market - By Geography
10.1. North America
10.1.1. U.S.
10.1.2. Canada
10.1.3. Mexico
10.2. South America
10.2.1. Brazil
10.2.2. Venezuela
10.2.3. Argentina
10.2.4. Ecuador
10.2.5. Peru
10.2.6. Colombia
10.2.7. Costa Rica
10.3. Europe
10.3.1. U.K
10.3.2. Germany
10.3.3. Italy
10.3.4. France
10.3.5. Netherlands
10.3.6. Belgium
10.3.7. Spain
10.3.8. Denmark
10.4. APAC
10.4.1. China
10.4.2. Japan
10.4.3. Australia
10.4.4. South Korea
10.4.5. India
10.4.6. Taiwan
10.4.7. Malaysia
10.4.8. Hong Kong
10.5. Middle East& Africa
10.6. Russia
10.7. Israel
10.8. Other
11. Market Entropy
11.1. New Product Launches
11.2. M&As, Collaborations, JVs, Partnership
12. Company Profiles (Overview, Financials, SWOT Analysis, Developments, Product Portfolio)
12.1. Rhombus Power Inc
12.2. Arktis Radiation Detectors Ltd
12.3. Silverside Detectors Inc
12.4. Leidos
12.5. Symetrica Ltd
12.6. Mirion Technologies
12.7. Atomtex
12.8. Canberra Industries
12.9. PHOTONIS
12.10. POLIMASTER
*More than 10 Companies are profiled in this Research Report*
"*Financials would be provided on a best efforts basis for private companies"
13. Appendix
13.1. Abbreviations
13.2. Sources
13.3. Research Methodology
13.4. Bibliography
13.5. Compilation of Expert Insights
13.6. Disclaimer
List of Tables:
Table 1: Global Neutron Detection Market, Product Benchmarking
Table 2: Neutron Detection Market, Competitor Benchmarking
Table 3: Global Neutron Detection Market Value, By System Type, 2015-2023 ($Million)
Table 4: Global Neutron Detection Market Value, By Use, 2015-2023 ($Million)
Table 5: Global Neutron Detection Market Value, By Application, 2015-2023 ($Million)
Table 6: Neutron Detection Market Value, By End User Industry, 2015-2023 ($Million)
Table 7: Global Neutron Detection Market Value, By Region, 2015-2023 ($Million)
Table 8: Americas: Neutron Detection Market Value, By Application, 2015-2023 ($Million)
Table 9: Americas: Neutron Detection Market Value, By End Use Industry, 2015-2023 ($Million)
Table 10: Americas: Neutron Detection Market Value, By Usage, 2015-2023 ($Million)
Table 11: Americas: Neutron Detection Market Value, By System Type, 2015-2023 ($Million)
Table 12: Americas: Neutron Detection Market Value, By Country, 2015-2023 ($Million)
Table 13: U.S.: GDP – Composition of 2015, By End Use
Table 14: Canada : GDP – Composition of 2015, By End Use
Table 15: Brazil: GDP – Composition of 2015, By End Use
Table 16: Europe: Neutron Detection Market Value, By Application, 2015-2023 ($Million)
Table 17: Europe: Neutron Detection Market Value, By End Use Industry, 2015-2023 ($Million)
Table 18: Europe : Neutron Detection Market Value, By Usage, 2015-2023 ($Million)
Table 19: Europe : Neutron Detection Market Value, By System Type, 2015-2023 ($Million)
Table 20: Europe: Neutron Detection Market Value, By Country, 2015-2023 ($Million)
Table 21: U.K.: GDP – Composition of 2015, By End Use
Table 22: France: GDP – Composition of 2015, By End Use
Table 23: Germany: GDP – Composition of 2015, By End Use
Table 24: APAC : Neutron Detection Market Value, By Application, 2015-2023 ($Million)
Table 25: APAC : Neutron Detection Market Value, By End Use Industry, 2015-2023 ($Million)
Table 26: APAC : Neutron Detection Market Value, By Usage, 2015-2023 ($Million)
Table 27: APAC : Neutron Detection Market Value, By Country, 2015-2023 ($Million)
Table 28: APAC : Neutron Detection Market Value, By System Type, 2015-2023 ($Million)
Table 29: China: GDP – Composition of 2015, By End Use
Table 30: Japan: GDP – Composition of 2015, By End Use
Table 31: South Korea: GDP – Composition of 2015, By End Use
Table 32: India: GDP – Composition of 2015, By End Use
Table 33: RoW : Neutron Detection Market Value, By Application, 2015-2023 ($Million)
Table 34: RoW : Neutron Detection Market Value, By End User Industry, 2015-2023 ($Million)
Table 35: RoW : Neutron Detection Market Value, By Usage, 2015-2023 ($Million)
Table 36: RoW : Neutron Detection Market Value, By System Type, 2015-2023 ($Million)
Table 37: RoW : Neutron Detection Market Value, By Region, 2015-2023 ($Million)
List of Figures:
Figure 1: Global Neutron Detection Market Value, 2015-2023 ($Million)
Figure 2: Global Neutron Detection Market Value, By Type, 2015-2023 ($Million)
Figure 3: Global Neutron Detection Market Value Share, By End User Industry, 2016 (%)
Figure 4: Global Neutron Detection Market Value Share, By Geography, 2016 (%)
Figure 5: Neutron Detection Market Share, By Company, 2016 (%)
Figure 6: Neutron Detection Patents, By Year, 2013-2023* (No. Of Patents)
Figure 7: Neutron Detection Patents, By Companies (%)
Figure 8: Neutron Detector ASP, 2015-2023 ($)
Figure 9: Neutron Detection Market Life Cycle, 2015-2023
Figure 10: Lithium Large-Area Neutron Detector Market Value, 2015-2023 ($Million)
Figure 11: Fast Detectors Market Value, 2015-2023 ($Million)
Figure 12: Scintillators Market Value, 2015-2023 ($Million)
Figure 13: Semiconductor Detectors Market Value, 2015-2023 ($Million)
Figure 14: Gas Proportional Detectors Market Value, 2015-2023 ($Million)
Figure 15: Portal Monitor Market Value, 2015-2023 ($Million)
Figure 16: Geiger Counter Market Value, 2015-2023 ($Million)
Figure 17: Ionization Chamber Market Value, 2015-2023 ($Million)
Figure 18: Dosimeter Market Value, 2015-2023 ($Million)
Figure 19: RIID Market Value, 2015-2023 ($Million)
Figure 20: Others Market Value, 2015-2023 ($Million)
Figure 21: Global Neutron Detection Market Value, By Portable Backpacks, 2015-2023 ($Million)
Figure 22: Global Neutron Detection Market Value, By Handheld Meters, 2015-2023 ($Million)
Figure 23: Global Neutron Detection Market Value, By Handheld Detectors, 2015-2023 ($Million)
Figure 24: Global Neutron Detection Market Value, By Vehicle Mounted Search Systems, 2015-2023 ($Million)
Figure 25: Global Neutron Detection Market Value, By Fixed Devices, 2015-2023 ($Million)
Figure 26: Global Neutron Detection Market Value, By Safety and Monitoring Application, 2015-2023 ($Million)
Figure 27: Global Neutron Detection Market Value, By Specialty/Custom detectors, 2015-2023 ($Million)
Figure 28: Global Neutron Detection Market Value, By Medical Detection, 2015-2023 ($Million)
Figure 29: Medical: Neutron Detection Market Value, 2015-2023 ($Million)
Figure 30: Aerospace and Defense: Neutron Detection Market Value, 2015-2023 ($Million)
Figure 31: Power Generation: Neutron Detection Market Value, 2015-2023 ($Million)
Figure 32: Demand for helium-3, Research and Industrial Applications (Liters)
Figure 33: Industrial: Neutron Detection Market Value, 2015-2023 ($Million)
Figure 34: Oil & Gas: Neutron Detection Market Value, 2015-2023 ($Million)
Figure 35: Maritime: Neutron Detection Market Value, 2015-2023 ($Million)
Figure 36: Others: Neutron Detection Market Value, 2015-2023 ($Million)
Figure 37: U.S.: GDP and Population, 2012-2015 ($Trillion, Million)
Figure 38: U.S.: GDP – Composition of 2015, By Sector of Origin
Figure 39: U.S.: Export and Import Value, 2012-2015 ($Trillion)
Figure 40: Canada: GDP and Population, 2012-2015 ($Trillion, Million)
Figure 41: Canada: GDP – Composition of 2015, By Sector of Origin
Figure 42: Canada : Export and Import Value, 2012-2015 ($Billion)
Figure 43: Brazil: GDP and Population, 2012-2015 ($Trillion, Million)
Figure 44: Brazil: GDP – Composition of 2015, By Sector of Origin
Figure 45: Brazil: Export and Import Value, 2012-2015 ($Billion)
Figure 46: U.S. : Neutron Detection Market Value, 2015-2023 ($Million)
Figure 47: Canada: Neutron Detection Market Value, 2015-2023 ($Million)
Figure 48: Brazil: Neutron Detection Market Value, 2015-2023 ($Million)
Figure 49: Others : Neutron Detection Market Value, 2015-2023 ($Million)
Figure 50: Americas: Neutron Detection Market CAGR, By Country, 2023-2030 (%)
Figure 51: U.K.: GDP and Population, 2012-2015 ($Trillion, Million)
Figure 52: U.K.: GDP – Composition of 2015, By Sector of Origin
Figure 53: U.K.: Export and Import Value, 2012-2015 ($Billion)
Figure 54: France: GDP and Population, 2012-2015 ($Trillion, Million)
Figure 55: France: GDP – Composition of 2015, By Sector of Origin
Figure 56: France: Export and Import Value, 2012-2015 ($Billion)
Figure 57: Germany: GDP and Population, 2012-2015 ($Trillion, Million)
Figure 58: Germany: GDP – Composition of 2015, By Sector of Origin
Figure 59: Germany: Export and Import Value, 2012-2015 ($Billion)
Figure 60: Germany: Neutron Detection Market Value, 2015 -2023, ($Million)
Figure 61: France: Neutron Detection Market Value, 2015 -2023, ($Million)
Figure 62: U.K.: Neutron Detection Market Value, 2015 -2023, ($Million)
Figure 63: Others: Neutron Detection Market Value, 2015 -2023, ($Million)
Figure 64: Europe: Neutron Detection CAGR, By Country, 2023-2030 (%)
Figure 65: China: GDP and Population, 2012-2015 ($Trillion, Million)
Figure 66: China: GDP – Composition of 2015, By Sector of Origin
Figure 67: China: Export and Import Value, 2012-2015 ($Billion)
Figure 68: Japan: GDP and Population, 2012-2015 ($Trillion, Million)
Figure 69: Japan: GDP – Composition of 2015, By Sector of Origin
Figure 70: Japan: Export and Import Value, 2012-2015 ($Billion)
Figure 71: South Korea: GDP and Population, 2012-2015 ($Trillion, Million)
Figure 72: South Korea: GDP – Composition of 2015, By Sector of Origin
Figure 73: South Korea: Export and Import Value, 2012-2015 ($Billion)
Figure 74: India: GDP and Population, 2012-2015 ($Trillion, Million)
Figure 75: India: GDP – Composition of 2015, By Sector of Origin
Figure 76: India: Export and Import Value, 2012-2015 ($Billion)
Figure 77: China : Neutron Detection Market Value, 2015-2023 ($Million)
Figure 78: Japan : Neutron Detection Market Value, 2015-2023 ($Million)
Figure 79: South Korea: Neutron Detection Market Value, 2015-2023 ($Million)
Figure 80: Others : Neutron Detection Market Value, 2015-2023 ($Million)
Figure 81: APAC: Neutron Detection Market CAGR, By Country, 2023-2030 (%)
Figure 82: India : Neutron Detection Market Value, 2015-2023 ($Million)
Figure 83: Africa : Neutron Detection Market Value, 2015-2023 ($Million)
Figure 84: Middle East : Neutron Detection Market Value, 2015-2023 ($Million)
Figure 85: RoW : Neutron Detection Market CAGR, By Region, 2023-2030 (%)
Figure 86: Leidos Holdings, Inc. Net Revenue, 2013-2016 ($Billion)\
Figure 87: Leidos Holdings, Inc. Net Revenue Share, By Business Segment, 2016 (%)
Figure 88: Kromek Group Plc, Revenue, 2013-2023 ($Million)
Figure 89: Kromek Group Plc. Revenue, By Geography, 2023 (%)