 Email
Email Print
Print


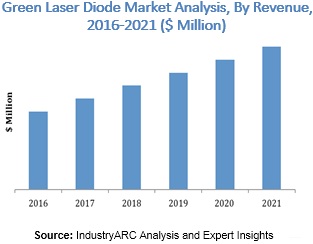
The Green Laser Diode Market is estimated to reach $296.7 Million by 2024 growing at an estimated rate of CAGR 19.2% during 2018 to 2024, majorly driven by the increased usage of laser equipped devices across various industry verticals and advancement of technologies in developed economies.
What are Green Laser Diodes?
Laser diodes are the semiconductor devices that produce coherent radiation in IR or visible spectrum on passage of current. Laser diodes are close to the LEDs both in form and operation. A laser diode can simply be seen as an LED that emits focused light. Green lasers are of particular importance, because the green wavelength is perceived to be the brightest by the human eye. The green color peaks at about 532nm for the eye. The green laser diodes are different from the other laser diodes by virtue of the fact that they can operate in wider range of temperatures when compared to the other diodes. It is this stability of the green laser diodes which make them an ideal solution for the point and line lasers which are widely used in image processing applications. The Green Laser Diode Market is segmented into 6 types based on the doping material used and of all GaAlAs based green laser diodes are expected to have the fastest growth during the forecast period. This is due to the ability of the doping material to provide excellent electrical and optical confinement, electrical and thermal conductivities which are most desired in lighting applications.
What are the major applications of Green Laser Diodes?
Green laser diodes find applications in head-mounted displays, head-up displays, smartphones and Pico-projectors. The ability of these diodes to operate in high temperature ranges without the need for the cooling has enabled the usage of these diodes in harsh environments, across various industrial verticals. Green laser diodes, today, find applications in a variety of sectors like medical, military, instrumentation and semiconductors. The Green Laser Diode Market is expected to grow the fastest in the medical sector. This is due to the advantages the green laser diodes offer over others in terms of efficiency, tight dimensional tolerances and superior edge quality.
Market Research and Market Trends of Green Laser Diode
- There is growing support from the governments in emerging economies like South Korea whose Ministry of Food and Drug safety has authorized the marketing of laser and an association was formed by the name ‘Korea Association for Photonics Industry Development’ to strengthen the ties among the industries that are related to the photonics through research and development of the technology. Prospects like these can contribute to the growth of the Green Laser Diode Market.
- Aiming to drive the technological change in automotive lighting systems, Osram and Continental AG signed a joint venture on April 3rd, 2018 in which each of the partners have 50% stake. The product portfolio features laser modules, LED modules and light control units.
- Direct green laser diodes, introduced by Osram, are replacing the more complex DPSS lasers in biomechanical diagnostics applications like DNA and cell analysis tools owing to their good far-field pattern and tight wave length tolerance. This shift is huge prospect for the green laser diodes in the field of medical applications.
- Near infrared fluorescence imaging system is an emerging clinical technology which helps in the observation of blood flow and lymph flow under a target tissue. Green laser diode acts as an incident light source in this technology. Technological advancements as such can boost the market of green laser diodes.
Who are the Major Players in Green Laser Diode Market?
The companies referred to in the market research report include Osram, Nichia, Thorlabs, Egismos, Yisnic and 5 others.
What is our report scope?
The report incorporates the competitive landscape, pricing strategies, market trends, latest developments, financial analysis, strategic analysis, and so on, to gauge the impact forces and potential opportunities of the market. It also gives a detailed account of the major developments in the market such as agreements, acquisitions, collaborations, mergers, and so on, to comprehend the prevailing market dynamics and their potential impact during the forecast period.
All our reports are customizable as per your company’s needs to a certain extent. We provide 20 free consulting hours for the purchase of each report, which would enable you to request any additional data to customize the report as per your needs.
Key takeaways from this Report
- Evaluate market potential by analyzing growth rates (CAGR %) and value ($m) of the data given at country level for each segment.
- Understand the different dynamics influencing the market – key driving factors, challenges and hidden opportunities.
- Get in-depth insights on your competitors’ performance – market shares, strategies, financial benchmarking, SWOT, and more.
- Analyze the sales and distribution channels across key regions to improve top-line revenues.
- Understand the industry supply chain with a deep-dive on the value augmentation at each step, in order to optimize value and increase the efficiency of your processes
- Get a quick outlook of the market entropy – M&As, deals, and partnerships of all key players in the past four years.
- Evaluate the supply–demand gaps, import–export statistics, and regulatory landscape for more than 20 top countries of the market.
1. Green Laser Diode Market - Overview
1.1. Definitions and Scope
2. Green Laser Diode Market - Executive summary
2.1. Market Revenue, Market Size and Key Trends by Company
2.2. Key Trends by type of Application
2.3. Key Trends segmented by Geography
3. Green Laser Diode Market
3.1. Comparative analysis
3.1.1. Product Benchmarking - Top 10 companies
3.1.2. Top 5 Financials Analysis
3.1.3. Market Value split by Top 10 companies
3.1.4. Patent Analysis - Top 10 companies
3.1.5. Pricing Analysis
4. Green Laser Diode Market – Startup companies Scenario Premium
4.1. Top 10 startup company Analysis by
4.1.1. Investment
4.1.2. Revenue
4.1.3. Market Shares
4.1.4. Market Size and Application Analysis
4.1.5. Venture Capital and Funding Scenario
5. Green Laser Diode Market – Industry Market Entry Scenario Premium
5.1. Regulatory Framework Overview
5.2. New Business and Ease of Doing business index
5.3. Case studies of successful ventures
5.4. Customer Analysis – Top 10 companies
6. Green Laser Diode Market Forces
6.1. Drivers
6.2. Constraints
6.3. Challenges
6.4. Porters five force model
6.4.1. Bargaining power of suppliers
6.4.2. Bargaining powers of customers
6.4.3. Threat of new entrants
6.4.4. Rivalry among existing players
6.4.5. Threat of substitutes
7. Green Laser Diode Market -Strategic analysis
7.1. Value chain analysis
7.2. Opportunities analysis
7.3. Product life cycle
7.4. Suppliers and distributors Market Share
8. Green Laser Diode Market – By Mode of Operation (Market Size -$Million / $Billion)
8.1. Market Size and Market Share Analysis
8.2. Application Revenue and Trend Research
8.3. Product Segment Analysis
8.3.1. Continuous Wave Mode
8.3.2. Pulse Mode
9. Green Laser Diode Market – By Doping Material (Market Size -$Million / $Billion)
9.1. Introduction
9.2. AlGalnP
9.3. GaAlAs
9.4. GaInAsSb
9.5. GaN
9.6. InGaN
10. Green Laser Diode Market – By Power (Market Size -$Million / $Billion)
10.1. Upto 500mW
10.2. 500.1mW-5W
10.3. 5.1W-1kW
10.4. Above 1kW
11. Green Laser Diode – By End User (Market Size -$Million / $Billion)
11.1. Segment type Size and Market Share Analysis
11.2. Application Revenue and Trends by type of Application
11.3. Application Segment Analysis by Type
11.3.1. Consumer Electronics
11.3.1.1. Projectors
11.3.1.2. Presentation Pointers
11.3.1.3. Others
11.3.2. Medical
11.3.2.1. Patient Positioning
11.3.2.2. Skin Treatment Equipment
11.3.2.3. Others
11.3.3. Industrial
11.3.3.1. Cutting
11.3.3.2. Welding
11.3.3.3. Automated Inspection
11.3.3.4. High Precision Alignment and Positioning
11.3.3.5. Micromachining
11.3.3.6. Others
11.3.4. Defense
11.3.4.1. Targeting System
11.3.4.2. Night Vision
11.3.5. Automotive
11.3.5.1. Head up Displays
11.3.6. Others
12. Green Laser Diode - By Geography (Market Size -$Million / $Billion)
12.1. Green Laser Diode Market - North America Segment Research
12.2. North America Market Research (Million / $Billion)
12.2.1. Segment type Size and Market Size Analysis
12.2.2. Revenue and Trends
12.2.3. Application Revenue and Trends by type of Application
12.2.4. Company Revenue and Product Analysis
12.2.5. North America Product type and Application Market Size
12.2.5.1. U.S.
12.2.5.2. Canada
12.2.5.3. Mexico
12.2.5.4. Rest of North America
12.3. Green Laser Diode- South America Segment Research
12.4. South America Market Research (Market Size -$Million / $Billion)
12.4.1. Segment type Size and Market Size Analysis
12.4.2. Revenue and Trends
12.4.3. Application Revenue and Trends by type of Application
12.4.4. Company Revenue and Product Analysis
12.4.5. South America Product type and Application Market Size
12.4.5.1. Brazil
12.4.5.2. Venezuela
12.4.5.3. Argentina
12.4.5.4. Ecuador
12.4.5.5. Peru
12.4.5.6. Colombia
12.4.5.7. Costa Rica
12.4.5.8. Rest of South America
12.5. Green Laser Diode - Europe Segment Research
12.6. Europe Market Research (Market Size -$Million / $Billion)
12.6.1. Segment type Size and Market Size Analysis
12.6.2. Revenue and Trends
12.6.3. Application Revenue and Trends by type of Application
12.6.4. Company Revenue and Product Analysis
12.6.5. Europe Segment Product type and Application Market Size
12.6.5.1. U.K
12.6.5.2. Germany
12.6.5.3. Italy
12.6.5.4. France
12.6.5.5. Netherlands
12.6.5.6. Belgium
12.6.5.7. Spain
12.6.5.8. Denmark
12.6.5.9. Rest of Europe
12.7. Green Laser Diode – APAC Segment Research
12.8. APAC Market Research (Market Size -$Million / $Billion)
12.8.1. Segment type Size and Market Size Analysis
12.8.2. Revenue and Trends
12.8.3. Application Revenue and Trends by type of Application
12.8.4. Company Revenue and Product Analysis
12.8.5. APAC Segment – Product type and Application Market Size
12.8.5.1. China
12.8.5.2. Australia
12.8.5.3. Japan
12.8.5.4. South Korea
12.8.5.5. India
12.8.5.6. Taiwan
12.8.5.7. Malaysia
13. Green Laser Diode Market - Entropy
13.1 New product launches
13.2 M&A s, collaborations, JVs and partnerships
14. Green Laser Diode Market - Industry / Segment Competition landscape Premium
14.1 Market Share Analysis
14.1.1 Market Share by Country- Top companies
14.1.2 Market Share by Region- Top 10 companies
14.1.3 Market Share by type of Application - Top 10 companies
14.1.4 Market Share by type of Product / Product category- Top 10 companies
14.1.5 Market Share at a global level - Top 10 companies
14.1.6 Best Practises for companies
15. Green Laser Diode Market - Key Company List by Country Premium
16. Green Laser Diode Market Company Analysis
16.1 Market Share, Company Revenue, Products, M&A, Developments
16.2. Coherent, Inc.
16.3. Sharp Corporation
16.4. Quarton Inc.
16.5. Osram Opto Semiconductors GmbH
16.6. Sumitomo Electric Industries Ltd.
16.7. Egismos Technology Corporation
16.8. Nichia Corporation
16.9. Thorlabs, Inc.
16.10. IPG Photonics Corporation
16.11. LightVision Technologies Corp.
16.12. Company 11
16.13. Company 12 & More
*Financials would be provided on a best efforts basis for private companies
17. Green Laser Diode Market - Appendix
17.1 Abbreviations
17.2 Sources
18. Green Laser Diode Market - Methodology
18.1 Research Methodology
18.1.1 Company Expert Interviews
18.1.2 Industry Databases
18.1.3 Associations
18.1.4 Company News
18.1.5 Company Annual Reports
18.1.6 Application Trends
18.1.7 New Products and Product database
18.1.8 Company Transcripts
18.1.9 R&D Trends
18.1.10 Key Opinion Leaders Interviews
18.1.11 Supply and Demand Trends
List of Tables
Table 1: Green Laser Diode Market Overview 2023-2030
Table 2: Green Laser Diode Market Leader Analysis 2023-2030 (US$)
Table 3: Green Laser Diode Market Product Analysis 2023-2030 (US$)
Table 4: Green Laser Diode Market End User Analysis 2023-2030 (US$)
Table 5: Green Laser Diode Market Patent Analysis 2013-2023* (US$)
Table 6: Green Laser Diode Market Financial Analysis 2023-2030 (US$)
Table 7: Green Laser Diode Market Driver Analysis 2023-2030 (US$)
Table 8: Green Laser Diode Market Challenges Analysis 2023-2030 (US$)
Table 9: Green Laser Diode Market Constraint Analysis 2023-2030 (US$)
Table 10: Green Laser Diode Market Supplier Bargaining Power Analysis 2023-2030 (US$)
Table 11: Green Laser Diode Market Buyer Bargaining Power Analysis 2023-2030 (US$)
Table 12: Green Laser Diode Market Threat of Substitutes Analysis 2023-2030 (US$)
Table 13: Green Laser Diode Market Threat of New Entrants Analysis 2023-2030 (US$)
Table 14: Green Laser Diode Market Degree of Competition Analysis 2023-2030 (US$)
Table 15: Green Laser Diode Market Value Chain Analysis 2023-2030 (US$)
Table 16: Green Laser Diode Market Pricing Analysis 2023-2030 (US$)
Table 17: Green Laser Diode Market Opportunities Analysis 2023-2030 (US$)
Table 18: Green Laser Diode Market Product Life Cycle Analysis 2023-2030 (US$)
Table 19: Green Laser Diode Market Supplier Analysis 2023-2030 (US$)
Table 20: Green Laser Diode Market Distributor Analysis 2023-2030 (US$)
Table 21: Green Laser Diode Market Trend Analysis 2023-2030 (US$)
Table 22: Green Laser Diode Market Size 2023 (US$)
Table 23: Green Laser Diode Market Forecast Analysis 2023-2030 (US$)
Table 24: Green Laser Diode Market Sales Forecast Analysis 2023-2030 (Units)
Table 25: Green Laser Diode Market, Revenue & Volume,By Type, 2023-2030 ($)
Table 26: Green Laser Diode Market By Type, Revenue & Volume,By Injection Laser diode, 2023-2030 ($)
Table 27: Green Laser Diode Market By Type, Revenue & Volume,By Optically Pumped Laser diode, 2023-2030 ($)
Table 31: Green Laser Diode Market, Revenue & Volume,By Doping Material, 2023-2030 ($)
Table 32: Green Laser Diode Market By Doping Material, Revenue & Volume,By AlGaInP, 2023-2030 ($)
Table 33: Green Laser Diode Market By Doping Material, Revenue & Volume,By GaAlAs, 2023-2030 ($)
Table 34: Green Laser Diode Market By Doping Material, Revenue & Volume,By GaInAsSb, 2023-2030 ($)
Table 35: Green Laser Diode Market By Doping Material, Revenue & Volume,By GaN, 2023-2030 ($)
Table 36: Green Laser Diode Market By Doping Material, Revenue & Volume,By InGaN, 2023-2030 ($)
Table 43: Green Laser Diode Market, Revenue & Volume,By Application, 2023-2030 ($)
Table 44: Green Laser Diode Market By Application, Revenue & Volume,By Heads-Up Display, 2023-2030 ($)
Table 45: Green Laser Diode Market By Application, Revenue & Volume,By Head-Mounted Display, 2023-2030 ($)
Table 46: Green Laser Diode Market By Application, Revenue & Volume,By Pico-Projectors, 2023-2030 ($)
Table 47: Green Laser Diode Market By Application, Revenue & Volume,By Pico-Projectors, 2023-2030 ($)
Table 55: North America Green Laser Diode Market, Revenue & Volume,By Type, 2023-2030 ($)
Table 56: North America Green Laser Diode Market, Revenue & Volume,By Doping Material, 2023-2030 ($)
Table 58: North America Green Laser Diode Market, Revenue & Volume,By Application, 2023-2030 ($)
Table 60: South america Green Laser Diode Market, Revenue & Volume,By Type, 2023-2030 ($)
Table 61: South america Green Laser Diode Market, Revenue & Volume,By Doping Material, 2023-2030 ($)
Table 63: South america Green Laser Diode Market, Revenue & Volume,By Application, 2023-2030 ($)
Table 65: Europe Green Laser Diode Market, Revenue & Volume,By Type, 2023-2030 ($)
Table 66: Europe Green Laser Diode Market, Revenue & Volume,By Doping Material, 2023-2030 ($)
Table 68: Europe Green Laser Diode Market, Revenue & Volume,By Application, 2023-2030 ($)
Table 70: APAC Green Laser Diode Market, Revenue & Volume,By Type, 2023-2030 ($)
Table 71: APAC Green Laser Diode Market, Revenue & Volume,By Doping Material, 2023-2030 ($)
Table 73: APAC Green Laser Diode Market, Revenue & Volume,By Application, 2023-2030 ($)
Table 75: Middle East & Africa Green Laser Diode Market, Revenue & Volume,By Type, 2023-2030 ($)
Table 76: Middle East & Africa Green Laser Diode Market, Revenue & Volume,By Doping Material, 2023-2030 ($)
Table 78: Middle East & Africa Green Laser Diode Market, Revenue & Volume,By Application, 2023-2030 ($)
Table 80: Russia Green Laser Diode Market, Revenue & Volume,By Type, 2023-2030 ($)
Table 81: Russia Green Laser Diode Market, Revenue & Volume,By Doping Material, 2023-2030 ($)
Table 83: Russia Green Laser Diode Market, Revenue & Volume,By Application, 2023-2030 ($)
Table 85: Israel Green Laser Diode Market, Revenue & Volume,By Type, 2023-2030 ($)
Table 86: Israel Green Laser Diode Market, Revenue & Volume,By Doping Material, 2023-2030 ($)
Table 88: Israel Green Laser Diode Market, Revenue & Volume,By Application, 2023-2030 ($)
Table 90: Top Companies 2023 (US$)Green Laser Diode Market, Revenue & Volume
Table 91: Product Launch 2023-2030Green Laser Diode Market, Revenue & Volume
Table 92: Mergers & Acquistions 2023-2030Green Laser Diode Market, Revenue & Volume
List of Figures
Figure 1: Overview of Green Laser Diode Market 2023-2030
Figure 2: Market Share Analysis for Green Laser Diode Market 2023 (US$)
Figure 3: Product Comparison in Green Laser Diode Market 2023-2030 (US$)
Figure 4: End User Profile for Green Laser Diode Market 2023-2030 (US$)
Figure 5: Patent Application and Grant in Green Laser Diode Market 2013-2023* (US$)
Figure 6: Top 5 Companies Financial Analysis in Green Laser Diode Market 2023-2030 (US$)
Figure 7: Market Entry Strategy in Green Laser Diode Market 2023-2030
Figure 8: Ecosystem Analysis in Green Laser Diode Market 2023
Figure 9: Average Selling Price in Green Laser Diode Market 2023-2030
Figure 10: Top Opportunites in Green Laser Diode Market 2023-2030
Figure 11: Market Life Cycle Analysis in Green Laser Diode Market
Figure 12: GlobalBy TypeGreen Laser Diode Market Revenue, 2023-2030 ($)
Figure 13: GlobalBy Doping MaterialGreen Laser Diode Market Revenue, 2023-2030 ($)
Figure 15: GlobalBy ApplicationGreen Laser Diode Market Revenue, 2023-2030 ($)
Figure 17: Global Green Laser Diode Market - By Geography
Figure 18: Global Green Laser Diode Market Value & Volume, By Geography, 2023-2030 ($)
Figure 19: Global Green Laser Diode Market CAGR, By Geography, 2023-2030 (%)
Figure 20: North America Green Laser Diode Market Value & Volume, 2023-2030 ($)
Figure 21: US Green Laser Diode Market Value & Volume, 2023-2030 ($)
Figure 22: US GDP and Population, 2023-2030 ($)
Figure 23: US GDP – Composition of 2023, By Sector of Origin
Figure 24: US Export and Import Value & Volume, 2023-2030 ($)
Figure 25: Canada Green Laser Diode Market Value & Volume, 2023-2030 ($)
Figure 26: Canada GDP and Population, 2023-2030 ($)
Figure 27: Canada GDP – Composition of 2023, By Sector of Origin
Figure 28: Canada Export and Import Value & Volume, 2023-2030 ($)
Figure 29: Mexico Green Laser Diode Market Value & Volume, 2023-2030 ($)
Figure 30: Mexico GDP and Population, 2023-2030 ($)
Figure 31: Mexico GDP – Composition of 2023, By Sector of Origin
Figure 32: Mexico Export and Import Value & Volume, 2023-2030 ($)
Figure 33: South America Green Laser Diode Market Value & Volume, 2023-2030 ($)
Figure 34: Brazil Green Laser Diode Market Value & Volume, 2023-2030 ($)
Figure 35: Brazil GDP and Population, 2023-2030 ($)
Figure 36: Brazil GDP – Composition of 2023, By Sector of Origin
Figure 37: Brazil Export and Import Value & Volume, 2023-2030 ($)
Figure 38: Venezuela Green Laser Diode Market Value & Volume, 2023-2030 ($)
Figure 39: Venezuela GDP and Population, 2023-2030 ($)
Figure 40: Venezuela GDP – Composition of 2023, By Sector of Origin
Figure 41: Venezuela Export and Import Value & Volume, 2023-2030 ($)
Figure 42: Argentina Green Laser Diode Market Value & Volume, 2023-2030 ($)
Figure 43: Argentina GDP and Population, 2023-2030 ($)
Figure 44: Argentina GDP – Composition of 2023, By Sector of Origin
Figure 45: Argentina Export and Import Value & Volume, 2023-2030 ($)
Figure 46: Ecuador Green Laser Diode Market Value & Volume, 2023-2030 ($)
Figure 47: Ecuador GDP and Population, 2023-2030 ($)
Figure 48: Ecuador GDP – Composition of 2023, By Sector of Origin
Figure 49: Ecuador Export and Import Value & Volume, 2023-2030 ($)
Figure 50: Peru Green Laser Diode Market Value & Volume, 2023-2030 ($)
Figure 51: Peru GDP and Population, 2023-2030 ($)
Figure 52: Peru GDP – Composition of 2023, By Sector of Origin
Figure 53: Peru Export and Import Value & Volume, 2023-2030 ($)
Figure 54: Colombia Green Laser Diode Market Value & Volume, 2023-2030 ($)
Figure 55: Colombia GDP and Population, 2023-2030 ($)
Figure 56: Colombia GDP – Composition of 2023, By Sector of Origin
Figure 57: Colombia Export and Import Value & Volume, 2023-2030 ($)
Figure 58: Costa Rica Green Laser Diode Market Value & Volume, 2023-2030 ($)
Figure 59: Costa Rica GDP and Population, 2023-2030 ($)
Figure 60: Costa Rica GDP – Composition of 2023, By Sector of Origin
Figure 61: Costa Rica Export and Import Value & Volume, 2023-2030 ($)
Figure 62: Europe Green Laser Diode Market Value & Volume, 2023-2030 ($)
Figure 63: U.K Green Laser Diode Market Value & Volume, 2023-2030 ($)
Figure 64: U.K GDP and Population, 2023-2030 ($)
Figure 65: U.K GDP – Composition of 2023, By Sector of Origin
Figure 66: U.K Export and Import Value & Volume, 2023-2030 ($)
Figure 67: Germany Green Laser Diode Market Value & Volume, 2023-2030 ($)
Figure 68: Germany GDP and Population, 2023-2030 ($)
Figure 69: Germany GDP – Composition of 2023, By Sector of Origin
Figure 70: Germany Export and Import Value & Volume, 2023-2030 ($)
Figure 71: Italy Green Laser Diode Market Value & Volume, 2023-2030 ($)
Figure 72: Italy GDP and Population, 2023-2030 ($)
Figure 73: Italy GDP – Composition of 2023, By Sector of Origin
Figure 74: Italy Export and Import Value & Volume, 2023-2030 ($)
Figure 75: France Green Laser Diode Market Value & Volume, 2023-2030 ($)
Figure 76: France GDP and Population, 2023-2030 ($)
Figure 77: France GDP – Composition of 2023, By Sector of Origin
Figure 78: France Export and Import Value & Volume, 2023-2030 ($)
Figure 79: Netherlands Green Laser Diode Market Value & Volume, 2023-2030 ($)
Figure 80: Netherlands GDP and Population, 2023-2030 ($)
Figure 81: Netherlands GDP – Composition of 2023, By Sector of Origin
Figure 82: Netherlands Export and Import Value & Volume, 2023-2030 ($)
Figure 83: Belgium Green Laser Diode Market Value & Volume, 2023-2030 ($)
Figure 84: Belgium GDP and Population, 2023-2030 ($)
Figure 85: Belgium GDP – Composition of 2023, By Sector of Origin
Figure 86: Belgium Export and Import Value & Volume, 2023-2030 ($)
Figure 87: Spain Green Laser Diode Market Value & Volume, 2023-2030 ($)
Figure 88: Spain GDP and Population, 2023-2030 ($)
Figure 89: Spain GDP – Composition of 2023, By Sector of Origin
Figure 90: Spain Export and Import Value & Volume, 2023-2030 ($)
Figure 91: Denmark Green Laser Diode Market Value & Volume, 2023-2030 ($)
Figure 92: Denmark GDP and Population, 2023-2030 ($)
Figure 93: Denmark GDP – Composition of 2023, By Sector of Origin
Figure 94: Denmark Export and Import Value & Volume, 2023-2030 ($)
Figure 95: APAC Green Laser Diode Market Value & Volume, 2023-2030 ($)
Figure 96: China Green Laser Diode Market Value & Volume, 2023-2030
Figure 97: China GDP and Population, 2023-2030 ($)
Figure 98: China GDP – Composition of 2023, By Sector of Origin
Figure 99: China Export and Import Value & Volume, 2023-2030 ($)Green Laser Diode Market China Export and Import Value & Volume, 2023-2030 ($)
Figure 100: Australia Green Laser Diode Market Value & Volume, 2023-2030 ($)
Figure 101: Australia GDP and Population, 2023-2030 ($)
Figure 102: Australia GDP – Composition of 2023, By Sector of Origin
Figure 103: Australia Export and Import Value & Volume, 2023-2030 ($)
Figure 104: South Korea Green Laser Diode Market Value & Volume, 2023-2030 ($)
Figure 105: South Korea GDP and Population, 2023-2030 ($)
Figure 106: South Korea GDP – Composition of 2023, By Sector of Origin
Figure 107: South Korea Export and Import Value & Volume, 2023-2030 ($)
Figure 108: India Green Laser Diode Market Value & Volume, 2023-2030 ($)
Figure 109: India GDP and Population, 2023-2030 ($)
Figure 110: India GDP – Composition of 2023, By Sector of Origin
Figure 111: India Export and Import Value & Volume, 2023-2030 ($)
Figure 112: Taiwan Green Laser Diode Market Value & Volume, 2023-2030 ($)
Figure 113: Taiwan GDP and Population, 2023-2030 ($)
Figure 114: Taiwan GDP – Composition of 2023, By Sector of Origin
Figure 115: Taiwan Export and Import Value & Volume, 2023-2030 ($)
Figure 116: Malaysia Green Laser Diode Market Value & Volume, 2023-2030 ($)
Figure 117: Malaysia GDP and Population, 2023-2030 ($)
Figure 118: Malaysia GDP – Composition of 2023, By Sector of Origin
Figure 119: Malaysia Export and Import Value & Volume, 2023-2030 ($)
Figure 120: Hong Kong Green Laser Diode Market Value & Volume, 2023-2030 ($)
Figure 121: Hong Kong GDP and Population, 2023-2030 ($)
Figure 122: Hong Kong GDP – Composition of 2023, By Sector of Origin
Figure 123: Hong Kong Export and Import Value & Volume, 2023-2030 ($)
Figure 124: Middle East & Africa Green Laser Diode Market Middle East & Africa 3D Printing Market Value & Volume, 2023-2030 ($)
Figure 125: Russia Green Laser Diode Market Value & Volume, 2023-2030 ($)
Figure 126: Russia GDP and Population, 2023-2030 ($)
Figure 127: Russia GDP – Composition of 2023, By Sector of Origin
Figure 128: Russia Export and Import Value & Volume, 2023-2030 ($)
Figure 129: Israel Green Laser Diode Market Value & Volume, 2023-2030 ($)
Figure 130: Israel GDP and Population, 2023-2030 ($)
Figure 131: Israel GDP – Composition of 2023, By Sector of Origin
Figure 132: Israel Export and Import Value & Volume, 2023-2030 ($)
Figure 133: Entropy Share, By Strategies, 2023-2030* (%)Green Laser Diode Market
Figure 134: Developments, 2023-2030*Green Laser Diode Market
Figure 135: Company 1 Green Laser Diode Market Net Revenue, By Years, 2023-2030* ($)
Figure 136: Company 1 Green Laser Diode Market Net Revenue Share, By Business segments, 2023 (%)
Figure 137: Company 1 Green Laser Diode Market Net Sales Share, By Geography, 2023 (%)
Figure 138: Company 2 Green Laser Diode Market Net Revenue, By Years, 2023-2030* ($)
Figure 139: Company 2 Green Laser Diode Market Net Revenue Share, By Business segments, 2023 (%)
Figure 140: Company 2 Green Laser Diode Market Net Sales Share, By Geography, 2023 (%)
Figure 141: Company 3Green Laser Diode Market Net Revenue, By Years, 2023-2030* ($)
Figure 142: Company 3Green Laser Diode Market Net Revenue Share, By Business segments, 2023 (%)
Figure 143: Company 3Green Laser Diode Market Net Sales Share, By Geography, 2023 (%)
Figure 144: Company 4 Green Laser Diode Market Net Revenue, By Years, 2023-2030* ($)
Figure 145: Company 4 Green Laser Diode Market Net Revenue Share, By Business segments, 2023 (%)
Figure 146: Company 4 Green Laser Diode Market Net Sales Share, By Geography, 2023 (%)
Figure 147: Company 5 Green Laser Diode Market Net Revenue, By Years, 2023-2030* ($)
Figure 148: Company 5 Green Laser Diode Market Net Revenue Share, By Business segments, 2023 (%)
Figure 149: Company 5 Green Laser Diode Market Net Sales Share, By Geography, 2023 (%)
Figure 150: Company 6 Green Laser Diode Market Net Revenue, By Years, 2023-2030* ($)
Figure 151: Company 6 Green Laser Diode Market Net Revenue Share, By Business segments, 2023 (%)
Figure 152: Company 6 Green Laser Diode Market Net Sales Share, By Geography, 2023 (%)
Figure 153: Company 7 Green Laser Diode Market Net Revenue, By Years, 2023-2030* ($)
Figure 154: Company 7 Green Laser Diode Market Net Revenue Share, By Business segments, 2023 (%)
Figure 155: Company 7 Green Laser Diode Market Net Sales Share, By Geography, 2023 (%)
Figure 156: Company 8 Green Laser Diode Market Net Revenue, By Years, 2023-2030* ($)
Figure 157: Company 8 Green Laser Diode Market Net Revenue Share, By Business segments, 2023 (%)
Figure 158: Company 8 Green Laser Diode Market Net Sales Share, By Geography, 2023 (%)
Figure 159: Company 9 Green Laser Diode Market Net Revenue, By Years, 2023-2030* ($)
Figure 160: Company 9 Green Laser Diode Market Net Revenue Share, By Business segments, 2023 (%)
Figure 161: Company 9 Green Laser Diode Market Net Sales Share, By Geography, 2023 (%)
Figure 162: Company 10 Green Laser Diode Market Net Revenue, By Years, 2023-2030* ($)
Figure 163: Company 10 Green Laser Diode Market Net Revenue Share, By Business segments, 2023 (%)
Figure 164: Company 10 Green Laser Diode Market Net Sales Share, By Geography, 2023 (%)
Figure 165: Company 11 Green Laser Diode Market Net Revenue, By Years, 2023-2030* ($)
Figure 166: Company 11 Green Laser Diode Market Net Revenue Share, By Business segments, 2023 (%)
Figure 167: Company 11 Green Laser Diode Market Net Sales Share, By Geography, 2023 (%)
Figure 168: Company 12 Green Laser Diode Market Net Revenue, By Years, 2023-2030* ($)
Figure 169: Company 12 Green Laser Diode Market Net Revenue Share, By Business segments, 2023 (%)
Figure 170: Company 12 Green Laser Diode Market Net Sales Share, By Geography, 2023 (%)
Figure 171: Company 13Green Laser Diode Market Net Revenue, By Years, 2023-2030* ($)
Figure 172: Company 13Green Laser Diode Market Net Revenue Share, By Business segments, 2023 (%)
Figure 173: Company 13Green Laser Diode Market Net Sales Share, By Geography, 2023 (%)
Figure 174: Company 14 Green Laser Diode Market Net Revenue, By Years, 2023-2030* ($)
Figure 175: Company 14 Green Laser Diode Market Net Revenue Share, By Business segments, 2023 (%)
Figure 176: Company 14 Green Laser Diode Market Net Sales Share, By Geography, 2023 (%)
Figure 177: Company 15 Green Laser Diode Market Net Revenue, By Years, 2023-2030* ($)
Figure 178: Company 15 Green Laser Diode Market Net Revenue Share, By Business segments, 2023 (%)
Figure 179: Company 15 Green Laser Diode Market Net Sales Share, By Geography, 2023 (%)