 Email
Email Print
Print


Electrochemical Gas Sensor Market - Forecast(2024 - 2030)
Overview
The Electrochemical Gas Sensor market was valued at US$ 2.3 billion in 2023 and is anticipated to reach US$ 4.6 billion by 2030, witnessing a CAGR of 10.4% during the forecast period 2024-2030., Electrochemical Gas Sensor are gas detectors which oxidize or reduce the target gas at an electrode and measuring the resulting current of the target gas. Globally, increase in the demand in oil & gas industry, and stringent government safety regulations are the prime growth drivers of global electrochemical gas sensor market. There is a growing trend towards the miniaturization and portability of Electrochemical Gas Sensor. Manufacturers are developing smaller and lighter sensors that can be integrated into various devices and applications, including wearable devices, smartphones, and IoT devices. This trend is driven by the increasing demand for compact and mobile gas detection solutions in industries such as automotive, healthcare, and environmental monitoring. Another trend in the Electrochemical Gas Sensor market is the integration of wireless connectivity features such as Bluetooth, Wi-Fi, and LoRaWAN. Wireless-enabled sensors allow for remote monitoring and data transmission, enabling real-time monitoring of gas levels and immediate response to potential hazards. This trend is fueled by the need for seamless connectivity and data accessibility in industrial and IoT applications, driving the adoption of smart and connected gas sensing solutions.
The report: “Electrochemical Gas Sensor market Forecast (2024-2030)”, by IndustryARC covers an in-depth analysis of the following segments of the Customer Relationship Management (CRM) market.
By Type: Oxygen, Carbon Monoxide, Carbon Dioxide, Nitrogen Oxide, Ammonia, Hydrogen Sulfide, Chlorine (CL), Volatile Organic Compound (VOC), Methane, Propane, Butane, Others
By End-User: Water & Wastewater Treatment, Automotive, Metal & Chemical Industry, Medical, Environmental, Food Industry, Oil & Gas, Consumer Electronics,Transport & Logistics, Power Stations, Building Automation and Domestic Application, Others
By Geography: North America (U.S, Canada, Mexico), Europe (Germany, UK, France, Italy, Spain, Russia and Others), APAC (China, Japan India, SK, Aus and
Others), South America (Brazil, Argentina and others) and RoW (Middle east and Africa)
For More Details on This Report - Request for Sample
By Application - Segment Analysis
The increasing adoption of bio-sensors utilizing electrochemical sensing technology is gaining momentum, driven by the growing demand for point-of-care applications like self-monitoring blood glucose meters. Additionally, molecular point-of-care (POC) diagnostics are leveraging electrochemical sensors to enhance the sensitivity and specificity of existing rapid tests, broadening diagnostic capabilities in settings such as hospital critical care units, physician offices, and outpatient clinics globally. Moreover, advancements in precise printing and processing technology, coupled with innovative product designs, are facilitating the development of next-generation medical and diagnostic electrochemical biosensors. These advancements are particularly evident in the creation of implantable glucose sensors aimed at managing diabetes, with solutions being devised for intravascular and subcutaneous applications.
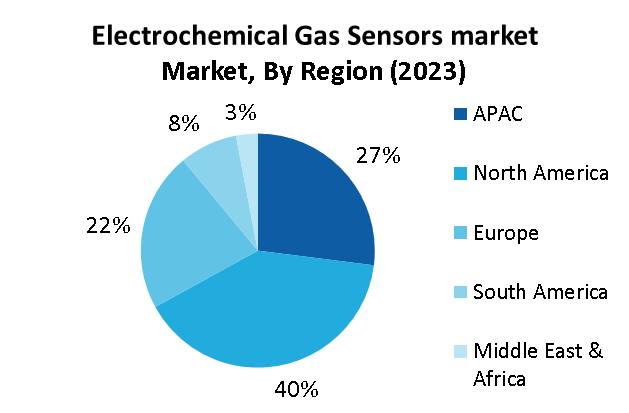
By Geography - Segment Analysis
North America is expected to dominate the market with the highest market share of 40% during the forecast period 2024-2030 .North America stands out as one of the leading markets for advanced research industries globally, driven by increasing R&D activities across various sectors such as biomedical, automotive, and building automation. Additionally, the region holds a significant position in the global market for advanced electronic devices and controls, attributed to robust domestic manufacturing, government support for disruptive technologies, and ongoing technological innovations in IT.
Furthermore, the anticipated growth in the smart cities market in North America, focusing on energy-efficient and conservation-related solutions, is poised to accelerate the adoption of electrochemical sensors from early stages to mass adoption. The region's electrochemical sensor market is also set to benefit from the continuous expansion of light vehicle production, alongside advancements in fuel efficiency and performance through the utilization of advanced and high-cost universal exhaust gas oxygen sensors (UEGO)
Drivers –Electrochemical Gas Sensor Market
Growing Need for Electrochemical Gas Sensor in Hazardous Environments
With the rising awareness about workplace safety and regulations, there is a growing demand for Electrochemical Gas Sensor to monitor and detect hazardous gases in industrial settings. Industries such as oil and gas, chemical manufacturing, and mining rely on these sensors to ensure the safety of their workers and facilities, driving the market growth
Advancements in Electrochemical Gas Sensor Technology and Miniaturization Trends
Ongoing advancements in sensor technology, coupled with miniaturization trends, are fueling the adoption of Electrochemical Gas Sensor. Manufacturers are developing sensors with improved accuracy, sensitivity, and response time, making them more reliable and efficient. Additionally, smaller sensor sizes allow for easier integration into various applications, including wearable devices, IoT systems, and mobile gas detection units, expanding the market potential.
Challenges – Digital Video Recorder Market.
Addressing Cross-Sensitivity Challenges in Electrochemical Gas Sensor.
Cross-sensitivity is a critical challenge faced by the Electrochemical Gas Sensor market. These sensors are susceptible to interference from other gases or environmental factors, which can result in inaccurate readings and false alarms. Managing and mitigating cross-sensitivity issues requires significant effort from both manufacturers and users. Manufacturers must design sensors with improved selectivity to minimize cross-sensitivity, while users need to carefully assess and monitor environmental conditions to ensure accurate gas detection. Despite ongoing advancements in sensor technology, addressing cross-sensitivity remains a complex challenge that requires continuous research and development efforts to enhance sensor performance and reliability
Market Landscape
Partnerships and acquisitions along with expansions are the key strategies adopted by the players in the Data Virtualization Market. The top ten Players in the Digital Video Recorder Market includes Bosch Sensortec GmbH, Figaro Engineering Inc., Amphenol Advanced Sensors, Cambridge CMOS Sensor, City Technology Ltd., Dynament Ltd., Membrapor AG, Alphasense, Sensirion AG and others.
Developments:
- In July 2022, scientists at the Suzhou Institute of Biomedical Engineering and Technology (SIBET) introduced a novel approach combining hand-in-hand structured DNA assembly with the creation of an electrochemical/fluorescent dual-mode biosensor. This innovative sensor was devised for detecting circulating tumor DNA and relies on the utilization of methylene blue and red-emissive carbon nanodots.
For more Automation and Instrumentation Market reports, please click here
1.1. Definitions and Scope
2. Electrochemical Gas Sensor Market - Executive summary
2.1. Market Revenue, Market Size and Key Trends by Company
2.2. Key Trends by type of Application
2.3. Key Trends segmented by Geography
3. Electrochemical Gas Sensor Market
3.1. Comparative analysis
3.1.1. Product Benchmarking - Top 10 companies
3.1.2. Top 5 Financials Analysis
3.1.3. Market Value split by Top 10 companies
3.1.4. Patent Analysis - Top 10 companies
3.1.5. Pricing Analysis
4. Electrochemical Gas Sensor Market – Startup companies Scenario Premium
4.1. Top 10 startup company Analysis by
4.1.1. Investment
4.1.2. Revenue
4.1.3. Market Shares
4.1.4. Market Size and Application Analysis
4.1.5. Venture Capital and Funding Scenario
5. Electrochemical Gas Sensor Market – Industry Market Entry Scenario Premium
5.1. Regulatory Framework Overview
5.2. New Business and Ease of Doing business index
5.3. Case studies of successful ventures
5.4. Customer Analysis – Top 10 companies
6. Electrochemical Gas Sensor Market Forces
6.1. Drivers
6.2. Constraints
6.3. Challenges
6.4. Porters five force model
6.4.1. Bargaining power of suppliers
6.4.2. Bargaining powers of customers
6.4.3. Threat of new entrants
6.4.4. Rivalry among existing players
6.4.5. Threat of substitutes
7. Electrochemical Gas Sensor Market -Strategic analysis
7.1. Value chain analysis
7.2. Opportunities analysis
7.3. Product life cycle
7.4. Suppliers and distributors Market Share
8. Electrochemical Gas Sensor Market – By Type (Market Size -$Million / $Billion)
8.1. Market Size and Market Share Analysis
8.2. Application Revenue and Trend Research
8.3. Product Segment Analysis
8.3.1. Oxygen
8.3.2. Carbon Monoxide (CO)
8.3.3. Carbon Dioxide(CO2)
8.3.4. Nitrogen Oxide
8.3.5. Ammonia
8.3.6. Hydrogen Sulfide (H2S)
8.3.7. Chlorine(CL)
8.3.8. Volatile Organic Compound (VOC)
8.3.9. Methane
8.3.10. Propane
8.3.11. Butane
8.3.12. Others
9. Electrochemical Gas Sensor – By End-User(Market Size -$Million / $Billion)
9.1. Segment type Size and Market Share Analysis
9.2. Application Revenue and Trends by type of Application
9.3. Application Segment Analysis by Type
9.3.1. Water & Wastewater Treatment
9.3.2. Automotive
9.3.3. Metal & Chemical Industry
9.3.4. Medical
9.3.5. Environmental
9.3.6. Food Industry
9.3.7. Oil & Gas
9.3.8. Consumer Electronics
9.3.9. Transport & Logistics
9.3.9. Power Stations
9.3.11. Building Automation and Domestic Application
9.3.12. Others
10. Electrochemical Gas Sensor - By Geography (Market Size -$Million / $Billion)
10.1. Electrochemical Gas Sensor Market - North America Segment Research
10.2. North America Market Research (Million / $Billion)
10.2.1. Segment type Size and Market Size Analysis
10.2.2. Revenue and Trends
10.2.3. Application Revenue and Trends by type of Application
10.2.4. Company Revenue and Product Analysis
10.2.5. North America Product type and Application Market Size
10.2.5.1. U.S.
10.2.5.2. Canada
10.2.5.3. Mexico
10.2.5.4. Rest of North America
10.3. Electrochemical Gas Sensor - South America Segment Research
10.4. South America Market Research (Market Size -$Million / $Billion)
10.4.1. Segment type Size and Market Size Analysis
10.4.2. Revenue and Trends
10.4.3. Application Revenue and Trends by type of Application
10.4.4. Company Revenue and Product Analysis
10.4.5. South America Product type and Application Market Size
10.4.5.1. Brazil
10.4.5.2. Venezuela
10.4.5.3. Argentina
10.4.5.4. Ecuador
10.4.5.5. Peru
10.4.5.6. Colombia
10.4.5.7. Costa Rica
10.4.5.8. Rest of South America
10.5. Electrochemical Gas Sensor - Europe Segment Research
10.6. Europe Market Research (Market Size -$Million / $Billion)
10.6.1. Segment type Size and Market Size Analysis
10.6.2. Revenue and Trends
10.6.3. Application Revenue and Trends by type of Application
10.6.4. Company Revenue and Product Analysis
10.6.5. Europe Segment Product type and Application Market Size
10.6.5.1. U.K
10.6.5.2. Germany
10.6.5.3. Italy
10.6.5.4. France
10.6.5.5. Netherlands
10.6.5.6. Belgium
10.6.5.7. Spain
10.6.5.8. Denmark
10.6.5.9. Rest of Europe
10.7. Electrochemical Gas Sensor – APAC Segment Research
10.8. APAC Market Research (Market Size -$Million / $Billion)
10.8.1. Segment type Size and Market Size Analysis
10.8.2. Revenue and Trends
10.8.3. Application Revenue and Trends by type of Application
10.8.4. Company Revenue and Product Analysis
10.8.5. APAC Segment – Product type and Application Market Size
10.8.5.1. China
10.8.5.2. Australia
10.8.5.3. Japan
10.8.5.4. South Korea
10.8.5.5. India
10.8.5.6. Taiwan
10.8.5.7. Malaysia
11. Electrochemical Gas Sensor Market - Entropy
11.1. New product launches
11.2. M&A's, collaborations, JVs and partnerships
12. Electrochemical Gas Sensor Market – Industry / Segment Competition landscape Premium
12.1. Market Share Analysis
12.1.1. Market Share by Country- Top companies
12.1.2. Market Share by Region- Top 10 companies
12.1.3. Market Share by type of Application – Top 10 companies
12.1.4. Market Share by type of Product / Product category- Top 10 companies
12.1.5. Market Share at global level- Top 10 companies
12.1.6. Best Practises for companies
13. Electrochemical Gas Sensor Market – Key Company List by Country Premium
14. Electrochemical Gas Sensor Market Company Analysis
14.1 Bosch Sensortec GmbH
14.2 Figaro Engineering Inc.
14.3 Amphenol Advanced Sensors
14.4 Cambridge CMOS Sensor
14.5 City Technology Ltd.
14.6 Dynament Ltd.
14.7 Membrapor AG
14.8 Alphasense
14.9 Sensirion AG
14.10 Broadcom Limited
List of Tables:
Table 1: Electrochemical Gas Sensor Market Overview 2023-2030
Table 2: Electrochemical Gas Sensor Market Leader Analysis 2023-2030 (US$)
Table 3: Electrochemical Gas Sensor Market Product Analysis 2023-2030 (US$)
Table 4: Electrochemical Gas Sensor Market End User Analysis 2023-2030 (US$)
Table 5: Electrochemical Gas Sensor Market Patent Analysis 2013-2023* (US$)
Table 6: Electrochemical Gas Sensor Market Financial Analysis 2023-2030 (US$)
Table 7: Electrochemical Gas Sensor Market Driver Analysis 2023-2030 (US$)
Table 8: Electrochemical Gas Sensor Market Challenges Analysis 2023-2030 (US$)
Table 9: Electrochemical Gas Sensor Market Constraint Analysis 2023-2030 (US$)
Table 10: Electrochemical Gas Sensor Market Supplier Bargaining Power Analysis 2023-2030 (US$)
Table 11: Electrochemical Gas Sensor Market Buyer Bargaining Power Analysis 2023-2030 (US$)
Table 12: Electrochemical Gas Sensor Market Threat of Substitutes Analysis 2023-2030 (US$)
Table 13: Electrochemical Gas Sensor Market Threat of New Entrants Analysis 2023-2030 (US$)
Table 14: Electrochemical Gas Sensor Market Degree of Competition Analysis 2023-2030 (US$)
Table 15: Electrochemical Gas Sensor Market Value Chain Analysis 2023-2030 (US$)
Table 16: Electrochemical Gas Sensor Market Pricing Analysis 2023-2030 (US$)
Table 17: Electrochemical Gas Sensor Market Opportunities Analysis 2023-2030 (US$)
Table 18: Electrochemical Gas Sensor Market Product Life Cycle Analysis 2023-2030 (US$)
Table 19: Electrochemical Gas Sensor Market Supplier Analysis 2023-2030 (US$)
Table 20: Electrochemical Gas Sensor Market Distributor Analysis 2023-2030 (US$)
Table 21: Electrochemical Gas Sensor Market Trend Analysis 2023-2030 (US$)
Table 22: Electrochemical Gas Sensor Market Size 2023 (US$)
Table 23: Electrochemical Gas Sensor Market Forecast Analysis 2023-2030 (US$)
Table 24: Electrochemical Gas Sensor Market Sales Forecast Analysis 2023-2030 (Units)
Table 25: Electrochemical Gas Sensor Market, Revenue & Volume, By Type, 2023-2030 ($)
Table 26: Electrochemical Gas Sensor Market By Type, Revenue & Volume, By Oxygen, 2023-2030 ($)
Table 27: Electrochemical Gas Sensor Market By Type, Revenue & Volume, By Carbon Monoxide (CO), 2023-2030 ($)
Table 28: Electrochemical Gas Sensor Market By Type, Revenue & Volume, By Carbon Dioxide(CO2), 2023-2030 ($)
Table 29: Electrochemical Gas Sensor Market By Type, Revenue & Volume, By Nitrogen Oxide, 2023-2030 ($)
Table 30: Electrochemical Gas Sensor Market By Type, Revenue & Volume, By Ammonia, 2023-2030 ($)
Table 31: Electrochemical Gas Sensor Market, Revenue & Volume, By End-User, 2023-2030 ($)
Table 32: Electrochemical Gas Sensor Market By End-User, Revenue & Volume, By Water & Wastewater Treatment, 2023-2030 ($)
Table 33: Electrochemical Gas Sensor Market By End-User, Revenue & Volume, By Automotive, 2023-2030 ($)
Table 34: Electrochemical Gas Sensor Market By End-User, Revenue & Volume, By Metal & Chemical Industry, 2023-2030 ($)
Table 35: Electrochemical Gas Sensor Market By End-User, Revenue & Volume, By Medical, 2023-2030 ($)
Table 36: Electrochemical Gas Sensor Market By End-User, Revenue & Volume, By Environmental, 2023-2030 ($)
Table 37: North America Electrochemical Gas Sensor Market, Revenue & Volume, By Type, 2023-2030 ($)
Table 38: North America Electrochemical Gas Sensor Market, Revenue & Volume, By End-User, 2023-2030 ($)
Table 39: South america Electrochemical Gas Sensor Market, Revenue & Volume, By Type, 2023-2030 ($)
Table 40: South america Electrochemical Gas Sensor Market, Revenue & Volume, By End-User, 2023-2030 ($)
Table 41: Europe Electrochemical Gas Sensor Market, Revenue & Volume, By Type, 2023-2030 ($)
Table 42: Europe Electrochemical Gas Sensor Market, Revenue & Volume, By End-User, 2023-2030 ($)
Table 43: APAC Electrochemical Gas Sensor Market, Revenue & Volume, By Type, 2023-2030 ($)
Table 44: APAC Electrochemical Gas Sensor Market, Revenue & Volume, By End-User, 2023-2030 ($)
Table 45: Middle East & Africa Electrochemical Gas Sensor Market, Revenue & Volume, By Type, 2023-2030 ($)
Table 46: Middle East & Africa Electrochemical Gas Sensor Market, Revenue & Volume, By End-User, 2023-2030 ($)
Table 47: Russia Electrochemical Gas Sensor Market, Revenue & Volume, By Type, 2023-2030 ($)
Table 48: Russia Electrochemical Gas Sensor Market, Revenue & Volume, By End-User, 2023-2030 ($)
Table 49: Israel Electrochemical Gas Sensor Market, Revenue & Volume, By Type, 2023-2030 ($)
Table 50: Israel Electrochemical Gas Sensor Market, Revenue & Volume, By End-User, 2023-2030 ($)
Table 51: Top Companies 2023 (US$)Electrochemical Gas Sensor Market, Revenue & Volume
Table 52: Product Launch 2023-2030Electrochemical Gas Sensor Market, Revenue & Volume
Table 53: Mergers & Acquistions 2023-2030Electrochemical Gas Sensor Market, Revenue & Volume
List of Figures:
Figure 1: Overview of Electrochemical Gas Sensor Market 2023-2030
Figure 2: Market Share Analysis for Electrochemical Gas Sensor Market 2023 (US$)
Figure 3: Product Comparison in Electrochemical Gas Sensor Market 2023-2030 (US$)
Figure 4: End User Profile for Electrochemical Gas Sensor Market 2023-2030 (US$)
Figure 5: Patent Application and Grant in Electrochemical Gas Sensor Market 2013-2023* (US$)
Figure 6: Top 5 Companies Financial Analysis in Electrochemical Gas Sensor Market 2023-2030 (US$)
Figure 7: Market Entry Strategy in Electrochemical Gas Sensor Market 2023-2030
Figure 8: Ecosystem Analysis in Electrochemical Gas Sensor Market 2023
Figure 9: Average Selling Price in Electrochemical Gas Sensor Market 2023-2030
Figure 10: Top Opportunites in Electrochemical Gas Sensor Market 2023-2030
Figure 11: Market Life Cycle Analysis in Electrochemical Gas Sensor Market
Figure 12: GlobalBy TypeElectrochemical Gas Sensor Market Revenue, 2023-2030 ($)
Figure 13: GlobalBy End-User Electrochemical Gas Sensor Market Revenue, 2023-2030 ($)
Figure 14: Global Electrochemical Gas Sensor Market - By Geography
Figure 15: Global Electrochemical Gas Sensor Market Value & Volume, By Geography, 2023-2030 ($)
Figure 16: Global Electrochemical Gas Sensor Market CAGR, By Geography, 2023-2030 (%)
Figure 17: North America Electrochemical Gas Sensor Market Value & Volume, 2023-2030 ($)
Figure 18: US Electrochemical Gas Sensor Market Value & Volume, 2023-2030 ($)
Figure 19: US GDP and Population, 2023-2030 ($)
Figure 20: US GDP – Composition of 2023, By Sector of Origin
Figure 21: US Export and Import Value & Volume, 2023-2030 ($)
Figure 22: Canada Electrochemical Gas Sensor Market Value & Volume, 2023-2030 ($)
Figure 23: Canada GDP and Population, 2023-2030 ($)
Figure 24: Canada GDP – Composition of 2023, By Sector of Origin
Figure 25: Canada Export and Import Value & Volume, 2023-2030 ($)
Figure 26: Mexico Electrochemical Gas Sensor Market Value & Volume, 2023-2030 ($)
Figure 27: Mexico GDP and Population, 2023-2030 ($)
Figure 28: Mexico GDP – Composition of 2023, By Sector of Origin
Figure 29: Mexico Export and Import Value & Volume, 2023-2030 ($)
Figure 30: South America Electrochemical Gas Sensor Market Value & Volume, 2023-2030 ($)
Figure 31: Brazil Electrochemical Gas Sensor Market Value & Volume, 2023-2030 ($)
Figure 32: Brazil GDP and Population, 2023-2030 ($)
Figure 33: Brazil GDP – Composition of 2023, By Sector of Origin
Figure 34: Brazil Export and Import Value & Volume, 2023-2030 ($)
Figure 35: Venezuela Electrochemical Gas Sensor Market Value & Volume, 2023-2030 ($)
Figure 36: Venezuela GDP and Population, 2023-2030 ($)
Figure 37: Venezuela GDP – Composition of 2023, By Sector of Origin
Figure 38: Venezuela Export and Import Value & Volume, 2023-2030 ($)
Figure 39: Argentina Electrochemical Gas Sensor Market Value & Volume, 2023-2030 ($)
Figure 40: Argentina GDP and Population, 2023-2030 ($)
Figure 41: Argentina GDP – Composition of 2023, By Sector of Origin
Figure 42: Argentina Export and Import Value & Volume, 2023-2030 ($)
Figure 43: Ecuador Electrochemical Gas Sensor Market Value & Volume, 2023-2030 ($)
Figure 44: Ecuador GDP and Population, 2023-2030 ($)
Figure 45: Ecuador GDP – Composition of 2023, By Sector of Origin
Figure 46: Ecuador Export and Import Value & Volume, 2023-2030 ($)
Figure 47: Peru Electrochemical Gas Sensor Market Value & Volume, 2023-2030 ($)
Figure 48: Peru GDP and Population, 2023-2030 ($)
Figure 49: Peru GDP – Composition of 2023, By Sector of Origin
Figure 50: Peru Export and Import Value & Volume, 2023-2030 ($)
Figure 51: Colombia Electrochemical Gas Sensor Market Value & Volume, 2023-2030 ($)
Figure 52: Colombia GDP and Population, 2023-2030 ($)
Figure 53: Colombia GDP – Composition of 2023, By Sector of Origin
Figure 54: Colombia Export and Import Value & Volume, 2023-2030 ($)
Figure 55: Costa Rica Electrochemical Gas Sensor Market Value & Volume, 2023-2030 ($)
Figure 56: Costa Rica GDP and Population, 2023-2030 ($)
Figure 57: Costa Rica GDP – Composition of 2023, By Sector of Origin
Figure 58: Costa Rica Export and Import Value & Volume, 2023-2030 ($)
Figure 59: Europe Electrochemical Gas Sensor Market Value & Volume, 2023-2030 ($)
Figure 60: U.K Electrochemical Gas Sensor Market Value & Volume, 2023-2030 ($)
Figure 61: U.K GDP and Population, 2023-2030 ($)
Figure 62: U.K GDP – Composition of 2023, By Sector of Origin
Figure 63: U.K Export and Import Value & Volume, 2023-2030 ($)
Figure 64: Germany Electrochemical Gas Sensor Market Value & Volume, 2023-2030 ($)
Figure 65: Germany GDP and Population, 2023-2030 ($)
Figure 66: Germany GDP – Composition of 2023, By Sector of Origin
Figure 67: Germany Export and Import Value & Volume, 2023-2030 ($)
Figure 68: Italy Electrochemical Gas Sensor Market Value & Volume, 2023-2030 ($)
Figure 69: Italy GDP and Population, 2023-2030 ($)
Figure 70: Italy GDP – Composition of 2023, By Sector of Origin
Figure 71: Italy Export and Import Value & Volume, 2023-2030 ($)
Figure 72: France Electrochemical Gas Sensor Market Value & Volume, 2023-2030 ($)
Figure 73: France GDP and Population, 2023-2030 ($)
Figure 74: France GDP – Composition of 2023, By Sector of Origin
Figure 75: France Export and Import Value & Volume, 2023-2030 ($)
Figure 76: Netherlands Electrochemical Gas Sensor Market Value & Volume, 2023-2030 ($)
Figure 77: Netherlands GDP and Population, 2023-2030 ($)
Figure 78: Netherlands GDP – Composition of 2023, By Sector of Origin
Figure 79: Netherlands Export and Import Value & Volume, 2023-2030 ($)
Figure 80: Belgium Electrochemical Gas Sensor Market Value & Volume, 2023-2030 ($)
Figure 81: Belgium GDP and Population, 2023-2030 ($)
Figure 82: Belgium GDP – Composition of 2023, By Sector of Origin
Figure 83: Belgium Export and Import Value & Volume, 2023-2030 ($)
Figure 84: Spain Electrochemical Gas Sensor Market Value & Volume, 2023-2030 ($)
Figure 85: Spain GDP and Population, 2023-2030 ($)
Figure 86: Spain GDP – Composition of 2023, By Sector of Origin
Figure 87: Spain Export and Import Value & Volume, 2023-2030 ($)
Figure 88: Denmark Electrochemical Gas Sensor Market Value & Volume, 2023-2030 ($)
Figure 89: Denmark GDP and Population, 2023-2030 ($)
Figure 90: Denmark GDP – Composition of 2023, By Sector of Origin
Figure 91: Denmark Export and Import Value & Volume, 2023-2030 ($)
Figure 92: APAC Electrochemical Gas Sensor Market Value & Volume, 2023-2030 ($)
Figure 93: China Electrochemical Gas Sensor Market Value & Volume, 2023-2030
Figure 94: China GDP and Population, 2023-2030 ($)
Figure 95: China GDP – Composition of 2023, By Sector of Origin
Figure 96: China Export and Import Value & Volume, 2023-2030 ($)Electrochemical Gas Sensor Market China Export and Import Value & Volume, 2023-2030 ($)
Figure 97: Australia Electrochemical Gas Sensor Market Value & Volume, 2023-2030 ($)
Figure 98: Australia GDP and Population, 2023-2030 ($)
Figure 99: Australia GDP – Composition of 2023, By Sector of Origin
Figure 100: Australia Export and Import Value & Volume, 2023-2030 ($)
Figure 101: South Korea Electrochemical Gas Sensor Market Value & Volume, 2023-2030 ($)
Figure 102: South Korea GDP and Population, 2023-2030 ($)
Figure 103: South Korea GDP – Composition of 2023, By Sector of Origin
Figure 104: South Korea Export and Import Value & Volume, 2023-2030 ($)
Figure 105: India Electrochemical Gas Sensor Market Value & Volume, 2023-2030 ($)
Figure 106: India GDP and Population, 2023-2030 ($)
Figure 107: India GDP – Composition of 2023, By Sector of Origin
Figure 108: India Export and Import Value & Volume, 2023-2030 ($)
Figure 109: Taiwan Electrochemical Gas Sensor Market Value & Volume, 2023-2030 ($)
Figure 110: Taiwan GDP and Population, 2023-2030 ($)
Figure 111: Taiwan GDP – Composition of 2023, By Sector of Origin
Figure 112: Taiwan Export and Import Value & Volume, 2023-2030 ($)
Figure 113: Malaysia Electrochemical Gas Sensor Market Value & Volume, 2023-2030 ($)
Figure 114: Malaysia GDP and Population, 2023-2030 ($)
Figure 115: Malaysia GDP – Composition of 2023, By Sector of Origin
Figure 116: Malaysia Export and Import Value & Volume, 2023-2030 ($)
Figure 117: Hong Kong Electrochemical Gas Sensor Market Value & Volume, 2023-2030 ($)
Figure 118: Hong Kong GDP and Population, 2023-2030 ($)
Figure 119: Hong Kong GDP – Composition of 2023, By Sector of Origin
Figure 120: Hong Kong Export and Import Value & Volume, 2023-2030 ($)
Figure 121: Middle East & Africa Electrochemical Gas Sensor Market Middle East & Africa 3D Printing Market Value & Volume, 2023-2030 ($)
Figure 122: Russia Electrochemical Gas Sensor Market Value & Volume, 2023-2030 ($)
Figure 123: Russia GDP and Population, 2023-2030 ($)
Figure 124: Russia GDP – Composition of 2023, By Sector of Origin
Figure 125: Russia Export and Import Value & Volume, 2023-2030 ($)
Figure 126: Israel Electrochemical Gas Sensor Market Value & Volume, 2023-2030 ($)
Figure 127: Israel GDP and Population, 2023-2030 ($)
Figure 128: Israel GDP – Composition of 2023, By Sector of Origin
Figure 129: Israel Export and Import Value & Volume, 2023-2030 ($)
Figure 130: Entropy Share, By Strategies, 2023-2030* (%)Electrochemical Gas Sensor Market
Figure 131: Developments, 2023-2030*Electrochemical Gas Sensor Market
Figure 132: Company 1 Electrochemical Gas Sensor Market Net Revenue, By Years, 2023-2030* ($)
Figure 133: Company 1 Electrochemical Gas Sensor Market Net Revenue Share, By Business segments, 2023 (%)
Figure 134: Company 1 Electrochemical Gas Sensor Market Net Sales Share, By Geography, 2023 (%)
Figure 135: Company 2 Electrochemical Gas Sensor Market Net Revenue, By Years, 2023-2030* ($)
Figure 136: Company 2 Electrochemical Gas Sensor Market Net Revenue Share, By Business segments, 2023 (%)
Figure 137: Company 2 Electrochemical Gas Sensor Market Net Sales Share, By Geography, 2023 (%)
Figure 138: Company 3 Electrochemical Gas Sensor Market Net Revenue, By Years, 2023-2030* ($)
Figure 139: Company 3 Electrochemical Gas Sensor Market Net Revenue Share, By Business segments, 2023 (%)
Figure 140: Company 3 Electrochemical Gas Sensor Market Net Sales Share, By Geography, 2023 (%)
Figure 141: Company 4 Electrochemical Gas Sensor Market Net Revenue, By Years, 2023-2030* ($)
Figure 142: Company 4 Electrochemical Gas Sensor Market Net Revenue Share, By Business segments, 2023 (%)
Figure 143: Company 4 Electrochemical Gas Sensor Market Net Sales Share, By Geography, 2023 (%)
Figure 144: Company 5 Electrochemical Gas Sensor Market Net Revenue, By Years, 2023-2030* ($)
Figure 145: Company 5 Electrochemical Gas Sensor Market Net Revenue Share, By Business segments, 2023 (%)
Figure 146: Company 5 Electrochemical Gas Sensor Market Net Sales Share, By Geography, 2023 (%)
Figure 147: Company 6 Electrochemical Gas Sensor Market Net Revenue, By Years, 2023-2030* ($)
Figure 148: Company 6 Electrochemical Gas Sensor Market Net Revenue Share, By Business segments, 2023 (%)
Figure 149: Company 6 Electrochemical Gas Sensor Market Net Sales Share, By Geography, 2023 (%)
Figure 150: Company 7 Electrochemical Gas Sensor Market Net Revenue, By Years, 2023-2030* ($)
Figure 151: Company 7 Electrochemical Gas Sensor Market Net Revenue Share, By Business segments, 2023 (%)
Figure 152: Company 7 Electrochemical Gas Sensor Market Net Sales Share, By Geography, 2023 (%)
Figure 153: Company 8 Electrochemical Gas Sensor Market Net Revenue, By Years, 2023-2030* ($)
Figure 154: Company 8 Electrochemical Gas Sensor Market Net Revenue Share, By Business segments, 2023 (%)
Figure 155: Company 8 Electrochemical Gas Sensor Market Net Sales Share, By Geography, 2023 (%)
Figure 156: Company 9 Electrochemical Gas Sensor Market Net Revenue, By Years, 2023-2030* ($)
Figure 157: Company 9 Electrochemical Gas Sensor Market Net Revenue Share, By Business segments, 2023 (%)
Figure 158: Company 9 Electrochemical Gas Sensor Market Net Sales Share, By Geography, 2023 (%)
Figure 159: Company 10 Electrochemical Gas Sensor Market Net Revenue, By Years, 2023-2030* ($)
Figure 160: Company 10 Electrochemical Gas Sensor Market Net Revenue Share, By Business segments, 2023 (%)
Figure 161: Company 10 Electrochemical Gas Sensor Market Net Sales Share, By Geography, 2023 (%)
Figure 162: Company 11 Electrochemical Gas Sensor Market Net Revenue, By Years, 2023-2030* ($)
Figure 163: Company 11 Electrochemical Gas Sensor Market Net Revenue Share, By Business segments, 2023 (%)
Figure 164: Company 11 Electrochemical Gas Sensor Market Net Sales Share, By Geography, 2023 (%)
Figure 165: Company 12 Electrochemical Gas Sensor Market Net Revenue, By Years, 2023-2030* ($)
Figure 166: Company 12 Electrochemical Gas Sensor Market Net Revenue Share, By Business segments, 2023 (%)
Figure 167: Company 12 Electrochemical Gas Sensor Market Net Sales Share, By Geography, 2023 (%)
Figure 168: Company 13 Electrochemical Gas Sensor Market Net Revenue, By Years, 2023-2030* ($)
Figure 169: Company 13 Electrochemical Gas Sensor Market Net Revenue Share, By Business segments, 2023 (%)
Figure 170: Company 13 Electrochemical Gas Sensor Market Net Sales Share, By Geography, 2023 (%)
Figure 171: Company 14 Electrochemical Gas Sensor Market Net Revenue, By Years, 2023-2030* ($)
Figure 172: Company 14 Electrochemical Gas Sensor Market Net Revenue Share, By Business segments, 2023 (%)
Figure 173: Company 14 Electrochemical Gas Sensor Market Net Sales Share, By Geography, 2023 (%)
Figure 174: Company 15 Electrochemical Gas Sensor Market Net Revenue, By Years, 2023-2030* ($)
Figure 175: Company 15 Electrochemical Gas Sensor Market Net Revenue Share, By Business segments, 2023 (%)
Figure 176: Company 15 Electrochemical Gas Sensor Market Net Sales Share, By Geography, 2023 (%)