 Email
Email Print
Print


Butyl Glycol Market Overview
The Butyl Glycol Market size is estimated to reach US$946 million by 2027, after growing at a CAGR of 3.8% during the forecast period 2022-2027. Butyl glycol is a clear and colorless oily liquid and like other glycol ethers offers bi-functional nature, containing the ether and alcohol groups and forming peroxides. It has flourishing demand as a solvent for applicability in flexographic printing inks, paints, waterborne coating surfaces, hydraulic fluid components and others, thereby having significant utilization across major end-use industries. The rapid building & construction activities and infrastructural projects act as a driving factor in the butyl glycol industry. In addition, the growing applicability of butyl glycol in the agricultural and chemical sectors is fuelling its growth scope. The covid-19 outbreak resulted in a major hamper for the Butyl Glycol Market due to restricted demand in major end-use industries, production halt, supply chain disruption and other lockdown regulations. However, a significant recovery in the building & construction sector, which increases demand for coatings & paints, is boosting the demand for butyl glycol. Thus, the butyl glycol industry is anticipated to grow and contributes to the growing Butyl Glycol Market size during the forecast period.
Butyl Glycol Market Report Coverage
The “Butyl
Glycol Market Report – Forecast (2022-2027)” by IndustryARC, covers an in-depth
analysis of the following segments in the Butyl Glycol Market.
Key Takeaways
- North America dominates the Butyl Glycol Market, owing to the growing building & construction activities, rising chemical production and rapid urbanization, thereby propelling the growth of phenylethyl in this region.
- The growing building & construction sector across the world is propelling the demand for the butyl glycol industry for various applications involving coatings, paints and others, thereby contributing to the growing Butyl Glycol Market size.
- The solvent function is growing rapidly in the butyl glycol industry for major utilization in flexographic printing inks, coatings, chemicals and others.
- However, the carcinogenic impacts of butyl glycols act as a major challenge for the Butyl Glycol industry.
Butyl Glycol Market Segment Analysis – by Function
The solvent segment held the largest Butyl
Glycol Market share in 2021 and is forecasted to grow at a CAGR of 3.6% during
the forecast period 2022-2027. The growth of the solvent function of the butyl
glycol is influenced by its fast-paced demand in paints, coatings, cleaning
activities, flexographic printing, disinfectants and others. This is due to its
low cost and volatility feature. The functioning of butyl glycol, belonging to
the glycol ether group as a solvent in the chemical sector is also rising owing
to its excellent hydrophobic and hydrophilic balance, excellent active solvency
and coupling features. Thus, due to flourished utilization of solvent function
of butyl alcohol across major sectors, majorly coatings, the solvent segment is
projected to grow rapidly in the Butyl Glycol Market during the forecast
period.
Butyl Glycol Market Segment Analysis – by Application
The coatings segment held a significant Butyl
Glycol Market share in 2021 and is projected to grow at a CAGR of 3.4% during
the forecast period 2022-2027. The butyl
glycol has major demand for utilization in coatings applications as it has wide
functioning in water coatings due to improved drying time. The coatings
application of butyl glycol has major utility in the construction sector for
residential, commercial and industrial spaces. The lucrative growth in the construction
sector is influenced by growth factors such as a rise in residential housing
and commercial spaces projects, demand for modular construction and
urbanization. For instance, according to the Office for National Statistics,
the monthly construction output increased by 1.5% in terms of volume in May
2022, marking a rise of 0.3% from April 2022. According to the International
Trade Administration (ITA), the construction sector in China is projected to
grow by an annual average of 8.6% between 2022 and 2030. With the robust growth
in the building & construction sector, the demand for coatings application,
majorly waterborne coatings for paints, varnishes and others is anticipated to
grow, which, in turn, is projected to boost the growth scope for coating
applications in the Butyl Glycol Market during the forecast period.
Butyl Glycol Market Segment Analysis – by Geography
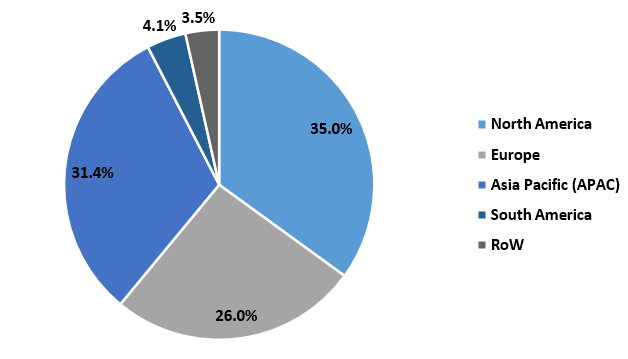
North America held the largest Butyl Glycol Market share in 2021 up to 35%. The fast-paced growth of butyl glycol in this region is influenced by factors such as an established base for building & construction, rising income levels and urbanization. Building and construction are significantly growing in North America owing to growth factors such as growing infrastructural projects, demand for green buildings and urbanization. According to Statistics Canada, the investment in commercial construction increased by 1.7% in December 2021 compared to the previous year. According to the U.S. Census Bureau, construction spending in the U.S increased from a seasonally adjusted annual rate of US$1740.6 billion in March 2022 to US$1744.8 billion in April 2022. For instance, according to Statistics Canada, the total investment in building construction saw an increase of 2.7% in April 2022 over the previous month. According to International Trade Administration (ITA), the forecasted construction value in Mexico saw growth from US$72.89 billion in 202 to US$82.56 billion in 2022. With the increase in building & construction activities, the demand for butyl glycol for a wide range of applicability in waterborne coatings, paints and others is growing, which, in turn, is anticipated to boost the growth of the butyl glycol industry in the North America region during the forecast period.
Butyl Glycol Market Drivers
Bolstering Growth in the Automotive Sector :
The butyl glycol has flourishing
applications in the automotive sector for paints, waterborne coatings, varnish and
others. The automotive industry is significantly flourishing owing to growth
factors such as urbanization, initiatives for vehicle electrification and
rising demand for passenger vehicles among the middle-class segment. For
instance, according to the International Organization of Motor Vehicle
Manufacturers (OICA), global automotive vehicle production saw an increase
from 77,621,582 units in the year 2020 to 80,145,988 units in the year 2021. According to the Society of Indian
Automobile Manufacturers (SIAM), the
production of passenger vehicles, commercial vehicles, three-wheelers,
two-wheelers and quadricycles increased from 22,655,69 units in 2020-21 to
22,933,230 units in 2021-22 in India. With the increase in automotive vehicle
production, the demand for butyl glycol in coatings, paints and varnishes for the
automotive body is rising, which, in turn, is boosting its applicability and
driving the butyl glycol industry.
Rising Growth from the Chemical Sector:
Butyl Glycol is increasingly used as a solvent
and chemical intermediate in the chemicals sector for a wide range of
applications in producing butyl glycol acetate, chemical reaction solvent and
others. The lucrative growth of the chemical industry is influenced by growth
factors such as rising demand for organic and inorganic chemicals, an
established base for specialty chemicals and flourishing chemical manufacturing
units. For instance, according to India Brand Equity Foundation (IBEF), the
chemical sector in India is projected to reach US$304 billion by 2025,
registering a CAGR of 9% per annum by 2025. According to the American Chemistry
Council (ACC), the chemical sector output in the U.S. is expected to grow by
4.1% in 2022 and expand to 2.4% growth in 2023. With the increase in chemical
production, the applicability of butyl glycol as a chemical intermediate,
solvent and others are rising, which, in turn, is driving the butyl glycol
industry.
Butyl Glycol Market Challenges
Carcinogenic Nature and Toxicity:
Butyl Glycol is moderately toxic. It is listed
under the Toxics Release Inventory owing to its carcinogenicity. Short-term
exposures lead to necrosis and pulmonary edema and long-term exposure can lead
to nausea, anemia, adverse reproductive disorders and anorexia. Moreover, butyl
glycol, belonging to glycol ethers has low acute toxicity that creates major
health hazards in the animals due to long-term exposure. The threat of adrenal tumors in animals is one
such hazardous impact. For instance, according to the American Conference of
Government Industrial hygienists, butyl glycol is considered carcinogenic for
rodents. Thus, owing to such growth-restraining factors, the demand and
applicability are majorly impacted, thereby; the butyl glycol industry
anticipates major challenges and slow down.
Butyl Glycol Industry Outlook
Technology launches, acquisitions and R&D
activities are key strategies adopted by players in the Butyl Glycol Market. The
top 10 companies in Butyl Glycol Market are:
- Eastman Chemicals Co.
- LyondellBasell Industries N.V.
- BASF SE
- Asia Pacific Petrochemicals Co. Ltd.
- Dow Chemicals
- Nippon Nyukazai Co. Ltd.
- Sasol Ltd.
- KH Chemicals
- Lotte Chemical Corporation
- Sadara Chemical Company
Recent Development
- In August 2021, BASF and Sinopec expanded the joint venture at the Verbund site by expanding the production capabilities in various chemical manufacturing units, including glycol ethers, which include butyl glycol, thereby boosting the production scope in the market.
Relevant Reports
Report Code: CMR 0127
Report Code: CMR 76463
Report Code: CMR 66352
For more Chemicals and Materials Market reports, please click here
Table 1: Butyl Glycol Market Overview 2023-2030
Table 2: Butyl Glycol Market Leader Analysis 2023-2030 (US$)
Table 3: Butyl Glycol Market Product Analysis 2023-2030 (US$)
Table 4: Butyl Glycol Market End User Analysis 2023-2030 (US$)
Table 5: Butyl Glycol Market Patent Analysis 2013-2023* (US$)
Table 6: Butyl Glycol Market Financial Analysis 2023-2030 (US$)
Table 7: Butyl Glycol Market Driver Analysis 2023-2030 (US$)
Table 8: Butyl Glycol Market Challenges Analysis 2023-2030 (US$)
Table 9: Butyl Glycol Market Constraint Analysis 2023-2030 (US$)
Table 10: Butyl Glycol Market Supplier Bargaining Power Analysis 2023-2030 (US$)
Table 11: Butyl Glycol Market Buyer Bargaining Power Analysis 2023-2030 (US$)
Table 12: Butyl Glycol Market Threat of Substitutes Analysis 2023-2030 (US$)
Table 13: Butyl Glycol Market Threat of New Entrants Analysis 2023-2030 (US$)
Table 14: Butyl Glycol Market Degree of Competition Analysis 2023-2030 (US$)
Table 15: Butyl Glycol Market Value Chain Analysis 2023-2030 (US$)
Table 16: Butyl Glycol Market Pricing Analysis 2023-2030 (US$)
Table 17: Butyl Glycol Market Opportunities Analysis 2023-2030 (US$)
Table 18: Butyl Glycol Market Product Life Cycle Analysis 2023-2030 (US$)
Table 19: Butyl Glycol Market Supplier Analysis 2023-2030 (US$)
Table 20: Butyl Glycol Market Distributor Analysis 2023-2030 (US$)
Table 21: Butyl Glycol Market Trend Analysis 2023-2030 (US$)
Table 22: Butyl Glycol Market Size 2023 (US$)
Table 23: Butyl Glycol Market Forecast Analysis 2023-2030 (US$)
Table 24: Butyl Glycol Market Sales Forecast Analysis 2023-2030 (Units)
Table 25: Butyl Glycol Market, Revenue & Volume,By Application, 2023-2030 ($)
Table 26: Butyl Glycol Market By Application, Revenue & Volume,By Skin Care, 2023-2030 ($)
Table 27: Butyl Glycol Market By Application, Revenue & Volume,By Eye Care, 2023-2030 ($)
Table 28: Butyl Glycol Market By Application, Revenue & Volume,By Hair Products, 2023-2030 ($)
Table 29: Butyl Glycol Market By Application, Revenue & Volume,By Food & Beverage, 2023-2030 ($)
Table 30: Butyl Glycol Market By Application, Revenue & Volume,By Industrial Application, 2023-2030 ($)
Table 31: North America Butyl Glycol Market, Revenue & Volume,By Application, 2023-2030 ($)
Table 32: South america Butyl Glycol Market, Revenue & Volume,By Application, 2023-2030 ($)
Table 33: Europe Butyl Glycol Market, Revenue & Volume,By Application, 2023-2030 ($)
Table 34: APAC Butyl Glycol Market, Revenue & Volume,By Application, 2023-2030 ($)
Table 35: Middle East & Africa Butyl Glycol Market, Revenue & Volume,By Application, 2023-2030 ($)
Table 36: Russia Butyl Glycol Market, Revenue & Volume,By Application, 2023-2030 ($)
Table 37: Israel Butyl Glycol Market, Revenue & Volume,By Application, 2023-2030 ($)
Table 38: Top Companies 2023 (US$)Butyl Glycol Market, Revenue & Volume
Table 39: Product Launch 2023-2030Butyl Glycol Market, Revenue & Volume
Table 40: Mergers & Acquistions 2023-2030Butyl Glycol Market, Revenue & Volume
List of Figures
Figure 1: Overview of Butyl Glycol Market 2023-2030
Figure 2: Market Share Analysis for Butyl Glycol Market 2023 (US$)
Figure 3: Product Comparison in Butyl Glycol Market 2023-2030 (US$)
Figure 4: End User Profile for Butyl Glycol Market 2023-2030 (US$)
Figure 5: Patent Application and Grant in Butyl Glycol Market 2013-2023* (US$)
Figure 6: Top 5 Companies Financial Analysis in Butyl Glycol Market 2023-2030 (US$)
Figure 7: Market Entry Strategy in Butyl Glycol Market 2023-2030
Figure 8: Ecosystem Analysis in Butyl Glycol Market 2023
Figure 9: Average Selling Price in Butyl Glycol Market 2023-2030
Figure 10: Top Opportunites in Butyl Glycol Market 2023-2030
Figure 11: Market Life Cycle Analysis in Butyl Glycol Market
Figure 12: GlobalBy ApplicationButyl Glycol Market Revenue, 2023-2030 ($)
Figure 13: Global Butyl Glycol Market - By Geography
Figure 14: Global Butyl Glycol Market Value & Volume, By Geography, 2023-2030 ($)
Figure 15: Global Butyl Glycol Market CAGR, By Geography, 2023-2030 (%)
Figure 16: North America Butyl Glycol Market Value & Volume, 2023-2030 ($)
Figure 17: US Butyl Glycol Market Value & Volume, 2023-2030 ($)
Figure 18: US GDP and Population, 2023-2030 ($)
Figure 19: US GDP – Composition of 2023, By Sector of Origin
Figure 20: US Export and Import Value & Volume, 2023-2030 ($)
Figure 21: Canada Butyl Glycol Market Value & Volume, 2023-2030 ($)
Figure 22: Canada GDP and Population, 2023-2030 ($)
Figure 23: Canada GDP – Composition of 2023, By Sector of Origin
Figure 24: Canada Export and Import Value & Volume, 2023-2030 ($)
Figure 25: Mexico Butyl Glycol Market Value & Volume, 2023-2030 ($)
Figure 26: Mexico GDP and Population, 2023-2030 ($)
Figure 27: Mexico GDP – Composition of 2023, By Sector of Origin
Figure 28: Mexico Export and Import Value & Volume, 2023-2030 ($)
Figure 29: South America Butyl Glycol Market Value & Volume, 2023-2030 ($)
Figure 30: Brazil Butyl Glycol Market Value & Volume, 2023-2030 ($)
Figure 31: Brazil GDP and Population, 2023-2030 ($)
Figure 32: Brazil GDP – Composition of 2023, By Sector of Origin
Figure 33: Brazil Export and Import Value & Volume, 2023-2030 ($)
Figure 34: Venezuela Butyl Glycol Market Value & Volume, 2023-2030 ($)
Figure 35: Venezuela GDP and Population, 2023-2030 ($)
Figure 36: Venezuela GDP – Composition of 2023, By Sector of Origin
Figure 37: Venezuela Export and Import Value & Volume, 2023-2030 ($)
Figure 38: Argentina Butyl Glycol Market Value & Volume, 2023-2030 ($)
Figure 39: Argentina GDP and Population, 2023-2030 ($)
Figure 40: Argentina GDP – Composition of 2023, By Sector of Origin
Figure 41: Argentina Export and Import Value & Volume, 2023-2030 ($)
Figure 42: Ecuador Butyl Glycol Market Value & Volume, 2023-2030 ($)
Figure 43: Ecuador GDP and Population, 2023-2030 ($)
Figure 44: Ecuador GDP – Composition of 2023, By Sector of Origin
Figure 45: Ecuador Export and Import Value & Volume, 2023-2030 ($)
Figure 46: Peru Butyl Glycol Market Value & Volume, 2023-2030 ($)
Figure 47: Peru GDP and Population, 2023-2030 ($)
Figure 48: Peru GDP – Composition of 2023, By Sector of Origin
Figure 49: Peru Export and Import Value & Volume, 2023-2030 ($)
Figure 50: Colombia Butyl Glycol Market Value & Volume, 2023-2030 ($)
Figure 51: Colombia GDP and Population, 2023-2030 ($)
Figure 52: Colombia GDP – Composition of 2023, By Sector of Origin
Figure 53: Colombia Export and Import Value & Volume, 2023-2030 ($)
Figure 54: Costa Rica Butyl Glycol Market Value & Volume, 2023-2030 ($)
Figure 55: Costa Rica GDP and Population, 2023-2030 ($)
Figure 56: Costa Rica GDP – Composition of 2023, By Sector of Origin
Figure 57: Costa Rica Export and Import Value & Volume, 2023-2030 ($)
Figure 58: Europe Butyl Glycol Market Value & Volume, 2023-2030 ($)
Figure 59: U.K Butyl Glycol Market Value & Volume, 2023-2030 ($)
Figure 60: U.K GDP and Population, 2023-2030 ($)
Figure 61: U.K GDP – Composition of 2023, By Sector of Origin
Figure 62: U.K Export and Import Value & Volume, 2023-2030 ($)
Figure 63: Germany Butyl Glycol Market Value & Volume, 2023-2030 ($)
Figure 64: Germany GDP and Population, 2023-2030 ($)
Figure 65: Germany GDP – Composition of 2023, By Sector of Origin
Figure 66: Germany Export and Import Value & Volume, 2023-2030 ($)
Figure 67: Italy Butyl Glycol Market Value & Volume, 2023-2030 ($)
Figure 68: Italy GDP and Population, 2023-2030 ($)
Figure 69: Italy GDP – Composition of 2023, By Sector of Origin
Figure 70: Italy Export and Import Value & Volume, 2023-2030 ($)
Figure 71: France Butyl Glycol Market Value & Volume, 2023-2030 ($)
Figure 72: France GDP and Population, 2023-2030 ($)
Figure 73: France GDP – Composition of 2023, By Sector of Origin
Figure 74: France Export and Import Value & Volume, 2023-2030 ($)
Figure 75: Netherlands Butyl Glycol Market Value & Volume, 2023-2030 ($)
Figure 76: Netherlands GDP and Population, 2023-2030 ($)
Figure 77: Netherlands GDP – Composition of 2023, By Sector of Origin
Figure 78: Netherlands Export and Import Value & Volume, 2023-2030 ($)
Figure 79: Belgium Butyl Glycol Market Value & Volume, 2023-2030 ($)
Figure 80: Belgium GDP and Population, 2023-2030 ($)
Figure 81: Belgium GDP – Composition of 2023, By Sector of Origin
Figure 82: Belgium Export and Import Value & Volume, 2023-2030 ($)
Figure 83: Spain Butyl Glycol Market Value & Volume, 2023-2030 ($)
Figure 84: Spain GDP and Population, 2023-2030 ($)
Figure 85: Spain GDP – Composition of 2023, By Sector of Origin
Figure 86: Spain Export and Import Value & Volume, 2023-2030 ($)
Figure 87: Denmark Butyl Glycol Market Value & Volume, 2023-2030 ($)
Figure 88: Denmark GDP and Population, 2023-2030 ($)
Figure 89: Denmark GDP – Composition of 2023, By Sector of Origin
Figure 90: Denmark Export and Import Value & Volume, 2023-2030 ($)
Figure 91: APAC Butyl Glycol Market Value & Volume, 2023-2030 ($)
Figure 92: China Butyl Glycol Market Value & Volume, 2023-2030
Figure 93: China GDP and Population, 2023-2030 ($)
Figure 94: China GDP – Composition of 2023, By Sector of Origin
Figure 95: China Export and Import Value & Volume, 2023-2030 ($)Butyl Glycol Market China Export and Import Value & Volume, 2023-2030 ($)
Figure 96: Australia Butyl Glycol Market Value & Volume, 2023-2030 ($)
Figure 97: Australia GDP and Population, 2023-2030 ($)
Figure 98: Australia GDP – Composition of 2023, By Sector of Origin
Figure 99: Australia Export and Import Value & Volume, 2023-2030 ($)
Figure 100: South Korea Butyl Glycol Market Value & Volume, 2023-2030 ($)
Figure 101: South Korea GDP and Population, 2023-2030 ($)
Figure 102: South Korea GDP – Composition of 2023, By Sector of Origin
Figure 103: South Korea Export and Import Value & Volume, 2023-2030 ($)
Figure 104: India Butyl Glycol Market Value & Volume, 2023-2030 ($)
Figure 105: India GDP and Population, 2023-2030 ($)
Figure 106: India GDP – Composition of 2023, By Sector of Origin
Figure 107: India Export and Import Value & Volume, 2023-2030 ($)
Figure 108: Taiwan Butyl Glycol Market Value & Volume, 2023-2030 ($)
Figure 109: Taiwan GDP and Population, 2023-2030 ($)
Figure 110: Taiwan GDP – Composition of 2023, By Sector of Origin
Figure 111: Taiwan Export and Import Value & Volume, 2023-2030 ($)
Figure 112: Malaysia Butyl Glycol Market Value & Volume, 2023-2030 ($)
Figure 113: Malaysia GDP and Population, 2023-2030 ($)
Figure 114: Malaysia GDP – Composition of 2023, By Sector of Origin
Figure 115: Malaysia Export and Import Value & Volume, 2023-2030 ($)
Figure 116: Hong Kong Butyl Glycol Market Value & Volume, 2023-2030 ($)
Figure 117: Hong Kong GDP and Population, 2023-2030 ($)
Figure 118: Hong Kong GDP – Composition of 2023, By Sector of Origin
Figure 119: Hong Kong Export and Import Value & Volume, 2023-2030 ($)
Figure 120: Middle East & Africa Butyl Glycol Market Middle East & Africa 3D Printing Market Value & Volume, 2023-2030 ($)
Figure 121: Russia Butyl Glycol Market Value & Volume, 2023-2030 ($)
Figure 122: Russia GDP and Population, 2023-2030 ($)
Figure 123: Russia GDP – Composition of 2023, By Sector of Origin
Figure 124: Russia Export and Import Value & Volume, 2023-2030 ($)
Figure 125: Israel Butyl Glycol Market Value & Volume, 2023-2030 ($)
Figure 126: Israel GDP and Population, 2023-2030 ($)
Figure 127: Israel GDP – Composition of 2023, By Sector of Origin
Figure 128: Israel Export and Import Value & Volume, 2023-2030 ($)
Figure 129: Entropy Share, By Strategies, 2023-2030* (%)Butyl Glycol Market
Figure 130: Developments, 2023-2030*Butyl Glycol Market
Figure 131: Company 1 Butyl Glycol Market Net Revenue, By Years, 2023-2030* ($)
Figure 132: Company 1 Butyl Glycol Market Net Revenue Share, By Business segments, 2023 (%)
Figure 133: Company 1 Butyl Glycol Market Net Sales Share, By Geography, 2023 (%)
Figure 134: Company 2 Butyl Glycol Market Net Revenue, By Years, 2023-2030* ($)
Figure 135: Company 2 Butyl Glycol Market Net Revenue Share, By Business segments, 2023 (%)
Figure 136: Company 2 Butyl Glycol Market Net Sales Share, By Geography, 2023 (%)
Figure 137: Company 3Butyl Glycol Market Net Revenue, By Years, 2023-2030* ($)
Figure 138: Company 3Butyl Glycol Market Net Revenue Share, By Business segments, 2023 (%)
Figure 139: Company 3Butyl Glycol Market Net Sales Share, By Geography, 2023 (%)
Figure 140: Company 4 Butyl Glycol Market Net Revenue, By Years, 2023-2030* ($)
Figure 141: Company 4 Butyl Glycol Market Net Revenue Share, By Business segments, 2023 (%)
Figure 142: Company 4 Butyl Glycol Market Net Sales Share, By Geography, 2023 (%)
Figure 143: Company 5 Butyl Glycol Market Net Revenue, By Years, 2023-2030* ($)
Figure 144: Company 5 Butyl Glycol Market Net Revenue Share, By Business segments, 2023 (%)
Figure 145: Company 5 Butyl Glycol Market Net Sales Share, By Geography, 2023 (%)
Figure 146: Company 6 Butyl Glycol Market Net Revenue, By Years, 2023-2030* ($)
Figure 147: Company 6 Butyl Glycol Market Net Revenue Share, By Business segments, 2023 (%)
Figure 148: Company 6 Butyl Glycol Market Net Sales Share, By Geography, 2023 (%)
Figure 149: Company 7 Butyl Glycol Market Net Revenue, By Years, 2023-2030* ($)
Figure 150: Company 7 Butyl Glycol Market Net Revenue Share, By Business segments, 2023 (%)
Figure 151: Company 7 Butyl Glycol Market Net Sales Share, By Geography, 2023 (%)
Figure 152: Company 8 Butyl Glycol Market Net Revenue, By Years, 2023-2030* ($)
Figure 153: Company 8 Butyl Glycol Market Net Revenue Share, By Business segments, 2023 (%)
Figure 154: Company 8 Butyl Glycol Market Net Sales Share, By Geography, 2023 (%)
Figure 155: Company 9 Butyl Glycol Market Net Revenue, By Years, 2023-2030* ($)
Figure 156: Company 9 Butyl Glycol Market Net Revenue Share, By Business segments, 2023 (%)
Figure 157: Company 9 Butyl Glycol Market Net Sales Share, By Geography, 2023 (%)
Figure 158: Company 10 Butyl Glycol Market Net Revenue, By Years, 2023-2030* ($)
Figure 159: Company 10 Butyl Glycol Market Net Revenue Share, By Business segments, 2023 (%)
Figure 160: Company 10 Butyl Glycol Market Net Sales Share, By Geography, 2023 (%)
Figure 161: Company 11 Butyl Glycol Market Net Revenue, By Years, 2023-2030* ($)
Figure 162: Company 11 Butyl Glycol Market Net Revenue Share, By Business segments, 2023 (%)
Figure 163: Company 11 Butyl Glycol Market Net Sales Share, By Geography, 2023 (%)
Figure 164: Company 12 Butyl Glycol Market Net Revenue, By Years, 2023-2030* ($)
Figure 165: Company 12 Butyl Glycol Market Net Revenue Share, By Business segments, 2023 (%)
Figure 166: Company 12 Butyl Glycol Market Net Sales Share, By Geography, 2023 (%)
Figure 167: Company 13Butyl Glycol Market Net Revenue, By Years, 2023-2030* ($)
Figure 168: Company 13Butyl Glycol Market Net Revenue Share, By Business segments, 2023 (%)
Figure 169: Company 13Butyl Glycol Market Net Sales Share, By Geography, 2023 (%)
Figure 170: Company 14 Butyl Glycol Market Net Revenue, By Years, 2023-2030* ($)
Figure 171: Company 14 Butyl Glycol Market Net Revenue Share, By Business segments, 2023 (%)
Figure 172: Company 14 Butyl Glycol Market Net Sales Share, By Geography, 2023 (%)
Figure 173: Company 15 Butyl Glycol Market Net Revenue, By Years, 2023-2030* ($)
Figure 174: Company 15 Butyl Glycol Market Net Revenue Share, By Business segments, 2023 (%)
Figure 175: Company 15 Butyl Glycol Market Net Sales Share, By Geography, 2023 (%)