 Email
Email Print
Print


Electronic Security System Market - Forecast(2024 - 2030)
The electronic security system market is driven by the rising incidents of security concerns. Also improvement in network infrastructure, broadband and internet penetration along with consumer’s acceptation for wireless and technologically advanced products is driving the market for electronic security system.
This report identifies the global Electronic Security System Market size in for the year 2014-2016, and forecast of the same for year 2021. It also highlights the potential growth opportunities in the coming years, while also reviewing the market drivers, restraints, growth indicators, challenges, market dynamics, competitive landscape, and other key aspects with respect to Electronic Security System Market.
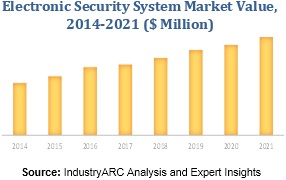
The global market for Electronic Security System Market is valued at $XX million for the 2014 and is forecast to grow at a CAGR of XX% to reach a value of $XX million by 2021. Geographically Asia Pacific dominated global Electronic Security System Market, and is projected to have fastest growth, owing to increased surveillance and is expected to grow at a highest CAGR between 2016 and 2022.
This report segments global Electronic Security System Market on the basis of System, by types, by application and regional market as follows:
This report identifies all the major companies operating in the Electronic Security System Market. Some of the major companies’ profiles in detail are as follows:
This report identifies the global Electronic Security System Market size in for the year 2014-2016, and forecast of the same for year 2021. It also highlights the potential growth opportunities in the coming years, while also reviewing the market drivers, restraints, growth indicators, challenges, market dynamics, competitive landscape, and other key aspects with respect to Electronic Security System Market.
The global market for Electronic Security System Market is valued at $XX million for the 2014 and is forecast to grow at a CAGR of XX% to reach a value of $XX million by 2021. Geographically Asia Pacific dominated global Electronic Security System Market, and is projected to have fastest growth, owing to increased surveillance and is expected to grow at a highest CAGR between 2016 and 2022.
This report segments global Electronic Security System Market on the basis of System, by types, by application and regional market as follows:
- Electronic Security System Market, by type is segmented into closed circuit television, access control and intruder alarms according to their uses for security system.
- Electronic Security System Market, by application is segmented into commercial offices, retail, public sector, infrastructure, and residential sector. This segmentation is based on the application of electronic security system in varied industry.
- This report has been further segmented into major regions, which includes detailed analysis of each region such as North America, Europe, Asia-Pacific (APAC) and Rest of the World (RoW) covering all the major country level markets in each of the region.
This report identifies all the major companies operating in the Electronic Security System Market. Some of the major companies’ profiles in detail are as follows:
- ASSA Abloy AB.
- AMAG Technology, Inc.
- Gemalto N.V.
- Gallagher Group Ltd.
- Honeywell Security Group
1. Electronic Security System – Market Overview
2. Executive Summary
3. Electronic Security System Market Landscape
3.1. Market Share Analysis
3.2. Comparative Analysis
3.3. Product Benchmarking
3.4. End User Profiling
3.5. Top 5 Financials Analysis
4. Electronic Security System Market– Market Forces
4.1. Drivers
4.1.1. Growing need for surveillance and combat capabilities to drive the demand
4.2.2. Growing need for surveillance and combat capabilities to drive demand
4.2. Restraints
4.2.1. High installation cost
4.3. Opportunities
4.4. Challenges
4.5. Porter’s Five Forces Analysis
4.5.1. Bargaining Power of Suppliers
4.5.2. Bargaining Power of Buyers
4.5.3. Threat of New Entrants
4.5.4. Threat of Substitutes
4.5.5. Degree of Competition
5. Electronic Security System Market, By types
5.1. Introduction
5.2. Closed Circuit Television
5.3. Access Control
5.4. Intruder Alarms
6. Electronic Security System Market, Application
6.1. Introduction
6.2. Commercial Offices
6.3. Retail
6.4. Public Sector
6.5. Infrastructure
6.6. Residential
7. Global Electronic Security System Market, By Geography
7.1. Europe
7.1.1. Germany
7.1.2. France
7.1.3. Italy
7.1.4. Spain
7.1.5. Russia
7.1.6. U.K.
7.1.7. Rest of Europe
7.2. Asia Pacific
7.2.1. China
7.2.2. India
7.2.3. Japan
7.2.4. South Korea
7.2.5. Rest of Asia-Pacific
7.3. North America
7.3.1. U.S.
7.3.2. Canada
7.3.3. Mexico
7.4. Rest of the World (RoW)
7.4.1. Brazil
7.4.2. Rest of RoW
8. Electronic Security System – Market Entropy
8.1. Expansion
8.2. Technological Developments
8.3. Merger & Acquisitions, and Joint Ventures
8.4. Supply- Contract
9. Company Profiles
"*Financials would be provided on a best efforts basis for private companies"
10. Appendix
10.1. Abbreviations
10.2. Sources
10.3. Research Methodology
10.4. Expert Insights
2. Executive Summary
3. Electronic Security System Market Landscape
3.1. Market Share Analysis
3.2. Comparative Analysis
3.3. Product Benchmarking
3.4. End User Profiling
3.5. Top 5 Financials Analysis
4. Electronic Security System Market– Market Forces
4.1. Drivers
4.1.1. Growing need for surveillance and combat capabilities to drive the demand
4.2.2. Growing need for surveillance and combat capabilities to drive demand
4.2. Restraints
4.2.1. High installation cost
4.3. Opportunities
4.4. Challenges
4.5. Porter’s Five Forces Analysis
4.5.1. Bargaining Power of Suppliers
4.5.2. Bargaining Power of Buyers
4.5.3. Threat of New Entrants
4.5.4. Threat of Substitutes
4.5.5. Degree of Competition
5. Electronic Security System Market, By types
5.1. Introduction
5.2. Closed Circuit Television
5.3. Access Control
5.4. Intruder Alarms
6. Electronic Security System Market, Application
6.1. Introduction
6.2. Commercial Offices
6.3. Retail
6.4. Public Sector
6.5. Infrastructure
6.6. Residential
7. Global Electronic Security System Market, By Geography
7.1. Europe
7.1.1. Germany
7.1.2. France
7.1.3. Italy
7.1.4. Spain
7.1.5. Russia
7.1.6. U.K.
7.1.7. Rest of Europe
7.2. Asia Pacific
7.2.1. China
7.2.2. India
7.2.3. Japan
7.2.4. South Korea
7.2.5. Rest of Asia-Pacific
7.3. North America
7.3.1. U.S.
7.3.2. Canada
7.3.3. Mexico
7.4. Rest of the World (RoW)
7.4.1. Brazil
7.4.2. Rest of RoW
8. Electronic Security System – Market Entropy
8.1. Expansion
8.2. Technological Developments
8.3. Merger & Acquisitions, and Joint Ventures
8.4. Supply- Contract
9. Company Profiles
9.1. Company 1
9.2. Company 2
9.3. Company 3
9.4. Company 4
9.5. Company 5
9.6. Company 6
9.7. Company 7
9.8. Company 8
9.9. Company 9
9.10. Company 10
*More than 40 Companies are profiled in this Research Report, Complete List available on Request*"*Financials would be provided on a best efforts basis for private companies"
10. Appendix
10.1. Abbreviations
10.2. Sources
10.3. Research Methodology
10.4. Expert Insights
List of Tables
Table 1: Electronic Security System Market Overview 2023-2030
Table 2: Electronic Security System Market Leader Analysis 2023-2030 (US$)
Table 3: Electronic Security System Market Product Analysis 2023-2030 (US$)
Table 4: Electronic Security System Market End User Analysis 2023-2030 (US$)
Table 5: Electronic Security System Market Patent Analysis 2013-2023* (US$)
Table 6: Electronic Security System Market Financial Analysis 2023-2030 (US$)
Table 7: Electronic Security System Market Driver Analysis 2023-2030 (US$)
Table 8: Electronic Security System Market Challenges Analysis 2023-2030 (US$)
Table 9: Electronic Security System Market Constraint Analysis 2023-2030 (US$)
Table 10: Electronic Security System Market Supplier Bargaining Power Analysis 2023-2030 (US$)
Table 11: Electronic Security System Market Buyer Bargaining Power Analysis 2023-2030 (US$)
Table 12: Electronic Security System Market Threat of Substitutes Analysis 2023-2030 (US$)
Table 13: Electronic Security System Market Threat of New Entrants Analysis 2023-2030 (US$)
Table 14: Electronic Security System Market Degree of Competition Analysis 2023-2030 (US$)
Table 15: Electronic Security System Market Value Chain Analysis 2023-2030 (US$)
Table 16: Electronic Security System Market Pricing Analysis 2023-2030 (US$)
Table 17: Electronic Security System Market Opportunities Analysis 2023-2030 (US$)
Table 18: Electronic Security System Market Product Life Cycle Analysis 2023-2030 (US$)
Table 19: Electronic Security System Market Supplier Analysis 2023-2030 (US$)
Table 20: Electronic Security System Market Distributor Analysis 2023-2030 (US$)
Table 21: Electronic Security System Market Trend Analysis 2023-2030 (US$)
Table 22: Electronic Security System Market Size 2023 (US$)
Table 23: Electronic Security System Market Forecast Analysis 2023-2030 (US$)
Table 24: Electronic Security System Market Sales Forecast Analysis 2023-2030 (Units)
Table 25: Electronic Security System Market, Revenue & Volume,By types, 2023-2030 ($)
Table 26: Electronic Security System Market By types, Revenue & Volume,By Closed Circuit Television, 2023-2030 ($)
Table 27: Electronic Security System Market By types, Revenue & Volume,By Access Control, 2023-2030 ($)
Table 28: Electronic Security System Market By types, Revenue & Volume,By Intruder Alarms, 2023-2030 ($)
Table 29: Electronic Security System Market, Revenue & Volume,By Application, 2023-2030 ($)
Table 30: Electronic Security System Market By Application, Revenue & Volume,By Commercial Offices, 2023-2030 ($)
Table 31: Electronic Security System Market By Application, Revenue & Volume,By Retail, 2023-2030 ($)
Table 32: Electronic Security System Market By Application, Revenue & Volume,By Public Sector, 2023-2030 ($)
Table 33: Electronic Security System Market By Application, Revenue & Volume,By Infrastructure, 2023-2030 ($)
Table 34: Electronic Security System Market By Application, Revenue & Volume,By Residential, 2023-2030 ($)
Table 35: North America Electronic Security System Market, Revenue & Volume,By types, 2023-2030 ($)
Table 36: North America Electronic Security System Market, Revenue & Volume,By Application, 2023-2030 ($)
Table 37: South america Electronic Security System Market, Revenue & Volume,By types, 2023-2030 ($)
Table 38: South america Electronic Security System Market, Revenue & Volume,By Application, 2023-2030 ($)
Table 39: Europe Electronic Security System Market, Revenue & Volume,By types, 2023-2030 ($)
Table 40: Europe Electronic Security System Market, Revenue & Volume,By Application, 2023-2030 ($)
Table 41: APAC Electronic Security System Market, Revenue & Volume,By types, 2023-2030 ($)
Table 42: APAC Electronic Security System Market, Revenue & Volume,By Application, 2023-2030 ($)
Table 43: Middle East & Africa Electronic Security System Market, Revenue & Volume,By types, 2023-2030 ($)
Table 44: Middle East & Africa Electronic Security System Market, Revenue & Volume,By Application, 2023-2030 ($)
Table 45: Russia Electronic Security System Market, Revenue & Volume,By types, 2023-2030 ($)
Table 46: Russia Electronic Security System Market, Revenue & Volume,By Application, 2023-2030 ($)
Table 47: Israel Electronic Security System Market, Revenue & Volume,By types, 2023-2030 ($)
Table 48: Israel Electronic Security System Market, Revenue & Volume,By Application, 2023-2030 ($)
Table 49: Top Companies 2023 (US$)Electronic Security System Market, Revenue & Volume
Table 50: Product Launch 2023-2030Electronic Security System Market, Revenue & Volume
Table 51: Mergers & Acquistions 2023-2030Electronic Security System Market, Revenue & Volume
List of Figures
Figure 1: Overview of Electronic Security System Market 2023-2030
Figure 2: Market Share Analysis for Electronic Security System Market 2023 (US$)
Figure 3: Product Comparison in Electronic Security System Market 2023-2030 (US$)
Figure 4: End User Profile for Electronic Security System Market 2023-2030 (US$)
Figure 5: Patent Application and Grant in Electronic Security System Market 2013-2023* (US$)
Figure 6: Top 5 Companies Financial Analysis in Electronic Security System Market 2023-2030 (US$)
Figure 7: Market Entry Strategy in Electronic Security System Market 2023-2030
Figure 8: Ecosystem Analysis in Electronic Security System Market 2023
Figure 9: Average Selling Price in Electronic Security System Market 2023-2030
Figure 10: Top Opportunites in Electronic Security System Market 2023-2030
Figure 11: Market Life Cycle Analysis in Electronic Security System Market
Figure 12: GlobalBy types Electronic Security System Market Revenue, 2023-2030 ($)
Figure 13: GlobalBy ApplicationElectronic Security System Market Revenue, 2023-2030 ($)
Figure 14: Global Electronic Security System Market - By Geography
Figure 15: Global Electronic Security System Market Value & Volume, By Geography, 2023-2030 ($)
Figure 16: Global Electronic Security System Market CAGR, By Geography, 2023-2030 (%)
Figure 17: North America Electronic Security System Market Value & Volume, 2023-2030 ($)
Figure 18: US Electronic Security System Market Value & Volume, 2023-2030 ($)
Figure 19: US GDP and Population, 2023-2030 ($)
Figure 20: US GDP – Composition of 2023, By Sector of Origin
Figure 21: US Export and Import Value & Volume, 2023-2030 ($)
Figure 22: Canada Electronic Security System Market Value & Volume, 2023-2030 ($)
Figure 23: Canada GDP and Population, 2023-2030 ($)
Figure 24: Canada GDP – Composition of 2023, By Sector of Origin
Figure 25: Canada Export and Import Value & Volume, 2023-2030 ($)
Figure 26: Mexico Electronic Security System Market Value & Volume, 2023-2030 ($)
Figure 27: Mexico GDP and Population, 2023-2030 ($)
Figure 28: Mexico GDP – Composition of 2023, By Sector of Origin
Figure 29: Mexico Export and Import Value & Volume, 2023-2030 ($)
Figure 30: South America Electronic Security System Market Value & Volume, 2023-2030 ($)
Figure 31: Brazil Electronic Security System Market Value & Volume, 2023-2030 ($)
Figure 32: Brazil GDP and Population, 2023-2030 ($)
Figure 33: Brazil GDP – Composition of 2023, By Sector of Origin
Figure 34: Brazil Export and Import Value & Volume, 2023-2030 ($)
Figure 35: Venezuela Electronic Security System Market Value & Volume, 2023-2030 ($)
Figure 36: Venezuela GDP and Population, 2023-2030 ($)
Figure 37: Venezuela GDP – Composition of 2023, By Sector of Origin
Figure 38: Venezuela Export and Import Value & Volume, 2023-2030 ($)
Figure 39: Argentina Electronic Security System Market Value & Volume, 2023-2030 ($)
Figure 40: Argentina GDP and Population, 2023-2030 ($)
Figure 41: Argentina GDP – Composition of 2023, By Sector of Origin
Figure 42: Argentina Export and Import Value & Volume, 2023-2030 ($)
Figure 43: Ecuador Electronic Security System Market Value & Volume, 2023-2030 ($)
Figure 44: Ecuador GDP and Population, 2023-2030 ($)
Figure 45: Ecuador GDP – Composition of 2023, By Sector of Origin
Figure 46: Ecuador Export and Import Value & Volume, 2023-2030 ($)
Figure 47: Peru Electronic Security System Market Value & Volume, 2023-2030 ($)
Figure 48: Peru GDP and Population, 2023-2030 ($)
Figure 49: Peru GDP – Composition of 2023, By Sector of Origin
Figure 50: Peru Export and Import Value & Volume, 2023-2030 ($)
Figure 51: Colombia Electronic Security System Market Value & Volume, 2023-2030 ($)
Figure 52: Colombia GDP and Population, 2023-2030 ($)
Figure 53: Colombia GDP – Composition of 2023, By Sector of Origin
Figure 54: Colombia Export and Import Value & Volume, 2023-2030 ($)
Figure 55: Costa Rica Electronic Security System Market Value & Volume, 2023-2030 ($)
Figure 56: Costa Rica GDP and Population, 2023-2030 ($)
Figure 57: Costa Rica GDP – Composition of 2023, By Sector of Origin
Figure 58: Costa Rica Export and Import Value & Volume, 2023-2030 ($)
Figure 59: Europe Electronic Security System Market Value & Volume, 2023-2030 ($)
Figure 60: U.K Electronic Security System Market Value & Volume, 2023-2030 ($)
Figure 61: U.K GDP and Population, 2023-2030 ($)
Figure 62: U.K GDP – Composition of 2023, By Sector of Origin
Figure 63: U.K Export and Import Value & Volume, 2023-2030 ($)
Figure 64: Germany Electronic Security System Market Value & Volume, 2023-2030 ($)
Figure 65: Germany GDP and Population, 2023-2030 ($)
Figure 66: Germany GDP – Composition of 2023, By Sector of Origin
Figure 67: Germany Export and Import Value & Volume, 2023-2030 ($)
Figure 68: Italy Electronic Security System Market Value & Volume, 2023-2030 ($)
Figure 69: Italy GDP and Population, 2023-2030 ($)
Figure 70: Italy GDP – Composition of 2023, By Sector of Origin
Figure 71: Italy Export and Import Value & Volume, 2023-2030 ($)
Figure 72: France Electronic Security System Market Value & Volume, 2023-2030 ($)
Figure 73: France GDP and Population, 2023-2030 ($)
Figure 74: France GDP – Composition of 2023, By Sector of Origin
Figure 75: France Export and Import Value & Volume, 2023-2030 ($)
Figure 76: Netherlands Electronic Security System Market Value & Volume, 2023-2030 ($)
Figure 77: Netherlands GDP and Population, 2023-2030 ($)
Figure 78: Netherlands GDP – Composition of 2023, By Sector of Origin
Figure 79: Netherlands Export and Import Value & Volume, 2023-2030 ($)
Figure 80: Belgium Electronic Security System Market Value & Volume, 2023-2030 ($)
Figure 81: Belgium GDP and Population, 2023-2030 ($)
Figure 82: Belgium GDP – Composition of 2023, By Sector of Origin
Figure 83: Belgium Export and Import Value & Volume, 2023-2030 ($)
Figure 84: Spain Electronic Security System Market Value & Volume, 2023-2030 ($)
Figure 85: Spain GDP and Population, 2023-2030 ($)
Figure 86: Spain GDP – Composition of 2023, By Sector of Origin
Figure 87: Spain Export and Import Value & Volume, 2023-2030 ($)
Figure 88: Denmark Electronic Security System Market Value & Volume, 2023-2030 ($)
Figure 89: Denmark GDP and Population, 2023-2030 ($)
Figure 90: Denmark GDP – Composition of 2023, By Sector of Origin
Figure 91: Denmark Export and Import Value & Volume, 2023-2030 ($)
Figure 92: APAC Electronic Security System Market Value & Volume, 2023-2030 ($)
Figure 93: China Electronic Security System Market Value & Volume, 2023-2030
Figure 94: China GDP and Population, 2023-2030 ($)
Figure 95: China GDP – Composition of 2023, By Sector of Origin
Figure 96: China Export and Import Value & Volume, 2023-2030 ($)Electronic Security System Market China Export and Import Value & Volume, 2023-2030 ($)
Figure 97: Australia Electronic Security System Market Value & Volume, 2023-2030 ($)
Figure 98: Australia GDP and Population, 2023-2030 ($)
Figure 99: Australia GDP – Composition of 2023, By Sector of Origin
Figure 100: Australia Export and Import Value & Volume, 2023-2030 ($)
Figure 101: South Korea Electronic Security System Market Value & Volume, 2023-2030 ($)
Figure 102: South Korea GDP and Population, 2023-2030 ($)
Figure 103: South Korea GDP – Composition of 2023, By Sector of Origin
Figure 104: South Korea Export and Import Value & Volume, 2023-2030 ($)
Figure 105: India Electronic Security System Market Value & Volume, 2023-2030 ($)
Figure 106: India GDP and Population, 2023-2030 ($)
Figure 107: India GDP – Composition of 2023, By Sector of Origin
Figure 108: India Export and Import Value & Volume, 2023-2030 ($)
Figure 109: Taiwan Electronic Security System Market Value & Volume, 2023-2030 ($)
Figure 110: Taiwan GDP and Population, 2023-2030 ($)
Figure 111: Taiwan GDP – Composition of 2023, By Sector of Origin
Figure 112: Taiwan Export and Import Value & Volume, 2023-2030 ($)
Figure 113: Malaysia Electronic Security System Market Value & Volume, 2023-2030 ($)
Figure 114: Malaysia GDP and Population, 2023-2030 ($)
Figure 115: Malaysia GDP – Composition of 2023, By Sector of Origin
Figure 116: Malaysia Export and Import Value & Volume, 2023-2030 ($)
Figure 117: Hong Kong Electronic Security System Market Value & Volume, 2023-2030 ($)
Figure 118: Hong Kong GDP and Population, 2023-2030 ($)
Figure 119: Hong Kong GDP – Composition of 2023, By Sector of Origin
Figure 120: Hong Kong Export and Import Value & Volume, 2023-2030 ($)
Figure 121: Middle East & Africa Electronic Security System Market Middle East & Africa 3D Printing Market Value & Volume, 2023-2030 ($)
Figure 122: Russia Electronic Security System Market Value & Volume, 2023-2030 ($)
Figure 123: Russia GDP and Population, 2023-2030 ($)
Figure 124: Russia GDP – Composition of 2023, By Sector of Origin
Figure 125: Russia Export and Import Value & Volume, 2023-2030 ($)
Figure 126: Israel Electronic Security System Market Value & Volume, 2023-2030 ($)
Figure 127: Israel GDP and Population, 2023-2030 ($)
Figure 128: Israel GDP – Composition of 2023, By Sector of Origin
Figure 129: Israel Export and Import Value & Volume, 2023-2030 ($)
Figure 130: Entropy Share, By Strategies, 2023-2030* (%)Electronic Security System Market
Figure 131: Developments, 2023-2030*Electronic Security System Market
Figure 132: Company 1 Electronic Security System Market Net Revenue, By Years, 2023-2030* ($)
Figure 133: Company 1 Electronic Security System Market Net Revenue Share, By Business segments, 2023 (%)
Figure 134: Company 1 Electronic Security System Market Net Sales Share, By Geography, 2023 (%)
Figure 135: Company 2 Electronic Security System Market Net Revenue, By Years, 2023-2030* ($)
Figure 136: Company 2 Electronic Security System Market Net Revenue Share, By Business segments, 2023 (%)
Figure 137: Company 2 Electronic Security System Market Net Sales Share, By Geography, 2023 (%)
Figure 138: Company 3Electronic Security System Market Net Revenue, By Years, 2023-2030* ($)
Figure 139: Company 3Electronic Security System Market Net Revenue Share, By Business segments, 2023 (%)
Figure 140: Company 3Electronic Security System Market Net Sales Share, By Geography, 2023 (%)
Figure 141: Company 4 Electronic Security System Market Net Revenue, By Years, 2023-2030* ($)
Figure 142: Company 4 Electronic Security System Market Net Revenue Share, By Business segments, 2023 (%)
Figure 143: Company 4 Electronic Security System Market Net Sales Share, By Geography, 2023 (%)
Figure 144: Company 5 Electronic Security System Market Net Revenue, By Years, 2023-2030* ($)
Figure 145: Company 5 Electronic Security System Market Net Revenue Share, By Business segments, 2023 (%)
Figure 146: Company 5 Electronic Security System Market Net Sales Share, By Geography, 2023 (%)
Figure 147: Company 6 Electronic Security System Market Net Revenue, By Years, 2023-2030* ($)
Figure 148: Company 6 Electronic Security System Market Net Revenue Share, By Business segments, 2023 (%)
Figure 149: Company 6 Electronic Security System Market Net Sales Share, By Geography, 2023 (%)
Figure 150: Company 7 Electronic Security System Market Net Revenue, By Years, 2023-2030* ($)
Figure 151: Company 7 Electronic Security System Market Net Revenue Share, By Business segments, 2023 (%)
Figure 152: Company 7 Electronic Security System Market Net Sales Share, By Geography, 2023 (%)
Figure 153: Company 8 Electronic Security System Market Net Revenue, By Years, 2023-2030* ($)
Figure 154: Company 8 Electronic Security System Market Net Revenue Share, By Business segments, 2023 (%)
Figure 155: Company 8 Electronic Security System Market Net Sales Share, By Geography, 2023 (%)
Figure 156: Company 9 Electronic Security System Market Net Revenue, By Years, 2023-2030* ($)
Figure 157: Company 9 Electronic Security System Market Net Revenue Share, By Business segments, 2023 (%)
Figure 158: Company 9 Electronic Security System Market Net Sales Share, By Geography, 2023 (%)
Figure 159: Company 10 Electronic Security System Market Net Revenue, By Years, 2023-2030* ($)
Figure 160: Company 10 Electronic Security System Market Net Revenue Share, By Business segments, 2023 (%)
Figure 161: Company 10 Electronic Security System Market Net Sales Share, By Geography, 2023 (%)
Figure 162: Company 11 Electronic Security System Market Net Revenue, By Years, 2023-2030* ($)
Figure 163: Company 11 Electronic Security System Market Net Revenue Share, By Business segments, 2023 (%)
Figure 164: Company 11 Electronic Security System Market Net Sales Share, By Geography, 2023 (%)
Figure 165: Company 12 Electronic Security System Market Net Revenue, By Years, 2023-2030* ($)
Figure 166: Company 12 Electronic Security System Market Net Revenue Share, By Business segments, 2023 (%)
Figure 167: Company 12 Electronic Security System Market Net Sales Share, By Geography, 2023 (%)
Figure 168: Company 13Electronic Security System Market Net Revenue, By Years, 2023-2030* ($)
Figure 169: Company 13Electronic Security System Market Net Revenue Share, By Business segments, 2023 (%)
Figure 170: Company 13Electronic Security System Market Net Sales Share, By Geography, 2023 (%)
Figure 171: Company 14 Electronic Security System Market Net Revenue, By Years, 2023-2030* ($)
Figure 172: Company 14 Electronic Security System Market Net Revenue Share, By Business segments, 2023 (%)
Figure 173: Company 14 Electronic Security System Market Net Sales Share, By Geography, 2023 (%)
Figure 174: Company 15 Electronic Security System Market Net Revenue, By Years, 2023-2030* ($)
Figure 175: Company 15 Electronic Security System Market Net Revenue Share, By Business segments, 2023 (%)
Figure 176: Company 15 Electronic Security System Market Net Sales Share, By Geography, 2023 (%)