 Email
Email Print
Print


Infrared Imaging Market And Wide Area Surveillance Infrared Imaging - Forecast(2024 - 2030)
The global infrared imaging market is estimated to cross $9.772.49m by 2024 growing at CAGR 7.88% during the forecast period 2018-2024. The primary key factors driving the infrared imaging market includes growing demand from industrial and automation industry, requirement of high contrast images, cross industry collaboration and others. Additionally, Conventional infrared imaging covers the approximately 80% of the market share for the overall infrared imaging market
What is Infrared Imaging?
Infrared Imaging are opted for producing images that are invisible through naked eye. The device operate at an electromagnetic spectrum of 9,000-14,000 nanometers. Infrared imaging cater its application in diverse end-user industry such as transportation, manufacturing, information technology among others.
Currently, private and security segment is the dominating segment for global infrared imaging market and is anticipated to be dominant in the forecast period. This is followed by industrial, healthcare, defense and law enforcement.
This report incorporates an in-depth assessment of infrared imaging market by technology, geography and others. With respect to geography, North America is the leading region for infrared imaging market accounting for 34% share in 2017.Asia-Pacific region is expected to have significant growth in forecast period. South Korea, China, India are the key region in the Asia-Pacific region. According to the Indian Bureau of Mines, the iron ore production has reached 160 million metric tons in 2017 which was 150 million metric tons in 2013, thus driving the demand of infrared imaging products in the iron ore production.
What are the major applications for Wide Area Surveillance Infrared Imaging?
Wide Area Surveillance System refers to an intelligence-based automated solution which offers wide-area surveillance capability to predict, detect, track, identify, classify, respond and resolve incursions. This solution enhanced situational awareness for force protection, critical asset and infrastructure, and special event security.
Wide area surveillance infrared imaging are primarily used in different application for civil intrusion, suspect tracking, hazard and disaster management, route reconnaissance and over watch, large event monitoring, Terminal Security, Perimeter security and many more. Wide area surveillance infrared imaging market is estimated to grow at a CAGR of 7.5% in between 2018 to 2024. Increasing number of criminal activities and threats to public are creating need for the security systems thus propelling the growth of wide area surveillance infrared imaging market. Reconnaissance is the leading segment for WAS infrared imaging market. Hazard and disaster management is the fastest growing segment for the WAS infrared imaging market.
Market Research and Market Trends of Infrared Imaging Ecosystem
- The necessity of quality inspection in industries to drive the machine vision market. This technology enables inspection of components at high speeds and simultaneously enhances the production efficiency. Additionally, Technological innovations such as high resolution cameras, advanced interface with bandwidth among others to propel the growth of machine vision market providing opportunity for infrared imaging market
- Life science companies are focusing on molecular and small imaging application resulting in cross industry partnership. Also, consumer electronics companies are entering into the market, increasing rivalry among the players
- Aerospace industry are deploying infrared imaging owing to structure monitoring, safety, pilot assistance among others. It is beneficial for investigating high speed flying objects, failure behaviors of materials and many more
- The growing demand for reducing risk in the manufacturing process will propel the growth of infrared imaging market. Ongoing advancement in infrared imaging devices such as the ability to detect anomalies precisely are offering new opportunities across diverse domains. The devices are equipped with latest technologies comprising of direct connectivity with mobile devices, instant recording among others
Who are the Major Players in Infrared Imaging Market?
The companies referred to in the market research report includes FLIR systems Inc., DRS Technologies, Fluke Corporation, Axis Communication and others. Infrared Imaging market has numerous players catering across several domains of industry.
The top companies are targeting to launch new IR imaging products with the requirement of diverse end-user application such as security, military & defense, industrial & commercial, automotive among others.
What is our report scope?
The report incorporates in-depth assessment of the competitive landscape, product market sizing, product benchmarking, market trends, product developments, financial analysis, strategic analysis and so on to gauge the impact forces and potential opportunities of the market. Apart from this the report also includes a study of major developments in the market such as product launches, agreements, acquisitions, collaborations, mergers and so on to comprehend the prevailing market dynamics at present and its impact during the forecast period 2018-2024.
All our reports are customizable to your company needs to a certain extent, we do provide 20 free consulting hours along with purchase of each report, and this will allow you to request any additional data to customize the report to your needs.
Key Takeaways from this Report
- Evaluate market potential through analyzing growth rates (CAGR %), Volume (Units) and Value ($M) data given at country level – for product types, end use applications and by different industry verticals.
- Understand the different dynamics influencing the market – key driving factors, challenges and hidden opportunities.
- Get in-depth insights on your competitor performance – market shares, strategies, financial benchmarking, product benchmarking, SWOT and more.
- Analyze the sales and distribution channels across key geographies to improve top-line revenues.
- Understand the industry supply chain with a deep-dive on the value augmentation at each step, in order to optimize value and bring efficiencies in your processes.
- Get a quick outlook on the market entropy – M&A’s, deals, partnerships, product launches of all key players for the past 4 years.
- Evaluate the supply-demand gaps, import-export statistics and regulatory landscape for more than top 20 countries globally for the market.
1. Infrared Imaging Market Overview
2. Executive Summary
3. Infrared Imaging Market Landscape
3.1. Market Share Analysis
3.2. Comparative Analysis
3.2.1. Product Benchmarking
3.2.2. End User profiling
3.2.3. Patent Analysis
3.2.4. Top 5 Financials Analysis
4. Infrared Imaging Market Forces
4.1. Market Drivers
4.1.1. Growing Demand from the industrial and automation industry
4.1.2. Cross Industry Collaboration and Support from major companies
4.1.3. Manufacturer focused towards increasing the dynamic range of the system owing to high contrast
4.2. Market Constraints
4.2.1. Lack of Awareness
4.2.2. Competition from economical imaging system
4.3. Market Challenges
4.4. Attractiveness of the Industry
4.4.1. Power of Suppliers
4.4.2. Power of Customers
4.4.3. Threat of New entrants
4.4.4. Threat of Substitution
4.4.5. Degree of Competition
5. Infrared Imaging Market – Strategic Analysis
5.1. Value Chain Analysis
5.2. Pricing Analysis
5.3. Opportunities Analysis
5.4. Product/Market Life Cycle Analysis
5.5. Suppliers and Distributors
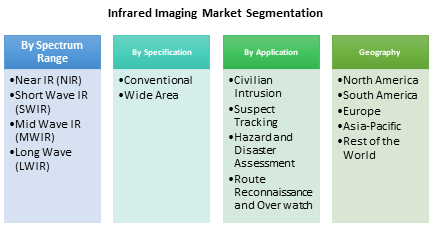
6. Infrared Imaging Market - By Spectrum Ranges
6.1. Introduction
6.2. Near IR (NIR)
6.3. Short Wave IR (SWIR)
6.4. Mid Wave IR (MWIR)
6.5. Long Wave (LWIR)
7. Infrared Imaging Market - By Specification
7.1. Conventional
7.2. Wide Area
8. Wide Area Surveillance Infrared Imaging Market – By Application
8.1. Civilian Intrusion
8.2. Suspect Tracking
8.3. Hazard and Disaster Assessment
8.4. Route Reconnaissance and Over watch
8.5. Large Event Monitoring
8.6. Terminal Security
8.7. Perimeter Security
8.8. Others
9. Wide Area Surveillance Imaging Market – By End User
9.1. Defense & Law Enforcement
9.1.1. Underground
9.1.2. On-Ground
9.2. Industrial
9.2.1. Oil and Gas
9.2.1.1. Underground
9.2.1.2. On-Ground
9.2.2. Mining
9.2.2.1. Underground
9.2.2.2. On-Ground
9.2.3. Production Plants
9.2.4. Others
9.3. Commercial
9.3.1. Transport Terminals
9.3.1.1. Underground
9.3.1.2. On-Ground
9.3.2. Government Buildings
9.3.3. Power Stations
9.3.4. Data Centers
9.3.5. Others
9.4. Others
10. Wide Area Surveillance Infrared Imaging Market - By Geography
10.1. North America
10.2. Europe
10.3. APAC
10.4. ROW
10.5. Middle East
11. Infrared Imaging Market – By End User
11.1. Defense and law Enforcement
11.2. Private security (data centers, office buildings, production sites, etc.)
11.3. Industrial and commercial
11.3.1. Energy Auditing Equipment
11.3.2. Structural Inspection Equipment
11.3.3. Moisture Detection Equipment
11.3.4. Non-Destructive Testing Equipment
11.3.5. Predictive Maintenance System
11.3.6. Process Inspection Systems
11.3.7. Machine Vision Systems
11.3.8. Others
11.4. Consumer Goods
11.5. Healthcare
11.6. Unmanned Vehicles
11.7. Automotive
11.8. Maritime
11.8.1. Ice Detection
11.8.2. Oil Spill Detection
11.8.3. Anti-Piracy
11.8.4. Onboard Safety and Security
11.8.5. Navigation
12. Infrared Imaging Market - By Technology
12.1. Cooled
12.2. Uncooled
13. Wide Area Surveillance Imaging Market top 10 suppliers’ market shares
14. Market Entropy
14.1. New Product Launches
14.2. M&As, Collaborations, JVs, Partnership
15. Company Profiles
15.1. FLIR systems Inc.
15.2. DRS Technologies
15.3. Fluke Corporation
15.4. Axis Communication
15.5. Company 5
15.6. Company 6
15.7. Company 7
15.8. Company 8
15.9. Company 9
"*Financials would be provided on a best efforts basis for private companies"
16. Appendix
16.1. Abbreviations
16.2. Sources
16.3. Research Methodology
16.4. Bibliography
16.5. Compilation of Expert Insights
LIST OF TABLES :
Table 1: Global Infrared Imaging Market, Product Benchmarking
Table 2: Infrared Imaging Market Value, By Spectrum Ranges, 2023-2024, ($Million)
Table 3: Infrared Imaging Market Value, By Specification, 2023-2024, ($Million)
Table 4: Wide Area Surveillance Infrared Imaging Market Value, By Application, 2023-2024 ($Million)
Table 5: Wide Area Surveillance Infrared Imaging Market Value, By End User, 2023-2024 ($Million)
Table 6: Industrial and Commercial: Infrared Imaging Market, 2023-2024, $ M
Table 7: Infrared Imaging: Maritime Market Revenue (2016-2023), $Million
LIST OF FIGURES:
Figure 1: Global Infrared Imaging Market Value (Revenue) (2012-2022), $Million
Figure 2: Global Infrared Imaging Market Value, By Product Type (2023-2024), $Million
Figure 3: Global Infrared Imaging Market Share, By Specification, 2023 (%)
Figure 4: Global Infrared Imaging Market Revenue Share, By Region, 2023, 2024(%)
Figure 5: Global Infrared Imaging Market Revenue Share, By Company, 2023 (%)
Figure 6: Infrared Imaging Market Share by End-User, 2023
Figure 7: Infrared Imaging Patents, By Year, 2014-2023*
Figure 8: Infrared Imaging 2014-2023*, Patents, By Companies (%)
Figure 9: FLIR Systems Inc.
Figure 10: Leonardo (DRS Technology Inc.)
Figure 11: Danaher Corporation (Fluke Corporation)
Figure 12: Axis Communication AB
Figure 13: Safran (Sofradir)
Figure 14: EPS, By Company, 2016 ($)
Figure 15: Infrared Imaging Devices Market Value Chain
Figure 16: Infrared Imaging Pricing Analysis, 2023-2024 ($)
Figure 17: Global Infrared Imaging Market Life Cycle Analysis
Figure 18: Near IR: Infrared Imaging Market Value, 2023-2024, ($Million)
Figure 19: Short Wave IR: Infrared Imaging Market Value, 2023-2024, ($Million)
Figure 20: Mid Wave IR: Infrared Imaging Market Value, 2023-2024, ($Million)
Figure 21: Long Wave IR: Infrared Imaging Market Value, 2023-2024, ($Million)
Figure 22: Conventional: Infrared Imaging Market Value, 2023-2024, ($Million)
Figure 23: Wide Area: Infrared Imaging Market Value, 2023-2024, ($Million)
Figure 24: Civilian Intrusion: Wide Area Surveillance Infrared Imaging Market Value, 2023-2024 ($Million)
Figure 25: Suspect Tracking: Wide Area Surveillance Infrared Imaging Market Value, 2023-2024 ($Million)
Figure 26: Hazard and Disaster Assessment: Wide Area Surveillance Infrared Imaging Market Value, 2023-2024 ($Million)
Figure 27: Route Reconnaissance and Over watch: Wide Area Surveillance Infrared Imaging Market Value, 2023-2024 ($Million)
Figure 28: Event Monitoring: Wide Area Surveillance Infrared Imaging Market Value, 2023-2024 ($Million)
Figure 29: Number of Terminals Top owners operating in Cement Industries with more than 20 facilities, 2014
Figure 30: Terminal & Perimeter Security: Wide Area Surveillance Infrared Imaging Market Value, 2023-2024 ($Million)
Figure 31: Others: Wide Area Surveillance Infrared Imaging Market Value, 2023-2024 ($Million)
Figure 32: Defense & Law Enforcement: Wide Area Surveillance Infrared Imaging Market Value, 2023-2024 ($Million)
Figure 33: Underground: Defense & Law Enforcement, Wide Area Surveillance Infrared Imaging Market Value, 2023-2024 ($Million)
Figure 34: On-Ground: Defense & Law Enforcement, Wide Area Surveillance Infrared Imaging Market Value, 2023-2024 ($Million)
Figure 35: Industrial: Wide Area Surveillance Infrared Imaging Market Value, 2023-2024 ($Million)
Figure 36: Global Oil Production, 2013-2023, (Million Barrels Per Day)
Figure 37: Oil & Gas: Wide Area Surveillance Infrared Imaging Market Value, 2023-2024 ($Million)
Figure 38: Underground: Oil & Gas, Wide Area Surveillance Infrared Imaging Market Value, 2023-2024 ($Million)
Figure 39: On-Ground: Oil & Gas, Wide Area Surveillance Infrared Imaging Market Value, 2023-2024 ($Million)
Figure 40: Mine Production, Meters drilled in Quebec, 2013-2016
Figure 41: Mining: Wide Area Surveillance Infrared Imaging Market Value, 2023-2024 ($Million)
Figure 42: Underground: Mining, Wide Area Surveillance Infrared Imaging Market Value, 2023-2024 ($Million)
Figure 43: On-Ground: Mining, Wide Area Surveillance Infrared Imaging Market Value, 2023-2024 ($Million)
Figure 44: Production Plants: Wide Area Surveillance Infrared Imaging Market Value, 2023-2024 ($Million)
Figure 45: Others: Wide Area Surveillance Infrared Imaging Market Value, 2023-2024 ($Million)
Figure 46: North America Oil and Gas Capex, By Company, 2023-2030 ($Million)
Figure 47: North America Wide Area Surveillance Infrared Imaging Market, 2023-2024 ($Million)
Figure 48: Aluminum Production in Norway, 2013-2016 (in 1,000 metric tons)
Figure 49: Europe Wide Area Surveillance Infrared Imaging Market, 2023-2024 ($Million)
Figure 50: Iron Ore Production in India, 2013-2016 (in million metric tons)
Figure 51: APAC Wide Area Surveillance Infrared Imaging Market, 2023-2024 ($Million)
Figure 52: Oil Production in Saudi Arabia in 1000 barrels per day, 2013-2016
Figure 53: Middle East Wide Area Surveillance Infrared Imaging Market, 2023-2024 ($Million)
Figure 54: No of Airports in Brazil, 2010-2023 (Number)
Figure 55: ROW Wide Area Surveillance Infrared Imaging Market, 2023-2024 ($Million)
Figure 56: Defence & Law Enforcement: Infrared Imaging Market, 2023-2024, $ M
Figure 57: Private Security: Infrared Imaging Market, 2023-2024, $ M
Figure 58: Energy Auditing Equipment: Infrared Imaging Market, 2023-2024, $ M
Figure 59: Structural Inspection Equipment: Infrared Imaging Market, 2023-2024, $ M
Figure 60: Moisture Detection Equipment: Infrared Imaging Market, 2023-2024, $ M
Figure 61: Non-Destructive Testing Equipment: Infrared Imaging Market, 2023-2024, $ M
Figure 62: Predictive Maintenance Systems: Infrared Imaging Market, 2023-2024, $ M
Figure 63: Process/Product Inspection Systems: Infrared Imaging Market, 2023-2024, $ M
Figure 64: Machine Vision systems: Infrared Imaging Market, 2023-2024, $ M
Figure 65: Others: Infrared Imaging Market, 2023-2024, $ M
Figure 66: Infrared Imaging: Consumer Goods Market Revenue 2023-2024 ($Million)
Figure 67: Global New Cancer Diagnosis, 2012-2030 (Millions)
Figure 68: Global VR/AR in Healthcare Market, 2020-2025 ($Billion)
Figure 69: Infrared Imaging: Healthcare Market Revenue 2023-2024 ($Million)
Figure 70: Global Military Drone Production Volume, 2013-2022 (Units)
Figure 71: Global Commercial UAV Shipments, 2013-2020 (Thousand Units)
Figure 72: Global UUV Market, 2014-2020 ($Million)
Figure 73: Infrared Imaging: Unmanned Vehicles Market Revenue 2023-2024 ($Million)
Figure 74: Global ADAS Production Volume, 2014-2021 (M Units)
Figure 75: Global Autonomous Vehicles Penetration in Automotive Sector, 2020-2030 (%)
Figure 76: Infrared Imaging: Automotive Market Revenue 2023-2024 ($Million)
Figure 77: Seaborne Goods Handled in Nordic Region,2015-2023 (Million Tons)
Figure 78: Average Annual Number of Oil Spills, 1970-2023 (Number)
Figure 79: Number of Pirate Attacks, 2009-2023 (Number)
Figure 80: Number of Pirate Attacks, By Type, 2023 (Number)
Figure 81: Number of Ships Destroyed, By Cause, 2016 (Number)
Figure 82: Number of Ship Collisions in Japan, 2010-2023 (Number)
Figure 83: Global Infrared Imaging Market, By Technology, 2023 - 2024 ($Million)
Figure 84: Global Infrared Imaging Market, By Cooled Technology, 2023 - 2024 ($Million)
Figure 85: Global Infrared Imaging Market, By Uncooled Technology, 2023 - 2024 ($Million)
Figure 86: Global Wide Area Surveillance Imaging Market Revenue Share, By Companies, 2023 (%)
Figure 87: Infrared Imaging Market Entropy Share, (%) By Approaches (2012-2023*)
Figure 88: Infrared Imaging: Total Developments, By Year, 2012-2023*
Figure 89: Infrared Imaging: Total Number of Developments, By Companies, 2012-2023*
Figure 90: Flir Systems, Inc, Revenue ($Million), 2013-2016
Figure 91: Flir Systems, Inc, Revenue Share (%), By Business Segment, 2016
Figure 92: Flir Systems, Inc, Revenue Share (%), By Geography, 2016
Figure 93: Elbit Systems Ltd, Revenue ($Million), 2013-2016
Figure 94: Elbit Systems Ltd, Revenue Share (%), By Business Segment, 2016
Figure 95: Elbit Systems Ltd, Revenue Share (%), By Geography, 2016
Figure 96: L3 Technologies, Inc, Revenue ($Billion), 2013-2016
Figure 97: L3 Technologies, Inc, Revenue Share (%), By Business Segment, 2016
Figure 98: L3 Technologies, Inc, Revenue Share (%), By Geography, 2016
Figure 99: Harris Corporation, Revenue ($Billion), 2014-2023
Figure 100: Harris Corporation, Revenue Share (%), By Business Segment, 2023
Figure 101: Harris Corporation, Revenue Share (%), By Geography, 2023
Figure 102: Thales Group, Revenue ($Billion), 2013-2016
Figure 103: Thales Group, Revenue Share (%), By Business Segment, 2016
Figure 104: Thales Group, Revenue Share (%), By Geography, 2016
Figure 105: Revenue ($ M), 2014-2016
Figure 106: Revenue ($ bn), 2013-2016
Figure 107: Revenue share (%) by Business Segment, 2016
Figure 108: Revenue ($ bn), 2013-2016
Figure 109: Revenue ($ M) by Sources, 2016
Figure 110: Revenue ($ bn), 2013-2016
Figure 111: Sales (%) by Domain, 2016
Figure 112: Axis Communications Net Sales, 2014-2023 ($Million)
Figure 113: Axis Communications Market Share, By Business Segment, 2023 (%)
Figure 114: Axis Communications Market Share, By Geography, 2023 (%)
Figure 115: Robert Bosch GmbH Net Sales, 2015-2016 ($Million)
Figure 116: Robert Bosch GmbH Market Share, By Business Segment, 2016 (%)
Figure 117: Robert bosch Market Share, By Geography, 2016 (%)
Figure 118: Fortive Corporation Net Sales, 2013-2016 ($Million)
Figure 119: Forive Corporation Market Share, By Business Segment, 2016 (%)
Figure 120: Fortive Corporation Market Share, By Geography, 2016 (%)
Figure 121: Leonardo DRS Net Revenue, 2015-2016 ($Million)
Figure 122: Loenardo DRS Market Share, By Business Segment, 2016 (%)
Figure 123: General Dynamics Net Revenue, 2013-2016 ($Million)
Figure 124: General Dyanmics Marekt Share, By Business Segment, 2016 (%)
Figure 125: General Dynamics market Share, By Geography, 2016 (%)