 Email
Email Print
Print


Central Venous Catheter Market - Forecast(2024 - 2030)
Central Venous Catheter Market Overview:
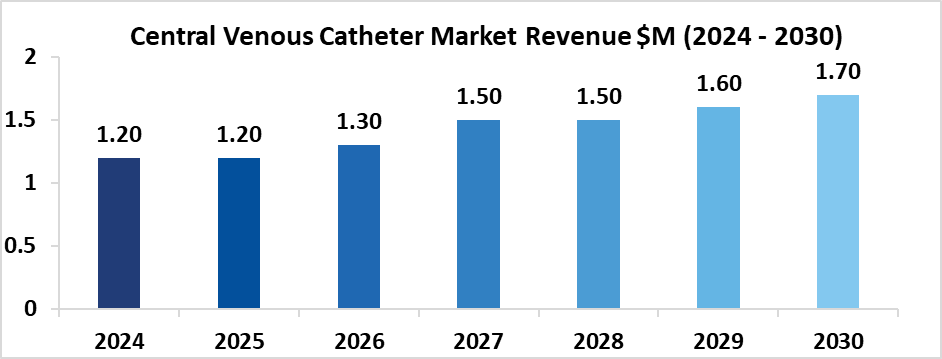
Central venous catheter market size is estimated to reach US$1.7 billion by 2030, after growing at a CAGR of 5.4% during the forecast period 2024-2030. A Central Venous Catheter (CVC), is also famous as the Central Line. It is a thin and flexible tube that is inserted into a large vein in the neck, or chest to monitor chemotherapy drugs, intravenous (IV) fluids, antibiotics, blood and platelet transfusions, parenteral nutrition, etc. to give medicines fluids, nutrients, or blood products when the patient under observation is suffering with diseases such as cancer, cardiovascular diseases and renal failure and traditional way of providing medicines or nutrients not performing. The Central Venous Catheter (CVC) market is witnessing a surge in demand, fueled by the growing prevalence of chronic diseases globally. As the incidence of conditions such as cancer and cardiovascular disorders rises, the need for efficient intravenous delivery of medications and fluids has become paramount. Technological advancements, including antimicrobial coatings and insertion guidance systems, are enhancing the safety and efficacy of CVCs. Additionally, a shift towards non-tunneled and Peripherally Inserted Central Catheters (PICCs), known for reduced infection risks, is notable. The aging population and a heightened awareness of catheter-related complications further contribute to the market's upward trajectory. Amidst stringent regulatory scrutiny, the industry is adapting to ensure adherence to quality standards, fostering a dynamic and evolving landscape.
The Central Venous Catheter (CVC) market is experiencing a notable shift towards non-tunneled and Peripherally Inserted Central Catheters (PICCs). This trend is driven by the desire for easier insertion and lower infection risks compared to traditional tunneled catheters. Healthcare providers are increasingly opting for PICCs due to their versatility and minimally invasive nature, making them suitable for a wide range of medical interventions. This shift underscores a growing preference for catheters that balance effectiveness with reduced complications, aligning with the evolving needs of both healthcare professionals and patients in the dynamic landscape of intravenous interventions.
Central Venous Catheter Market Outlook:
The Central Venous Catheters are used for monitoring the hemodynamic variables and measuring the central venous pressure. The patients who are suffering from cancer, various chronic disorders, and gastrointestinal diseases will require high immune nutrition which is provided through catheters and thus increasing in the demand. The rapid growth in the number of hospitalizations coupled with the high acquisition of CVCs augments the growth of the Central Venous Catheters Market.
Central Venous Catheter Market Growth Drivers:
The important growth drivers for the Central Venous Catheters Market are the increasing number of cardiovascular and cancer patients, the aging population, and people who are suffering from many different chronic disorders are the prior factors that are driving the Market of Central Venous Catheters.
Central Venous Catheter Market Challenges:
Central venous catheters remain crucial for access for patients receiving maintenance hemodialysis. There are many vital and evolving clinical and regulatory considerations for all stakeholders for these CVCs. Innovation, a transparent and comprehensive regulatory review of these devices is essential to stimulate innovation to help promote better output results for patients receiving maintenance hemodialysis. A workgroup that included representatives of industry, and the US Food and Drug Administration was convened to identify the major design considerations and clinical and regulatory challenges of central venous catheters for hemodialysis.
Central Venous Catheter Market Research Scope:
The base year of the study is 2023, with forecasts done up to 2030. The study presents a thorough analysis of the competitive landscape, taking into account the market shares of the leading companies. It also provides information on unit shipments. These provide the key market participants with the necessary business intelligence and help them understand the future of the Central Venous Catheter Market. The assessment includes the forecast, an overview of the competitive structure, the market shares of the competitors, as well as the market trends, market demands, market drivers, market challenges, and product analysis. The market drivers and restraints have been assessed to fathom their impact over the forecast period. This report further identifies the key opportunities for growth while also detailing the key challenges and possible threats.
Central Venous Catheter Market Report: Industry Coverage
Central Venous Catheter Market - By Type: Peripherally inserted central venous catheter, Tunneled central venous catheter, non-tunneled central venous catheter.
Central Venous Catheter Market - By Procedure: Cardiovascular procedure, Chemotherapy procedure, Dialysis procedure.
Central Venous Catheter Market - By Design: Single Lumen, Double Lumen, and Multi-Lumen.
Central Venous Catheter Market - By Composition: Polyurethane, Polyurethane/polycarbonate.
Central Venous Catheter Market - By Applications: kidney dialysis, self-treatment at home, chemotherapy for cancer, long-term antibiotics to fight infection, a lot of blood tests and others.
Central Venous Catheter Market - By End User Industry: Pharmaceutical Industry, Hospitals, and Specialty clinics and Ambulance Surgical Centers and others.
The Central Venous Catheter Market report also analyzes the major geographic regions for the market as well as the major countries for the market in these regions. The regions and countries covered in the study include:
• North America: The U.S., Canada, Mexico
• South America: Brazil, Venezuela, Argentina, Ecuador, Peru, Colombia, Costa Rica
• Europe: The U.K., Germany, Italy, France, The Netherlands, Belgium, Spain, Denmark
• APAC: China, Japan, Australia, South Korea, India, Taiwan, Malaysia, Hong Kong
• Middle East and Africa: Israel, South Africa, Saudi Arabia
Central Venous Catheter Market Key Players Perspective:
The major Key players in this market include Angio Dynamics, Kimal, Terumo Corporation, C.R.Bard, Lepu Medical Technology, Edwards Life Sciences, Vygon(UK) Ltd, Becton Dickinson Company, Polymed Medical Devices, Edges Medicare Private Ltd. and many more.
Market Research and Market Trends of Central Venous Catheter Market:
The market for Central Venous Catheters is expected to progress as key players are expanding production units and taking part in joint ventures for the production of these products. The demand for CVCs is also rising in hospitalization and specialty clinic centers due to their better physical properties in dealing with veins. This is a positive trend for the CVCs business. CVCs are a prominent way of facilitating fluids, medications, and intravenous nutrition, especially for oncology patients and people living with other chronic conditions. CVCs reach into major veins that are designed for long-term secure durable IV access. The chances of getting bloodstream infections are very high among the recipients. To combat this situation, vendors are focusing on introducing antimicrobial-coated catheters and conducting extensive R&D activities and to minimize or eliminate bloodstream infections. For instance, in 2015 the well-known market player Kimal launched Altius ProActiv+ Antimicrobial CVC in Berlin. This covalent-bonded antimicrobial CVC was specially designed to minimize bloodstream infections through its coating.
The recent price increase of CVC by the major key players is bound to affect the demand of the market. The rising raw material cost, as most of them are derived from polyurethane and polycarbonate products, and due to the increase in transportation costs.
The Latest technological innovations have resulted in interventional surgeons, anesthesiologists and radiologists having access to technologically improved CVC catheters. As a consequence, tip location devices, which help in the accurate and precise location of the catheter’s tip, are gaining increased momentum. Further innovation can be witnessed with catheter material compositions, which helps in improving users’ post and pre-catheterization. Antimicrobial coatings, which help in preventing infections and biocompatible materials such as polymer and silicone mixes that are substituting latex materials, are also witnessing high demand to reduce the intensity of pain during administration.
For more Chemicals and Materials Market reports, please click here
1.Central Venous Catheter Market- Overview
1.1.Definitions and Scope
2.Central Venous Catheter Market- Executive summary
2.1.Market Revenue, Market Size and Key Trends by Company
2.2.Key Trends by Type of Application
2.3.Key Trends Segmented by Geography
3.Central Venous Catheter Market
3.1.Comparative analysis
3.1.1.Product Benchmarking - Top 10 companies
3.1.2.Top 5 Financials Analysis
3.1.3.Market Value split by Top 10 companies
3.1.4.Patent Analysis - Top 10 companies
3.1.5.Pricing Analysis
4.Central Venous Catheter Market– Startup Companies Scenario Premium
4.1.Top 10 Startup Company Analysis by
4.1.1.Investment
4.1.2.Revenue
4.1.3.Market Shares
4.1.4.Market Size and Application Analysis
4.1.5.Venture Capital and Funding Scenario
5.Central Venous Catheter Market– Industry Market Entry Scenario Premium Premium
5.1.Regulatory Framework Overview
5.2.New Business and Ease of Doing Business Index
5.3.Case studies of successful ventures
5.4.Customer Analysis – Top 10 companies
6.Central Venous Catheter Market Forces
6.1.Drivers
6.2.Constraints
6.3.Challenges
6.4.Porters five force model
6.4.1.Bargaining power of suppliers
6.4.2.Bargaining powers of customers
6.4.3.Threat of new entrants
6.4.4.Rivalry among existing players
6.4.5.Threat of substitutes
7.Central Venous Catheter Market-Strategic analysis
7.1.Value chain analysis
7.2.Opportunities analysis
7.3.Product life cycle
8.Central Venous Catheter – By Product Type (Market Size -$Million / $Billion)
8.1.Segment Type Size and Market Share Analysis
8.2.Application Revenue and Trends by Type of Application
8.3.Product Segment Analysis by Type
8.3.1.Peripherally inserted Central Catheters (PICC)
8.3.2.Tunneled Central Venous Catheter
8.3.3.Non-Tunneled Central Venous Catheter
9.Central Venous Catheter Market– By Procedure (Market Size -$Million / $Billion)
9.1.Market Size and Market Share Analysis
9.2.Application Revenue and Trend Research
9.3.Product Segment Analysis
9.3.1.Cardiovascular procedure
9.3.2.Chemotherapy procedure
9.3.3.Dialysis procedure
10.Central Venous Catheter Market by Design (Market Size -$Million / $Billion)
10.1.Market Size and Market Share Analysis
10.2.Application Revenue and Trend Research
10.3.Product Segment Analysis
10.3.1.Single Lumen
10.3.2.Double Lumen
10.3.3.Multi Lumen
11.Central Venous Catheter Market by Composition (Market Size -$Million / $Billion)
11.1 Market Size and Market Share Analysis
11.2 Application Revenue and Trend Research
11.3 Composition Segment Analysis
11.3.1.Polyurethane
11.3.2.Polyurethane/Polycarbonate
12.Central Venous Catheter market-By End Users (Market Size -$Million / $Billion)
12.1 Market Size and Market Share Analysis
12.2 Application Revenue and Trend Research
12.3 Product Segment Analysis
12.3.1.Hospitals
12.3.2.Ambulatory Surgical Centers
12.3.3.Specialty Clinic
12.3.4.Others
13.Central Venous Catheter - By Geography (Market Size -$Million / $Billion)
13.1.Central Venous Catheter Market- North America Segment Research
13.2.North America Market Research (Million / $Billion)
13.2.1.Segment Type Size and Market Size Analysis
13.2.2.Revenue and Trends
13.2.3.Application Revenue and Trends by Type of Application
13.2.4.Company Revenue and Product Analysis
13.2.5.North America Product Type and Application Market Size
13.2.5.1.U.S.
13.2.5.2.Canada
13.2.5.3.Mexico
13.3.Central Venous Catheter - South America Segment Research
13.4.South America Market Research (Market Size -$Million / $Billion)
13.4.1.Segment Type Size and Market Size Analysis
13.4.2.Revenue and Trends
13.4.3.Application Revenue and Trends by Type of Application
13.4.4.Company Revenue and Product Analysis
13.4.5.South America Product Type and Application Market Size
13.4.5.1. Brazil
13.4.5.2. Venezuela
13.4.5.3. Argentina
13.4.5.4. Ecuador
13.4.5.5. Peru
13.4.5.6. Colombia
13.4.5.7. Costa Rica
13.4.5.8. Rest of South America
13.5. Central Venous Catheter - Europe Segment Research
13.6. Europe Market Research (Market Size -$Million / $Billion)
13.6.1. Segment Type Size and Market Size Analysis
13.6.2. Revenue and Trends
13.6.3. Application Revenue and Trends by Type of Application
13.6.4. Company Revenue and Product Analysis
13.6.5. Europe Segment Product Type and Application Market Size
13.6.5.1. U.K
13.6.5.2. Germany
13.6.5.3. Italy
13.6.5.4. France
13.6.5.5. Netherlands
13.6.5.6. Belgium
13.6.5.7. Spain
13.6.5.8. Denmark
13.6.5.9. Rest of Europe
13.7. Central Venous Catheter – APAC Segment Research
13.8. APAC Market Research (Market Size -$Million / $Billion)
13.8.1. Segment Type Size and Market Size Analysis
13.8.2. Revenue and Trends
13.8.3. Application Revenue and Trends by Type of Application
13.8.4. Company Revenue and Product Analysis
13.8.5. APAC Segment – Product Type and Application Market Size
13.8.5.1. China
13.8.5.2. Australia
13.8.5.3. Japan
13.8.5.4. South Korea
13.8.5.5. India
13.8.5.6. Taiwan
13.8.5.7. Malaysia
13.8.5.8. Hong Kong
13.8.5.9. Rest of APAC
13.9. Central Venous Catheter – Middle East Segment and Africa Segment Research
13.10. Middle East & Africa Market Research (Market Size -$Million / $Billion)
13.10.1. Segment Type Size and Market Size Analysis
13.10.2. Revenue and Trend Analysis
13.10.3. Application Revenue and Trends by Type of Application
13.10.4. Company Revenue and Product Analysis
13.10.5. Middle East Segment Product Type and Application Market Size
13.10.5.1. Israel
13.10.5.2. Saudi Arabia
13.10.5.3. UAE
13.10.6. Africa Segment Analysis
13.10.6.1. South Africa
13.10.6.2. Rest of Middle East & Africa
14. Central Venous Catheter Market- Entropy
14.1. New product launches
14.2. M&A's, collaborations, JVs and partnerships
15. Central Venous Catheter Market– Industry / Segment Competition Landscape Premium
15.1.Market Share Analysis
15.1.1.Market Share by Country- Top Companies
15.1.2.Market Share by Region- Top 10 companies
15.1.3.Market Share by Type of Application – Top 10 companies
15.1.4.Market Share by Type of Product / Product Category- Top 10 companies
15.1.5.Market Share at Global Level- Top 10 companies
15.1.6.Best Practices for companies
16. Central Venous Catheter Market– Key Company List by Country Premium Premium
17. Central Venous Catheter Market Company Analysis
17.1. Market Share, Company Revenue, Products, M&A, Developments
17.2. Angio Dynamics
17.3. Kimal
17.4. Terumo Corporation
17.5. C.R.Bard
17.6. Lepu Medical Technology
17.7. Edwards Life sciences
17.8. Vygon(UK) Ltd
17.9. Becton Dickinson Company
17.10. Polymed Medical Devices
17.11. Edges Medicare Private Ltd.
17.12. Company 11 and more
"*Financials would be provided on a best-efforts basis for private companies"
18. Central Venous Catheter Market-Appendix
18.1. Abbreviations
18.2. Sources
19. Central Venous Catheter Market-Methodology Premium Premium
19.1. Research Methodology
19.1.1. Company Expert Interviews
19.1.2. Industry Databases
19.1.3. Associations
19.1.4. Company News
19.1.5. Company Annual Reports
19.1.6. Application Trends
19.1.7. New Products and Product Database
19.1.8. Company Transcripts
19.1.9. R&D Trends
19.1.10. Key Opinion Leaders Interviews
19.1.12. Supply and Demand Trends
List of Tables:
Table1: Central Venous Catheter Market Overview 2023-2030
Table2: Central Venous Catheter Market Leader Analysis 2023-2030 (US$)
Table3: Central Venous Catheter Market Product Analysis 2023-2030 (US$)
Table4: Central Venous Catheter Market End User Analysis 2023-2030 (US$)
Table5: Central Venous Catheter Market Patent Analysis 2013-2023* (US$)
Table6: Central Venous Catheter Market Financial Analysis 2023-2030 (US$)
Table7: Central Venous Catheter Market Driver Analysis 2023-2030 (US$)
Table8: Central Venous Catheter Market Challenges Analysis 2023-2030 (US$)
Table9: Central Venous Catheter Market Constraint Analysis 2023-2030 (US$)
Table10: Central Venous Catheter Market Supplier Bargaining Power Analysis 2023-2030 (US$)
Table11: Central Venous Catheter Market Buyer Bargaining Power Analysis 2023-2030 (US$)
Table12: Central Venous Catheter Market Threat of Substitutes Analysis 2023-2030 (US$)
Table13: Central Venous Catheter Market Threat of New Entrants Analysis 2023-2030 (US$)
Table14: Central Venous Catheter Market Degree of Competition Analysis 2023-2030 (US$)
Table15: Central Venous Catheter Market Value Chain Analysis 2023-2030 (US$)
Table16: Central Venous Catheter Market Pricing Analysis 2023-2030 (US$)
Table17: Central Venous Catheter Market Opportunities Analysis 2023-2030 (US$)
Table18: Central Venous Catheter Market Product Life Cycle Analysis 2023-2030 (US$)
Table19: Central Venous Catheter Market Supplier Analysis 2023-2030 (US$)
Table20: Central Venous Catheter Market Distributor Analysis 2023-2030 (US$)
Table21: Central Venous Catheter Market Trend Analysis 2023-2030 (US$)
Table22: Central Venous Catheter Market Size 2023 (US$)
Table23: Central Venous Catheter Market Forecast Analysis 2023-2030 (US$)
Table24: Central Venous Catheter Market Sales Forecast Analysis 2023-2030 (Units)
Table25: Central Venous Catheter Market, Revenue & Volume, By Type, 2023-2030 ($)
Table26: Central Venous Catheter Market By Type, Revenue & Volume, By Peripherally inserted central catheters (PICC), 2023-2030 ($)
Table27: Central Venous Catheter Market By Type, Revenue & Volume, By Tunnelled Central Venous Catheter, 2023-2030 ($)
Table28: Central Venous Catheter Market By Type, Revenue & Volume, By Non-Tunnelled Central Venous Catheter, 2023-2030 ($)
Table29: Central Venous Catheter Market, Revenue & Volume, By Procedure, 2023-2030 ($)
Table30: Central Venous Catheter Market By Procedure, Revenue & Volume, By Cardiovascular procedures, 2023-2030 ($)
Table31: Central Venous Catheter Market By Procedure, Revenue & Volume, By Chemotherapy procedures, 2023-2030 ($)
Table32: Central Venous Catheter Market By Procedure, Revenue & Volume, By Dialysis procedures, 2023-2030 ($)
Table33: North America Central Venous Catheter Market, Revenue & Volume, By Type, 2023-2030 ($)
Table34: North America Central Venous Catheter Market, Revenue & Volume, By Procedure, 2023-2030 ($)
Table35: South america Central Venous Catheter Market, Revenue & Volume, By Type, 2023-2030 ($)
Table36: South america Central Venous Catheter Market, Revenue & Volume, By Procedure, 2023-2030 ($)
Table37: Europe Central Venous Catheter Market, Revenue & Volume, By Type, 2023-2030 ($)
Table38: Europe Central Venous Catheter Market, Revenue & Volume, By Procedure, 2023-2030 ($)
Table39: APAC Central Venous Catheter Market, Revenue & Volume, By Type, 2023-2030 ($)
Table40: APAC Central Venous Catheter Market, Revenue & Volume, By Procedure, 2023-2030 ($)
Table41: Middle East & Africa Central Venous Catheter Market, Revenue & Volume, By Type, 2023-2030 ($)
Table42: Middle East & Africa Central Venous Catheter Market, Revenue & Volume, By Procedure, 2023-2030 ($)
Table43: Russia Central Venous Catheter Market, Revenue & Volume, By Type, 2023-2030 ($)
Table44: Russia Central Venous Catheter Market, Revenue & Volume, By Procedure, 2023-2030 ($)
Table45: Israel Central Venous Catheter Market, Revenue & Volume, By Type, 2023-2030 ($)
Table46: Israel Central Venous Catheter Market, Revenue & Volume, By Procedure, 2023-2030 ($)
Table47: Top Companies 2023 (US$)Central Venous Catheter Market, Revenue & Volume
Table48: Product Launch 2023-2030Central Venous Catheter Market, Revenue & Volume
Table49: Mergers & Acquistions 2023-2030Central Venous Catheter Market, Revenue & Volume
List of Figures:
Figure 1: Overview of Central Venous Catheter Market 2023-2030
Figure 2: Market Share Analysis for Central Venous Catheter Market 2023 (US$)
Figure 3: Product Comparison in Central Venous Catheter Market 2023-2030 (US$)
Figure 4: End User Profile for Central Venous Catheter Market 2023-2030 (US$)
Figure 5: Patent Application and Grant in Central Venous Catheter Market 2013-2023* (US$)
Figure 6: Top 5 Companies Financial Analysis in Central Venous Catheter Market 2023-2030 (US$)
Figure 7: Market Entry Strategy in Central Venous Catheter Market 2023-2030
Figure 8: Ecosystem Analysis in Central Venous Catheter Market 2023
Figure 9: Average Selling Price in Central Venous Catheter Market 2023-2030
Figure 10: Top Opportunites in Central Venous Catheter Market 2023-2030
Figure 11: Market Life Cycle Analysis in Central Venous Catheter Market
Figure 12: GlobalBy TypeCentral Venous Catheter Market Revenue, 2023-2030 ($)
Figure 13: GlobalBy ProcedureCentral Venous Catheter Market Revenue, 2023-2030 ($)
Figure 14: Global Central Venous Catheter Market - By Geography
Figure 15: Global Central Venous Catheter Market Value & Volume, By Geography, 2023-2030 ($)
Figure 16: Global Central Venous Catheter Market CAGR, By Geography, 2023-2030 (%)
Figure 17: North America Central Venous Catheter Market Value & Volume, 2023-2030 ($)
Figure 18: US Central Venous Catheter Market Value & Volume, 2023-2030 ($)
Figure 19: US GDP and Population, 2023-2030 ($)
Figure 20: US GDP – Composition of 2023, By Sector of Origin
Figure 21: US Export and Import Value & Volume, 2023-2030 ($)
Figure 22: Canada Central Venous Catheter Market Value & Volume, 2023-2030 ($)
Figure 23: Canada GDP and Population, 2023-2030 ($)
Figure 24: Canada GDP – Composition of 2023, By Sector of Origin
Figure 25: Canada Export and Import Value & Volume, 2023-2030 ($)
Figure 26: Mexico Central Venous Catheter Market Value & Volume, 2023-2030 ($)
Figure 27: Mexico GDP and Population, 2023-2030 ($)
Figure 28: Mexico GDP – Composition of 2023, By Sector of Origin
Figure 29: Mexico Export and Import Value & Volume, 2023-2030 ($)
Figure 30: South America Central Venous Catheter Market Value & Volume, 2023-2030 ($)
Figure 31: Brazil Central Venous Catheter Market Value & Volume, 2023-2030 ($)
Figure 32: Brazil GDP and Population, 2023-2030 ($)
Figure 33: Brazil GDP – Composition of 2023, By Sector of Origin
Figure 34: Brazil Export and Import Value & Volume, 2023-2030 ($)
Figure 35: Venezuela Central Venous Catheter Market Value & Volume, 2023-2030 ($)
Figure 36: Venezuela GDP and Population, 2023-2030 ($)
Figure 37: Venezuela GDP – Composition of 2023, By Sector of Origin
Figure 38: Venezuela Export and Import Value & Volume, 2023-2030 ($)
Figure 39: Argentina Central Venous Catheter Market Value & Volume, 2023-2030 ($)
Figure 40: Argentina GDP and Population, 2023-2030 ($)
Figure 41: Argentina GDP – Composition of 2023, By Sector of Origin
Figure 42: Argentina Export and Import Value & Volume, 2023-2030 ($)
Figure 43: Ecuador Central Venous Catheter Market Value & Volume, 2023-2030 ($)
Figure 44: Ecuador GDP and Population, 2023-2030 ($)
Figure 45: Ecuador GDP – Composition of 2023, By Sector of Origin
Figure 46: Ecuador Export and Import Value & Volume, 2023-2030 ($)
Figure 47: Peru Central Venous Catheter Market Value & Volume, 2023-2030 ($)
Figure 48: Peru GDP and Population, 2023-2030 ($)
Figure 49: Peru GDP – Composition of 2023, By Sector of Origin
Figure 50: Peru Export and Import Value & Volume, 2023-2030 ($)
Figure 51: Colombia Central Venous Catheter Market Value & Volume, 2023-2030 ($)
Figure 52: Colombia GDP and Population, 2023-2030 ($)
Figure 53: Colombia GDP – Composition of 2023, By Sector of Origin
Figure 54: Colombia Export and Import Value & Volume, 2023-2030 ($)
Figure 55: Costa Rica Central Venous Catheter Market Value & Volume, 2023-2030 ($)
Figure 56: Costa Rica GDP and Population, 2023-2030 ($)
Figure 57: Costa Rica GDP – Composition of 2023, By Sector of Origin
Figure 58: Costa Rica Export and Import Value & Volume, 2023-2030 ($)
Figure 59: Europe Central Venous Catheter Market Value & Volume, 2023-2030 ($)
Figure 60: U.K Central Venous Catheter Market Value & Volume, 2023-2030 ($)
Figure 61: U.K GDP and Population, 2023-2030 ($)
Figure 62: U.K GDP – Composition of 2023, By Sector of Origin
Figure 63: U.K Export and Import Value & Volume, 2023-2030 ($)
Figure 64: Germany Central Venous Catheter Market Value & Volume, 2023-2030 ($)
Figure 65: Germany GDP and Population, 2023-2030 ($)
Figure 66: Germany GDP – Composition of 2023, By Sector of Origin
Figure 67: Germany Export and Import Value & Volume, 2023-2030 ($)
Figure 68: Italy Central Venous Catheter Market Value & Volume, 2023-2030 ($)
Figure 69: Italy GDP and Population, 2023-2030 ($)
Figure 70: Italy GDP – Composition of 2023, By Sector of Origin
Figure 71: Italy Export and Import Value & Volume, 2023-2030 ($)
Figure 72: France Central Venous Catheter Market Value & Volume, 2023-2030 ($)
Figure 73: France GDP and Population, 2023-2030 ($)
Figure 74: France GDP – Composition of 2023, By Sector of Origin
Figure 75: France Export and Import Value & Volume, 2023-2030 ($)
Figure 76: Netherlands Central Venous Catheter Market Value & Volume, 2023-2030 ($)
Figure 77: Netherlands GDP and Population, 2023-2030 ($)
Figure 78: Netherlands GDP – Composition of 2023, By Sector of Origin
Figure 79: Netherlands Export and Import Value & Volume, 2023-2030 ($)
Figure 80: Belgium Central Venous Catheter Market Value & Volume, 2023-2030 ($)
Figure 81: Belgium GDP and Population, 2023-2030 ($)
Figure 82: Belgium GDP – Composition of 2023, By Sector of Origin
Figure 83: Belgium Export and Import Value & Volume, 2023-2030 ($)
Figure 84: Spain Central Venous Catheter Market Value & Volume, 2023-2030 ($)
Figure 85: Spain GDP and Population, 2023-2030 ($)
Figure 86: Spain GDP – Composition of 2023, By Sector of Origin
Figure 87: Spain Export and Import Value & Volume, 2023-2030 ($)
Figure 88: Denmark Central Venous Catheter Market Value & Volume, 2023-2030 ($)
Figure 89: Denmark GDP and Population, 2023-2030 ($)
Figure 90: Denmark GDP – Composition of 2023, By Sector of Origin
Figure 91: Denmark Export and Import Value & Volume, 2023-2030 ($)
Figure 92: APAC Central Venous Catheter Market Value & Volume, 2023-2030 ($)
Figure 93: China Central Venous Catheter Market Value & Volume, 2023-2030
Figure 94: China GDP and Population, 2023-2030 ($)
Figure 95: China GDP – Composition of 2023, By Sector of Origin
Figure 96: China Export and Import Value & Volume, 2023-2030 ($)Central Venous Catheter Market China Export and Import Value & Volume, 2023-2030 ($)
Figure 97: Australia Central Venous Catheter Market Value & Volume, 2023-2030 ($)
Figure 98: Australia GDP and Population, 2023-2030 ($)
Figure 99: Australia GDP – Composition of 2023, By Sector of Origin
Figure 100: Australia Export and Import Value & Volume, 2023-2030 ($)
Figure 101: South Korea Central Venous Catheter Market Value & Volume, 2023-2030 ($)
Figure 102: South Korea GDP and Population, 2023-2030 ($)
Figure 103: South Korea GDP – Composition of 2023, By Sector of Origin
Figure 104: South Korea Export and Import Value & Volume, 2023-2030 ($)
Figure 105: India Central Venous Catheter Market Value & Volume, 2023-2030 ($)
Figure 106: India GDP and Population, 2023-2030 ($)
Figure 107: India GDP – Composition of 2023, By Sector of Origin
Figure 108: India Export and Import Value & Volume, 2023-2030 ($)
Figure 109: Taiwan Central Venous Catheter Market Value & Volume, 2023-2030 ($)
Figure 110: Taiwan GDP and Population, 2023-2030 ($)
Figure 111: Taiwan GDP – Composition of 2023, By Sector of Origin
Figure 112: Taiwan Export and Import Value & Volume, 2023-2030 ($)
Figure 113: Malaysia Central Venous Catheter Market Value & Volume, 2023-2030 ($)
Figure 114: Malaysia GDP and Population, 2023-2030 ($)
Figure 115: Malaysia GDP – Composition of 2023, By Sector of Origin
Figure 116: Malaysia Export and Import Value & Volume, 2023-2030 ($)
Figure 117: Hong Kong Central Venous Catheter Market Value & Volume, 2023-2030 ($)
Figure 118: Hong Kong GDP and Population, 2023-2030 ($)
Figure 119: Hong Kong GDP – Composition of 2023, By Sector of Origin
Figure 120: Hong Kong Export and Import Value & Volume, 2023-2030 ($)
Figure 121: Middle East & Africa Central Venous Catheter Market Middle East & Africa 3D Printing Market Value & Volume, 2023-2030 ($)
Figure 122: Russia Central Venous Catheter Market Value & Volume, 2023-2030 ($)
Figure 123: Russia GDP and Population, 2023-2030 ($)
Figure 124: Russia GDP – Composition of 2023, By Sector of Origin
Figure 125: Russia Export and Import Value & Volume, 2023-2030 ($)
Figure 126: Israel Central Venous Catheter Market Value & Volume, 2023-2030 ($)
Figure 127: Israel GDP and Population, 2023-2030 ($)
Figure 128: Israel GDP – Composition of 2023, By Sector of Origin
Figure 129: Israel Export and Import Value & Volume, 2023-2030 ($)
Figure 130: Entropy Share, By Strategies, 2023-2030* (%)Central Venous Catheter Market
Figure 131: Developments, 2023-2030*Central Venous Catheter Market
Figure 132: Company 1 Central Venous Catheter Market Net Revenue, By Years, 2023-2030* ($)
Figure 133: Company 1 Central Venous Catheter Market Net Revenue Share, By Business segments, 2023 (%)
Figure 134: Company 1 Central Venous Catheter Market Net Sales Share, By Geography, 2023 (%)
Figure 135: Company 2 Central Venous Catheter Market Net Revenue, By Years, 2023-2030* ($)
Figure 136: Company 2 Central Venous Catheter Market Net Revenue Share, By Business segments, 2023 (%)
Figure 137: Company 2 Central Venous Catheter Market Net Sales Share, By Geography, 2023 (%)
Figure 138: Company 3 Central Venous Catheter Market Net Revenue, By Years, 2023-2030* ($)
Figure 139: Company 3 Central Venous Catheter Market Net Revenue Share, By Business segments, 2023 (%)
Figure 140: Company 3 Central Venous Catheter Market Net Sales Share, By Geography, 2023 (%)
Figure 141: Company 4 Central Venous Catheter Market Net Revenue, By Years, 2023-2030* ($)
Figure 142: Company 4 Central Venous Catheter Market Net Revenue Share, By Business segments, 2023 (%)
Figure 143: Company 4 Central Venous Catheter Market Net Sales Share, By Geography, 2023 (%)
Figure 144: Company 5 Central Venous Catheter Market Net Revenue, By Years, 2023-2030* ($)
Figure 145: Company 5 Central Venous Catheter Market Net Revenue Share, By Business segments, 2023 (%)
Figure 146: Company 5 Central Venous Catheter Market Net Sales Share, By Geography, 2023 (%)
Figure 147: Company 6 Central Venous Catheter Market Net Revenue, By Years, 2023-2030* ($)
Figure 148: Company 6 Central Venous Catheter Market Net Revenue Share, By Business segments, 2023 (%)
Figure 149: Company 6 Central Venous Catheter Market Net Sales Share, By Geography, 2023 (%)
Figure 150: Company 7 Central Venous Catheter Market Net Revenue, By Years, 2023-2030* ($)
Figure 151: Company 7 Central Venous Catheter Market Net Revenue Share, By Business segments, 2023 (%)
Figure 152: Company 7 Central Venous Catheter Market Net Sales Share, By Geography, 2023 (%)
Figure 153: Company 8 Central Venous Catheter Market Net Revenue, By Years, 2023-2030* ($)
Figure 154: Company 8 Central Venous Catheter Market Net Revenue Share, By Business segments, 2023 (%)
Figure 155: Company 8 Central Venous Catheter Market Net Sales Share, By Geography, 2023 (%)
Figure 156: Company 9 Central Venous Catheter Market Net Revenue, By Years, 2023-2030* ($)
Figure 157: Company 9 Central Venous Catheter Market Net Revenue Share, By Business segments, 2023 (%)
Figure 158: Company 9 Central Venous Catheter Market Net Sales Share, By Geography, 2023 (%)
Figure 159: Company 10 Central Venous Catheter Market Net Revenue, By Years, 2023-2030* ($)
Figure 160: Company 10 Central Venous Catheter Market Net Revenue Share, By Business segments, 2023 (%)
Figure 161: Company 10 Central Venous Catheter Market Net Sales Share, By Geography, 2023 (%)
Figure 162: Company 11 Central Venous Catheter Market Net Revenue, By Years, 2023-2030* ($)
Figure 163: Company 11 Central Venous Catheter Market Net Revenue Share, By Business segments, 2023 (%)
Figure 164: Company 11 Central Venous Catheter Market Net Sales Share, By Geography, 2023 (%)
Figure 165: Company 12 Central Venous Catheter Market Net Revenue, By Years, 2023-2030* ($)
Figure 166: Company 12 Central Venous Catheter Market Net Revenue Share, By Business segments, 2023 (%)
Figure 167: Company 12 Central Venous Catheter Market Net Sales Share, By Geography, 2023 (%)
Figure 168: Company 13 Central Venous Catheter Market Net Revenue, By Years, 2023-2030* ($)
Figure 169: Company 13 Central Venous Catheter Market Net Revenue Share, By Business segments, 2023 (%)
Figure 170: Company 13 Central Venous Catheter Market Net Sales Share, By Geography, 2023 (%)
Figure 171: Company 14 Central Venous Catheter Market Net Revenue, By Years, 2023-2030* ($)
Figure 172: Company 14 Central Venous Catheter Market Net Revenue Share, By Business segments, 2023 (%)
Figure 173: Company 14 Central Venous Catheter Market Net Sales Share, By Geography, 2023 (%)
Figure 174: Company 15 Central Venous Catheter Market Net Revenue, By Years, 2023-2030* ($)
Figure 175: Company 15 Central Venous Catheter Market Net Revenue Share, By Business segments, 2023 (%)
Figure 176: Company 15 Central Venous Catheter Market Net Sales Share, By Geography, 2023 (%)