 Email
Email Print
Print


Numerous advancements have been made in the field of physics over the last couple of decades. Scientists have made remarkable discoveries at an atomic level, which has allowed them to look at the development of new compounds and elements. With these discoveries, metallurgists are able to deduce how different materials will react under different conditions. All of this was made possible through the use of particle detectors. Further to this, particle detectors have also been used for the purpose of tracking elements in case of leakages. For example, in case of a radiation leak, particle counters can be used to count the number of radioactive particles to determine the amount of radiation.
The new age of particle counters are not able to just count the particles of certain molecules or elements, but are also able to provide an analysis of the compound under observation based on pre-determined readings. The latest particle counters are able to integrate with information systems so that data can be transferred or retrieved easily. Further to this, digital readouts of the analysis makes it easier for scientists or the user to make quick informed decisions. Depending on the use of the particle detector, there can be a number of types. Modern-day particle detectors employ a combination of all detectors, which can be used for a variety of applications. These detectors are becoming increasingly more popular than stand-alone detectors especially since a single lab can do the testing of compounds across a wide variety of applications.
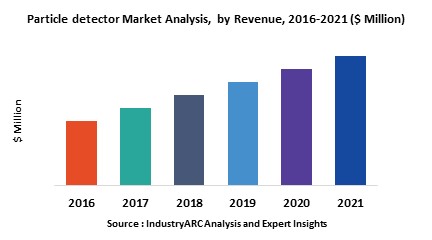
The European and American regions are the highest contributors to the overall particle detectors market and will continue to be so till the end of the forecast period. Continual testing and R&D investments by numerous companies will foster the growth for the particle detector market. Key trends in the market will include technological development in the production of particle detectors. These developments will include the development of higher and more precise particle detectors.
The Particle detector Market can be segmented as
The new age of particle counters are not able to just count the particles of certain molecules or elements, but are also able to provide an analysis of the compound under observation based on pre-determined readings. The latest particle counters are able to integrate with information systems so that data can be transferred or retrieved easily. Further to this, digital readouts of the analysis makes it easier for scientists or the user to make quick informed decisions. Depending on the use of the particle detector, there can be a number of types. Modern-day particle detectors employ a combination of all detectors, which can be used for a variety of applications. These detectors are becoming increasingly more popular than stand-alone detectors especially since a single lab can do the testing of compounds across a wide variety of applications.
The European and American regions are the highest contributors to the overall particle detectors market and will continue to be so till the end of the forecast period. Continual testing and R&D investments by numerous companies will foster the growth for the particle detector market. Key trends in the market will include technological development in the production of particle detectors. These developments will include the development of higher and more precise particle detectors.
The Particle detector Market can be segmented as
- on the basis of application
- Industrial, Manufacturing, Automotive, Healthcare and Telecom
- In terms of components
- At colliders, Under construction and Without colliders
- In terms of chamber type
- Ionization, Multi wire, Drift, Time projection, Gieger Muller and spark
- In terms of type
- Infrared, Beta Attenuation Mass Monitoring and Laser Diffraction
- By Geography
- North America, South America, APAC, Europe, Middle East and Africa
Sample Companies profiled in this Report are:
- Lighthouse Worldwide
- Particle Measuring Instruments
- Smiths Detection
- Spectrex
- TSI Precision Measuring Instruments
- 10+.
1. Particle detector– Market Overview
2. Executive Summary
3. Particle detector– Market Landscape
3.1. Market Share Analysis
3.2. Comparative Analysis
3.2.1. Product Benchmarking
3.2.2. End User Profiling
3.2.3. Top 5 Financials Analysis
4. Particle detector– Market Forces
4.1. Market Drivers
4.2. Market Constraints
4.3. Market Challenges
4.4. Attractiveness of the Particle detector Market
4.4.1. Power of Suppliers
4.4.2. Power of Customers
4.4.3. Threat of New Entrants
4.4.4. Threat of Substitution
4.4.5. Degree of Competition
5. Particle detector Market– Strategic Analysis
5.1. Value Chain Analysis
5.2. Pricing Analysis
5.3. Opportunities Analysis
5.4. Product/Market Life Cycle Analysis
5.5. Suppliers and Distributors
6. Particle detector Market– By Type:
6.1. At colliders
6.2. Under construction
6.3. Without colliders
7. Particle detector Market– By Chamber Type:
7.1. Ionization
7.2. Multi wire
7.3. Drift
7.4. Time projection
7.5. Gieger muller
7.6. Spark
8. Particle detector Market– By Type:
8.1. Infrared
8.2. Beta Attenuation Mass Monitoring
8.3. Laser Diffraction
9. Particle detector Market– By Geography:
9.1. Introduction
9.2. Global Study
9.3. Americas
9.3.1. North America
9.3.2. Brazil
9.3.3. Argentina
9.3.4. Others
9.4. Europe
9.4.1. U.K.
9.4.2. France
9.4.3. Germany
9.4.4. Others
9.5. APAC
9.5.1. China
9.5.2. Japan
9.5.3. India
9.5.4. Others
9.6. ROW
10. Market Entropy
10.1. New Product Launches
10.2. M&As, Collaborations, JVs and Partnerships
11. Company Profiles
11.1. Lighthouse Worldwide
11.2. Particle Measuring Instruments
11.3. Smiths Detection
11.4. Spectrex
11.5. TSI Precision Measuring Instruments
*More than 10 Companies are profiled in this Research Report*
"*Financials would be provided on a best efforts basis for private companies"
12. Appendix
12.1. Abbreviations
12.2. Sources
12.3. Research Methodology
12.4. Bibliography
12.5. Compilation of Expert Insights
12.6. Disclaimer
List of Tables:
Table1: Particle detector Market Overview 2023-2030
Table2: Particle detector Market Leader Analysis 2023-2030 (US$)
Table3: Particle detector Market Product Analysis 2023-2030 (US$)
Table4: Particle detector Market End User Analysis 2023-2030 (US$)
Table5: Particle detector Market Patent Analysis 2013-2023* (US$)
Table6: Particle detector Market Financial Analysis 2023-2030 (US$)
Table7: Particle detector Market Driver Analysis 2023-2030 (US$)
Table8: Particle detector Market Challenges Analysis 2023-2030 (US$)
Table9: Particle detector Market Constraint Analysis 2023-2030 (US$)
Table10: Particle detector Market Supplier Bargaining Power Analysis 2023-2030 (US$)
Table11: Particle detector Market Buyer Bargaining Power Analysis 2023-2030 (US$)
Table12: Particle detector Market Threat of Substitutes Analysis 2023-2030 (US$)
Table13: Particle detector Market Threat of New Entrants Analysis 2023-2030 (US$)
Table14: Particle detector Market Degree of Competition Analysis 2023-2030 (US$)
Table15: Particle detector Market Value Chain Analysis 2023-2030 (US$)
Table16: Particle detector Market Pricing Analysis 2023-2030 (US$)
Table17: Particle detector Market Opportunities Analysis 2023-2030 (US$)
Table18: Particle detector Market Product Life Cycle Analysis 2023-2030 (US$)
Table19: Particle detector Market Supplier Analysis 2023-2030 (US$)
Table20: Particle detector Market Distributor Analysis 2023-2030 (US$)
Table21: Particle detector Market Trend Analysis 2023-2030 (US$)
Table22: Particle detector Market Size 2023 (US$)
Table23: Particle detector Market Forecast Analysis 2023-2030 (US$)
Table24: Particle detector Market Sales Forecast Analysis 2023-2030 (Units)
Table25: Particle detector Market, Revenue & Volume, By Component, 2023-2030 ($)
Table26: Particle detector Market By Component, Revenue & Volume, By At colliders, 2023-2030 ($)
Table27: Particle detector Market By Component, Revenue & Volume, By Under construction, 2023-2030 ($)
Table28: Particle detector Market By Component, Revenue & Volume, By Without colliders, 2023-2030 ($)
Table29: Particle detector Market, Revenue & Volume, By Chamber Type, 2023-2030 ($)
Table30: Particle detector Market By Chamber Type, Revenue & Volume, By Ionization, 2023-2030 ($)
Table31: Particle detector Market By Chamber Type, Revenue & Volume, By Multi wire, 2023-2030 ($)
Table32: Particle detector Market By Chamber Type, Revenue & Volume, By Drift, 2023-2030 ($)
Table33: Particle detector Market By Chamber Type, Revenue & Volume, By Time projection, 2023-2030 ($)
Table34: Particle detector Market By Chamber Type, Revenue & Volume, By Gieger muller, 2023-2030 ($)
Table35: Particle detector Market, Revenue & Volume, By Type, 2023-2030 ($)
Table36: Particle detector Market By Type, Revenue & Volume, By Infrared, 2023-2030 ($)
Table37: Particle detector Market By Type, Revenue & Volume, By Beta Attenuation Mass Monitoring, 2023-2030 ($)
Table38: Particle detector Market By Type, Revenue & Volume, By Laser Diffraction, 2023-2030 ($)
Table39: North America Particle detector Market, Revenue & Volume, By Component, 2023-2030 ($)
Table40: North America Particle detector Market, Revenue & Volume, By Chamber Type, 2023-2030 ($)
Table41: North America Particle detector Market, Revenue & Volume, By Type, 2023-2030 ($)
Table42: South america Particle detector Market, Revenue & Volume, By Component, 2023-2030 ($)
Table43: South america Particle detector Market, Revenue & Volume, By Chamber Type, 2023-2030 ($)
Table44: South america Particle detector Market, Revenue & Volume, By Type, 2023-2030 ($)
Table45: Europe Particle detector Market, Revenue & Volume, By Component, 2023-2030 ($)
Table46: Europe Particle detector Market, Revenue & Volume, By Chamber Type, 2023-2030 ($)
Table47: Europe Particle detector Market, Revenue & Volume, By Type, 2023-2030 ($)
Table48: APAC Particle detector Market, Revenue & Volume, By Component, 2023-2030 ($)
Table49: APAC Particle detector Market, Revenue & Volume, By Chamber Type, 2023-2030 ($)
Table50: APAC Particle detector Market, Revenue & Volume, By Type, 2023-2030 ($)
Table51: Middle East & Africa Particle detector Market, Revenue & Volume, By Component, 2023-2030 ($)
Table52: Middle East & Africa Particle detector Market, Revenue & Volume, By Chamber Type, 2023-2030 ($)
Table53: Middle East & Africa Particle detector Market, Revenue & Volume, By Type, 2023-2030 ($)
Table54: Russia Particle detector Market, Revenue & Volume, By Component, 2023-2030 ($)
Table55: Russia Particle detector Market, Revenue & Volume, By Chamber Type, 2023-2030 ($)
Table56: Russia Particle detector Market, Revenue & Volume, By Type, 2023-2030 ($)
Table57: Israel Particle detector Market, Revenue & Volume, By Component, 2023-2030 ($)
Table58: Israel Particle detector Market, Revenue & Volume, By Chamber Type, 2023-2030 ($)
Table59: Israel Particle detector Market, Revenue & Volume, By Type, 2023-2030 ($)
Table60: Top Companies 2023 (US$)Particle detector Market, Revenue & Volume
Table61: Product Launch 2023-2030Particle detector Market, Revenue & Volume
Table62: Mergers & Acquistions 2023-2030Particle detector Market, Revenue & Volume
List of Figures:
Figure 1: Overview of Particle detector Market 2023-2030
Figure 2: Market Share Analysis for Particle detector Market 2023 (US$)
Figure 3: Product Comparison in Particle detector Market 2023-2030 (US$)
Figure 4: End User Profile for Particle detector Market 2023-2030 (US$)
Figure 5: Patent Application and Grant in Particle detector Market 2013-2023* (US$)
Figure 6: Top 5 Companies Financial Analysis in Particle detector Market 2023-2030 (US$)
Figure 7: Market Entry Strategy in Particle detector Market 2023-2030
Figure 8: Ecosystem Analysis in Particle detector Market 2023
Figure 9: Average Selling Price in Particle detector Market 2023-2030
Figure 10: Top Opportunites in Particle detector Market 2023-2030
Figure 11: Market Life Cycle Analysis in Particle detector Market
Figure 12: GlobalBy ComponentParticle detector Market Revenue, 2023-2030 ($)
Figure 13: GlobalBy Chamber TypeParticle detector Market Revenue, 2023-2030 ($)
Figure 14: GlobalBy TypeParticle detector Market Revenue, 2023-2030 ($)
Figure 15: Global Particle detector Market - By Geography
Figure 16: Global Particle detector Market Value & Volume, By Geography, 2023-2030 ($)
Figure 17: Global Particle detector Market CAGR, By Geography, 2023-2030 (%)
Figure 18: North America Particle detector Market Value & Volume, 2023-2030 ($)
Figure 19: US Particle detector Market Value & Volume, 2023-2030 ($)
Figure 20: US GDP and Population, 2023-2030 ($)
Figure 21: US GDP – Composition of 2023, By Sector of Origin
Figure 22: US Export and Import Value & Volume, 2023-2030 ($)
Figure 23: Canada Particle detector Market Value & Volume, 2023-2030 ($)
Figure 24: Canada GDP and Population, 2023-2030 ($)
Figure 25: Canada GDP – Composition of 2023, By Sector of Origin
Figure 26: Canada Export and Import Value & Volume, 2023-2030 ($)
Figure 27: Mexico Particle detector Market Value & Volume, 2023-2030 ($)
Figure 28: Mexico GDP and Population, 2023-2030 ($)
Figure 29: Mexico GDP – Composition of 2023, By Sector of Origin
Figure 30: Mexico Export and Import Value & Volume, 2023-2030 ($)
Figure 31: South America Particle detector Market Value & Volume, 2023-2030 ($)
Figure 32: Brazil Particle detector Market Value & Volume, 2023-2030 ($)
Figure 33: Brazil GDP and Population, 2023-2030 ($)
Figure 34: Brazil GDP – Composition of 2023, By Sector of Origin
Figure 35: Brazil Export and Import Value & Volume, 2023-2030 ($)
Figure 36: Venezuela Particle detector Market Value & Volume, 2023-2030 ($)
Figure 37: Venezuela GDP and Population, 2023-2030 ($)
Figure 38: Venezuela GDP – Composition of 2023, By Sector of Origin
Figure 39: Venezuela Export and Import Value & Volume, 2023-2030 ($)
Figure 40: Argentina Particle detector Market Value & Volume, 2023-2030 ($)
Figure 41: Argentina GDP and Population, 2023-2030 ($)
Figure 42: Argentina GDP – Composition of 2023, By Sector of Origin
Figure 43: Argentina Export and Import Value & Volume, 2023-2030 ($)
Figure 44: Ecuador Particle detector Market Value & Volume, 2023-2030 ($)
Figure 45: Ecuador GDP and Population, 2023-2030 ($)
Figure 46: Ecuador GDP – Composition of 2023, By Sector of Origin
Figure 47: Ecuador Export and Import Value & Volume, 2023-2030 ($)
Figure 48: Peru Particle detector Market Value & Volume, 2023-2030 ($)
Figure 49: Peru GDP and Population, 2023-2030 ($)
Figure 50: Peru GDP – Composition of 2023, By Sector of Origin
Figure 51: Peru Export and Import Value & Volume, 2023-2030 ($)
Figure 52: Colombia Particle detector Market Value & Volume, 2023-2030 ($)
Figure 53: Colombia GDP and Population, 2023-2030 ($)
Figure 54: Colombia GDP – Composition of 2023, By Sector of Origin
Figure 55: Colombia Export and Import Value & Volume, 2023-2030 ($)
Figure 56: Costa Rica Particle detector Market Value & Volume, 2023-2030 ($)
Figure 57: Costa Rica GDP and Population, 2023-2030 ($)
Figure 58: Costa Rica GDP – Composition of 2023, By Sector of Origin
Figure 59: Costa Rica Export and Import Value & Volume, 2023-2030 ($)
Figure 60: Europe Particle detector Market Value & Volume, 2023-2030 ($)
Figure 61: U.K Particle detector Market Value & Volume, 2023-2030 ($)
Figure 62: U.K GDP and Population, 2023-2030 ($)
Figure 63: U.K GDP – Composition of 2023, By Sector of Origin
Figure 64: U.K Export and Import Value & Volume, 2023-2030 ($)
Figure 65: Germany Particle detector Market Value & Volume, 2023-2030 ($)
Figure 66: Germany GDP and Population, 2023-2030 ($)
Figure 67: Germany GDP – Composition of 2023, By Sector of Origin
Figure 68: Germany Export and Import Value & Volume, 2023-2030 ($)
Figure 69: Italy Particle detector Market Value & Volume, 2023-2030 ($)
Figure 70: Italy GDP and Population, 2023-2030 ($)
Figure 71: Italy GDP – Composition of 2023, By Sector of Origin
Figure 72: Italy Export and Import Value & Volume, 2023-2030 ($)
Figure 73: France Particle detector Market Value & Volume, 2023-2030 ($)
Figure 74: France GDP and Population, 2023-2030 ($)
Figure 75: France GDP – Composition of 2023, By Sector of Origin
Figure 76: France Export and Import Value & Volume, 2023-2030 ($)
Figure 77: Netherlands Particle detector Market Value & Volume, 2023-2030 ($)
Figure 78: Netherlands GDP and Population, 2023-2030 ($)
Figure 79: Netherlands GDP – Composition of 2023, By Sector of Origin
Figure 80: Netherlands Export and Import Value & Volume, 2023-2030 ($)
Figure 81: Belgium Particle detector Market Value & Volume, 2023-2030 ($)
Figure 82: Belgium GDP and Population, 2023-2030 ($)
Figure 83: Belgium GDP – Composition of 2023, By Sector of Origin
Figure 84: Belgium Export and Import Value & Volume, 2023-2030 ($)
Figure 85: Spain Particle detector Market Value & Volume, 2023-2030 ($)
Figure 86: Spain GDP and Population, 2023-2030 ($)
Figure 87: Spain GDP – Composition of 2023, By Sector of Origin
Figure 88: Spain Export and Import Value & Volume, 2023-2030 ($)
Figure 89: Denmark Particle detector Market Value & Volume, 2023-2030 ($)
Figure 90: Denmark GDP and Population, 2023-2030 ($)
Figure 91: Denmark GDP – Composition of 2023, By Sector of Origin
Figure 92: Denmark Export and Import Value & Volume, 2023-2030 ($)
Figure 93: APAC Particle detector Market Value & Volume, 2023-2030 ($)
Figure 94: China Particle detector Market Value & Volume, 2023-2030
Figure 95: China GDP and Population, 2023-2030 ($)
Figure 96: China GDP – Composition of 2023, By Sector of Origin
Figure 97: China Export and Import Value & Volume, 2023-2030 ($)Particle detector Market China Export and Import Value & Volume, 2023-2030 ($)
Figure 98: Australia Particle detector Market Value & Volume, 2023-2030 ($)
Figure 99: Australia GDP and Population, 2023-2030 ($)
Figure 100: Australia GDP – Composition of 2023, By Sector of Origin
Figure 101: Australia Export and Import Value & Volume, 2023-2030 ($)
Figure 102: South Korea Particle detector Market Value & Volume, 2023-2030 ($)
Figure 103: South Korea GDP and Population, 2023-2030 ($)
Figure 104: South Korea GDP – Composition of 2023, By Sector of Origin
Figure 105: South Korea Export and Import Value & Volume, 2023-2030 ($)
Figure 106: India Particle detector Market Value & Volume, 2023-2030 ($)
Figure 107: India GDP and Population, 2023-2030 ($)
Figure 108: India GDP – Composition of 2023, By Sector of Origin
Figure 109: India Export and Import Value & Volume, 2023-2030 ($)
Figure 110: Taiwan Particle detector Market Value & Volume, 2023-2030 ($)
Figure 111: Taiwan GDP and Population, 2023-2030 ($)
Figure 112: Taiwan GDP – Composition of 2023, By Sector of Origin
Figure 113: Taiwan Export and Import Value & Volume, 2023-2030 ($)
Figure 114: Malaysia Particle detector Market Value & Volume, 2023-2030 ($)
Figure 115: Malaysia GDP and Population, 2023-2030 ($)
Figure 116: Malaysia GDP – Composition of 2023, By Sector of Origin
Figure 117: Malaysia Export and Import Value & Volume, 2023-2030 ($)
Figure 118: Hong Kong Particle detector Market Value & Volume, 2023-2030 ($)
Figure 119: Hong Kong GDP and Population, 2023-2030 ($)
Figure 120: Hong Kong GDP – Composition of 2023, By Sector of Origin
Figure 121: Hong Kong Export and Import Value & Volume, 2023-2030 ($)
Figure 122: Middle East & Africa Particle detector Market Middle East & Africa 3D Printing Market Value & Volume, 2023-2030 ($)
Figure 123: Russia Particle detector Market Value & Volume, 2023-2030 ($)
Figure 124: Russia GDP and Population, 2023-2030 ($)
Figure 125: Russia GDP – Composition of 2023, By Sector of Origin
Figure 126: Russia Export and Import Value & Volume, 2023-2030 ($)
Figure 127: Israel Particle detector Market Value & Volume, 2023-2030 ($)
Figure 128: Israel GDP and Population, 2023-2030 ($)
Figure 129: Israel GDP – Composition of 2023, By Sector of Origin
Figure 130: Israel Export and Import Value & Volume, 2023-2030 ($)
Figure 131: Entropy Share, By Strategies, 2023-2030* (%)Particle detector Market
Figure 132: Developments, 2023-2030*Particle detector Market
Figure 133: Company 1 Particle detector Market Net Revenue, By Years, 2023-2030* ($)
Figure 134: Company 1 Particle detector Market Net Revenue Share, By Business segments, 2023 (%)
Figure 135: Company 1 Particle detector Market Net Sales Share, By Geography, 2023 (%)
Figure 136: Company 2 Particle detector Market Net Revenue, By Years, 2023-2030* ($)
Figure 137: Company 2 Particle detector Market Net Revenue Share, By Business segments, 2023 (%)
Figure 138: Company 2 Particle detector Market Net Sales Share, By Geography, 2023 (%)
Figure 139: Company 3 Particle detector Market Net Revenue, By Years, 2023-2030* ($)
Figure 140: Company 3 Particle detector Market Net Revenue Share, By Business segments, 2023 (%)
Figure 141: Company 3 Particle detector Market Net Sales Share, By Geography, 2023 (%)
Figure 142: Company 4 Particle detector Market Net Revenue, By Years, 2023-2030* ($)
Figure 143: Company 4 Particle detector Market Net Revenue Share, By Business segments, 2023 (%)
Figure 144: Company 4 Particle detector Market Net Sales Share, By Geography, 2023 (%)
Figure 145: Company 5 Particle detector Market Net Revenue, By Years, 2023-2030* ($)
Figure 146: Company 5 Particle detector Market Net Revenue Share, By Business segments, 2023 (%)
Figure 147: Company 5 Particle detector Market Net Sales Share, By Geography, 2023 (%)
Figure 148: Company 6 Particle detector Market Net Revenue, By Years, 2023-2030* ($)
Figure 149: Company 6 Particle detector Market Net Revenue Share, By Business segments, 2023 (%)
Figure 150: Company 6 Particle detector Market Net Sales Share, By Geography, 2023 (%)
Figure 151: Company 7 Particle detector Market Net Revenue, By Years, 2023-2030* ($)
Figure 152: Company 7 Particle detector Market Net Revenue Share, By Business segments, 2023 (%)
Figure 153: Company 7 Particle detector Market Net Sales Share, By Geography, 2023 (%)
Figure 154: Company 8 Particle detector Market Net Revenue, By Years, 2023-2030* ($)
Figure 155: Company 8 Particle detector Market Net Revenue Share, By Business segments, 2023 (%)
Figure 156: Company 8 Particle detector Market Net Sales Share, By Geography, 2023 (%)
Figure 157: Company 9 Particle detector Market Net Revenue, By Years, 2023-2030* ($)
Figure 158: Company 9 Particle detector Market Net Revenue Share, By Business segments, 2023 (%)
Figure 159: Company 9 Particle detector Market Net Sales Share, By Geography, 2023 (%)
Figure 160: Company 10 Particle detector Market Net Revenue, By Years, 2023-2030* ($)
Figure 161: Company 10 Particle detector Market Net Revenue Share, By Business segments, 2023 (%)
Figure 162: Company 10 Particle detector Market Net Sales Share, By Geography, 2023 (%)
Figure 163: Company 11 Particle detector Market Net Revenue, By Years, 2023-2030* ($)
Figure 164: Company 11 Particle detector Market Net Revenue Share, By Business segments, 2023 (%)
Figure 165: Company 11 Particle detector Market Net Sales Share, By Geography, 2023 (%)
Figure 166: Company 12 Particle detector Market Net Revenue, By Years, 2023-2030* ($)
Figure 167: Company 12 Particle detector Market Net Revenue Share, By Business segments, 2023 (%)
Figure 168: Company 12 Particle detector Market Net Sales Share, By Geography, 2023 (%)
Figure 169: Company 13 Particle detector Market Net Revenue, By Years, 2023-2030* ($)
Figure 170: Company 13 Particle detector Market Net Revenue Share, By Business segments, 2023 (%)
Figure 171: Company 13 Particle detector Market Net Sales Share, By Geography, 2023 (%)
Figure 172: Company 14 Particle detector Market Net Revenue, By Years, 2023-2030* ($)
Figure 173: Company 14 Particle detector Market Net Revenue Share, By Business segments, 2023 (%)
Figure 174: Company 14 Particle detector Market Net Sales Share, By Geography, 2023 (%)
Figure 175: Company 15 Particle detector Market Net Revenue, By Years, 2023-2030* ($)
Figure 176: Company 15 Particle detector Market Net Revenue Share, By Business segments, 2023 (%)
Figure 177: Company 15 Particle detector Market Net Sales Share, By Geography, 2023 (%)