 Email
Email Print
Print


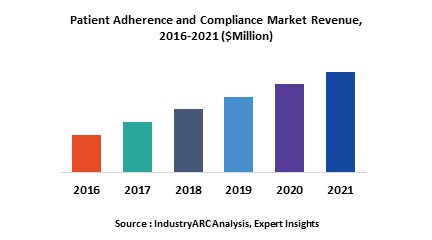
Patient Adherence and Compliance Market - Forecast(2024 - 2030)
According to the World Health Organization, “adherence is defined as the extent to which a person's behavior, that involves, taking medication, following a diet, and/or executing lifestyle changes, corresponds with agreed recommendations from a health care provider.” It essentially refers to the degree to which a patient complies with a treatment regime. Another statistic that the WHO has published is that patient adherence in the case of chronic diseases is as low as 50% in developed countries while it is much lower in developing economies.
Lack of patient adherence and compliance is a major concern for the pharmaceutical companies as it increases the potential need for a higher degree of treatment for patients. This is due to the fact that poor or lack of adherence results in poor health of the patient and in turn results in increased healthcare costs for the healthcare system. It is estimated that about 40% of revenue loss for major pharmaceutical companies is attributed to patient non-adherence and non-compliance. Pharmaceutical companies are investing significantly in order to develop effective solutions to address the growing problem of patient non-adherence and non-compliance.
There are several factors that influence the adherence of patients. Some of these include patient related factors, therapy related factors, disease related factors, cost related factors, factors related to the healthcare system itself, and other socio-economic factors. Patient related factors include the attitude of the patient, the awareness level or lack of it, and misconceptions and perceptions about the disease and its treatment. Cost-related factors are one of the main factors as affordability is a major problem for those without health insurance and also in developing countries.
The patient adherence and compliance market has been segmented as
- on the basis of type
- In-house adherence support and Outsourced adherence support.
- on the basis of technique used
- Clinical innovation, Patient counseling and education, Software Apps and others
North America accounts for the largest share of the overall patient adherence and compliance market. This can be attributed to the developed healthcare system, increasing geriatric population coupled with the increasing cases of chronic illnesses that are prevalent in the region.
- By Geography
- North America, South America, APAC, Europe, Middle East and Africa
Following are just a few of the companies that are operating in the Patient Adherence and Compliance Market
- S3 Group
- Adherence Solutions LLC
- Qualcomm Inc.,
- Koninklijke Philips N.V.
- Adheretech, Inc.
1. Patient Adherence and Compliance Market - Overview
1.1. Definitions and Scope
2. Patient Adherence and Compliance Market - Executive summary
2.1. Market Revenue, Market Size and Key Trends by Company
2.2. Key Trends by type of Application
2.3. Key Trends segmented by Geography
3. Patient Adherence and Compliance Market
3.1. Comparative analysis
3.1.1. Product Benchmarking - Top 10 companies
3.1.2. Top 5 Financials Analysis
3.1.3. Market Value split by Top 10 companies
3.1.4. Patent Analysis - Top 10 companies
3.1.5. Pricing Analysis
4. Patient Adherence and Compliance Market – Startup companies Scenario Premium
4.1. Top 10 startup company Analysis by
4.1.1. Investment
4.1.2. Revenue
4.1.3. Market Shares
4.1.4. Market Size and Application Analysis
4.1.5. Venture Capital and Funding Scenario
5. Patient Adherence and Compliance Market – Industry Market Entry Scenario Premium
5.1. Regulatory Framework Overview
5.2. New Business and Ease of Doing business index
5.3. Case studies of successful ventures
5.4. Customer Analysis – Top 10 companies
6. Patient Adherence and Compliance Market Forces
6.1. Drivers
6.2. Constraints
6.3. Challenges
6.4. Porters five force model
6.4.1. Bargaining power of suppliers
6.4.2. Bargaining powers of customers
6.4.3. Threat of new entrants
6.4.4. Rivalry among existing players
6.4.5. Threat of substitutes
7. Patient Adherence and Compliance Market -Strategic analysis
7.1. Value chain analysis
7.2. Opportunities analysis
7.3. Product life cycle
7.4. Suppliers and distributors Market Share
8. Patient Adherence and Compliance Market – By Type (Market Size -$Million / $Billion)
8.1. Market Size and Market Share Analysis
8.2. Application Revenue and Trend Research
8.3. Product Segment Analysis
8.3.1. In-house adherence support
8.3.2. Outsourced adherence support
8.3.3. Others
9. Patient Adherence and Compliance Market – By Technique (Market Size -$Million / $Billion)
9.1. Clinical innovation
9.2. Patient counseling and education
9.3. Software Apps
9.4. Others
10. Patient Adherence and Compliance - By Geography (Market Size -$Million / $Billion)
10.1. Patient Adherence and Compliance Market - North America Segment Research
10.2. North America Market Research (Million / $Billion)
10.2.1. Segment type Size and Market Size Analysis
10.2.2. Revenue and Trends
10.2.3. Application Revenue and Trends by type of Application
10.2.4. Company Revenue and Product Analysis
10.2.5. North America Product type and Application Market Size
10.2.5.1. U.S.
10.2.5.2. Canada
10.2.5.3. Mexico
10.2.5.4. Rest of North America
10.3. Patient Adherence and Compliance - South America Segment Research
10.4. South America Market Research (Market Size -$Million / $Billion)
10.4.1. Segment type Size and Market Size Analysis
10.4.2. Revenue and Trends
10.4.3. Application Revenue and Trends by type of Application
10.4.4. Company Revenue and Product Analysis
10.4.5. South America Product type and Application Market Size
10.4.5.1. Brazil
10.4.5.2. Venezuela
10.4.5.3. Argentina
10.4.5.4. Ecuador
10.4.5.5. Peru
10.4.5.6. Colombia
10.4.5.7. Costa Rica
10.4.5.8. Rest of South America
10.5. Patient Adherence and Compliance - Europe Segment Research
10.6. Europe Market Research (Market Size -$Million / $Billion)
10.6.1. Segment type Size and Market Size Analysis
10.6.2. Revenue and Trends
10.6.3. Application Revenue and Trends by type of Application
10.6.4. Company Revenue and Product Analysis
10.6.5. Europe Segment Product type and Application Market Size
10.6.5.1. U.K
10.6.5.2. Germany
10.6.5.3. Italy
10.6.5.4. France
10.6.5.5. Netherlands
10.6.5.6. Belgium
10.6.5.7. Spain
10.6.5.8. Denmark
10.6.5.9. Rest of Europe
10.7. Patient Adherence and Compliance – APAC Segment Research
10.8. APAC Market Research (Market Size -$Million / $Billion)
10.8.1. Segment type Size and Market Size Analysis
10.8.2. Revenue and Trends
10.8.3. Application Revenue and Trends by type of Application
10.8.4. Company Revenue and Product Analysis
10.8.5. APAC Segment – Product type and Application Market Size
10.8.5.1. China
10.8.5.2. Australia
10.8.5.3. Japan
10.8.5.4. South Korea
10.8.5.5. India
10.8.5.6. Taiwan
10.8.5.7. Malaysia
11. Patient Adherence and Compliance Market - Entropy
11.1. New product launches
11.2. M&A's, collaborations, JVs and partnerships
12. Patient Adherence and Compliance Market – Industry / Segment Competition landscape Premium
12.1. Market Share Analysis
12.1.1. Market Share by Country- Top companies
12.1.2. Market Share by Region- Top 10 companies
12.1.3. Market Share by type of Application – Top 10 companies
12.1.4. Market Share by type of Product / Product category- Top 10 companies
12.1.5. Market Share at global level- Top 10 companies
12.1.6. Best Practises for companies
13. Patient Adherence and Compliance Market – Key Company List by Country Premium
14. Patient Adherence and Compliance Market Company Analysis
14.1. Market Share, Company Revenue, Products, M&A, Developments
14.2. S3 Group
14.3. Adherence Solutions LLC
14.4. Drfirst
14.5. ProteUs Digital Health Inc.
14.6. HCL Technologies
14.7. Cognizant
14.8. Capgemini
14.9. Smrxt, Inc
14.10. Qualcomm Inc
14.11. Koninklijke Philips N.V
14.12. Adheretech, Inc.
14.13. Company 12
14.14. Company 13
14.15. Company 14 and more
"*Financials would be provided on a best efforts basis for private companies"
15. Patient Adherence and Compliance Market - Appendix
15.1. Abbreviations
15.2. Sources
16. Patient Adherence and Compliance Market - Methodology
16.1. Research Methodology
16.1.1. Company Expert Interviews
16.1.2. Industry Databases
16.1.3. Associations
16.1.4. Company News
16.1.5. Company Annual Reports
16.1.6. Application Trends
16.1.7. New Products and Product database
16.1.8. Company Transcripts
16.1.9. R&D Trends
16.1.10. Key Opinion Leaders Interviews
16.1.11. Supply and Demand Trends
List of Tables:
Table1: Patient Adherence and Compliance Market Overview 2023-2030
Table2: Patient Adherence and Compliance Market Leader Analysis 2023-2030 (US$)
Table3: Patient Adherence and Compliance Market Product Analysis 2023-2030 (US$)
Table4: Patient Adherence and Compliance Market End User Analysis 2023-2030 (US$)
Table5: Patient Adherence and Compliance Market Patent Analysis 2013-2023* (US$)
Table6: Patient Adherence and Compliance Market Financial Analysis 2023-2030 (US$)
Table7: Patient Adherence and Compliance Market Driver Analysis 2023-2030 (US$)
Table8: Patient Adherence and Compliance Market Challenges Analysis 2023-2030 (US$)
Table9: Patient Adherence and Compliance Market Constraint Analysis 2023-2030 (US$)
Table10: Patient Adherence and Compliance Market Supplier Bargaining Power Analysis 2023-2030 (US$)
Table11: Patient Adherence and Compliance Market Buyer Bargaining Power Analysis 2023-2030 (US$)
Table12: Patient Adherence and Compliance Market Threat of Substitutes Analysis 2023-2030 (US$)
Table13: Patient Adherence and Compliance Market Threat of New Entrants Analysis 2023-2030 (US$)
Table14: Patient Adherence and Compliance Market Degree of Competition Analysis 2023-2030 (US$)
Table15: Patient Adherence and Compliance Market Value Chain Analysis 2023-2030 (US$)
Table16: Patient Adherence and Compliance Market Pricing Analysis 2023-2030 (US$)
Table17: Patient Adherence and Compliance Market Opportunities Analysis 2023-2030 (US$)
Table18: Patient Adherence and Compliance Market Product Life Cycle Analysis 2023-2030 (US$)
Table19: Patient Adherence and Compliance Market Supplier Analysis 2023-2030 (US$)
Table20: Patient Adherence and Compliance Market Distributor Analysis 2023-2030 (US$)
Table21: Patient Adherence and Compliance Market Trend Analysis 2023-2030 (US$)
Table22: Patient Adherence and Compliance Market Size 2023 (US$)
Table23: Patient Adherence and Compliance Market Forecast Analysis 2023-2030 (US$)
Table24: Patient Adherence and Compliance Market Sales Forecast Analysis 2023-2030 (Units)
Table25: Patient Adherence and Compliance Market, Revenue & Volume, By Type, 2023-2030 ($)
Table26: Patient Adherence and Compliance Market By Type, Revenue & Volume, In-house adherence support, 2023-2030 ($)
Table27: Patient Adherence and Compliance Market By Type, Revenue & Volume, Outsourced adherence support, 2023-2030 ($)
Table28: Patient Adherence and Compliance Market, Revenue & Volume, By Technology, 2023-2030 ($)
Table29: Patient Adherence and Compliance Market By Technology, Revenue & Volume, Clinical innovation, 2023-2030 ($)
Table30: Patient Adherence and Compliance Market By Technology, Revenue & Volume, Patient counseling and education, 2023-2030 ($)
Table31: Patient Adherence and Compliance Market By Technology, Revenue & Volume, Software Apps, 2023-2030 ($)
Table32: North America Patient Adherence and Compliance Market, Revenue & Volume, By Type, 2023-2030 ($)
Table33: North America Patient Adherence and Compliance Market, Revenue & Volume, By Technology, 2023-2030 ($)
Table34: South america Patient Adherence and Compliance Market, Revenue & Volume, By Type, 2023-2030 ($)
Table35: South america Patient Adherence and Compliance Market, Revenue & Volume, By Technology, 2023-2030 ($)
Table36: Europe Patient Adherence and Compliance Market, Revenue & Volume, By Type, 2023-2030 ($)
Table37: Europe Patient Adherence and Compliance Market, Revenue & Volume, By Technology, 2023-2030 ($)
Table38: APAC Patient Adherence and Compliance Market, Revenue & Volume, By Type, 2023-2030 ($)
Table39: APAC Patient Adherence and Compliance Market, Revenue & Volume, By Technology, 2023-2030 ($)
Table40: Middle East & Africa Patient Adherence and Compliance Market, Revenue & Volume, By Type, 2023-2030 ($)
Table41: Middle East & Africa Patient Adherence and Compliance Market, Revenue & Volume, By Technology, 2023-2030 ($)
Table42: Russia Patient Adherence and Compliance Market, Revenue & Volume, By Type, 2023-2030 ($)
Table43: Russia Patient Adherence and Compliance Market, Revenue & Volume, By Technology, 2023-2030 ($)
Table44: Israel Patient Adherence and Compliance Market, Revenue & Volume, By Type, 2023-2030 ($)
Table45: Israel Patient Adherence and Compliance Market, Revenue & Volume, By Technology, 2023-2030 ($)
Table46: Top Companies 2023 (US$)Patient Adherence and Compliance Market, Revenue & Volume
Table47: Product Launch 2023-2030Patient Adherence and Compliance Market, Revenue & Volume
Table48: Mergers & Acquistions 2023-2030Patient Adherence and Compliance Market, Revenue & Volume
List of Figures:
Figure 1: Overview of Patient Adherence and Compliance Market 2023-2030
Figure 2: Market Share Analysis for Patient Adherence and Compliance Market 2023 (US$)
Figure 3: Product Comparison in Patient Adherence and Compliance Market 2023-2030 (US$)
Figure 4: End User Profile for Patient Adherence and Compliance Market 2023-2030 (US$)
Figure 5: Patent Application and Grant in Patient Adherence and Compliance Market 2013-2023* (US$)
Figure 6: Top 5 Companies Financial Analysis in Patient Adherence and Compliance Market 2023-2030 (US$)
Figure 7: Market Entry Strategy in Patient Adherence and Compliance Market 2023-2030
Figure 8: Ecosystem Analysis in Patient Adherence and Compliance Market 2023
Figure 9: Average Selling Price in Patient Adherence and Compliance Market 2023-2030
Figure 10: Top Opportunites in Patient Adherence and Compliance Market 2023-2030
Figure 11: Market Life Cycle Analysis in Patient Adherence and Compliance Market
Figure 12: GlobalBy TypePatient Adherence and Compliance Market Revenue, 2023-2030 ($)
Figure 13: GlobalBy TechnologyPatient Adherence and Compliance Market Revenue, 2023-2030 ($)
Figure 14: Global Patient Adherence and Compliance Market - By Geography
Figure 15: Global Patient Adherence and Compliance Market Value & Volume, By Geography, 2023-2030 ($)
Figure 16: Global Patient Adherence and Compliance Market CAGR, By Geography, 2023-2030 (%)
Figure 17: North America Patient Adherence and Compliance Market Value & Volume, 2023-2030 ($)
Figure 18: US Patient Adherence and Compliance Market Value & Volume, 2023-2030 ($)
Figure 19: US GDP and Population, 2023-2030 ($)
Figure 20: US GDP – Composition of 2023, By Sector of Origin
Figure 21: US Export and Import Value & Volume, 2023-2030 ($)
Figure 22: Canada Patient Adherence and Compliance Market Value & Volume, 2023-2030 ($)
Figure 23: Canada GDP and Population, 2023-2030 ($)
Figure 24: Canada GDP – Composition of 2023, By Sector of Origin
Figure 25: Canada Export and Import Value & Volume, 2023-2030 ($)
Figure 26: Mexico Patient Adherence and Compliance Market Value & Volume, 2023-2030 ($)
Figure 27: Mexico GDP and Population, 2023-2030 ($)
Figure 28: Mexico GDP – Composition of 2023, By Sector of Origin
Figure 29: Mexico Export and Import Value & Volume, 2023-2030 ($)
Figure 30: South America Patient Adherence and Compliance Market Value & Volume, 2023-2030 ($)
Figure 31: Brazil Patient Adherence and Compliance Market Value & Volume, 2023-2030 ($)
Figure 32: Brazil GDP and Population, 2023-2030 ($)
Figure 33: Brazil GDP – Composition of 2023, By Sector of Origin
Figure 34: Brazil Export and Import Value & Volume, 2023-2030 ($)
Figure 35: Venezuela Patient Adherence and Compliance Market Value & Volume, 2023-2030 ($)
Figure 36: Venezuela GDP and Population, 2023-2030 ($)
Figure 37: Venezuela GDP – Composition of 2023, By Sector of Origin
Figure 38: Venezuela Export and Import Value & Volume, 2023-2030 ($)
Figure 39: Argentina Patient Adherence and Compliance Market Value & Volume, 2023-2030 ($)
Figure 40: Argentina GDP and Population, 2023-2030 ($)
Figure 41: Argentina GDP – Composition of 2023, By Sector of Origin
Figure 42: Argentina Export and Import Value & Volume, 2023-2030 ($)
Figure 43: Ecuador Patient Adherence and Compliance Market Value & Volume, 2023-2030 ($)
Figure 44: Ecuador GDP and Population, 2023-2030 ($)
Figure 45: Ecuador GDP – Composition of 2023, By Sector of Origin
Figure 46: Ecuador Export and Import Value & Volume, 2023-2030 ($)
Figure 47: Peru Patient Adherence and Compliance Market Value & Volume, 2023-2030 ($)
Figure 48: Peru GDP and Population, 2023-2030 ($)
Figure 49: Peru GDP – Composition of 2023, By Sector of Origin
Figure 50: Peru Export and Import Value & Volume, 2023-2030 ($)
Figure 51: Colombia Patient Adherence and Compliance Market Value & Volume, 2023-2030 ($)
Figure 52: Colombia GDP and Population, 2023-2030 ($)
Figure 53: Colombia GDP – Composition of 2023, By Sector of Origin
Figure 54: Colombia Export and Import Value & Volume, 2023-2030 ($)
Figure 55: Costa Rica Patient Adherence and Compliance Market Value & Volume, 2023-2030 ($)
Figure 56: Costa Rica GDP and Population, 2023-2030 ($)
Figure 57: Costa Rica GDP – Composition of 2023, By Sector of Origin
Figure 58: Costa Rica Export and Import Value & Volume, 2023-2030 ($)
Figure 59: Europe Patient Adherence and Compliance Market Value & Volume, 2023-2030 ($)
Figure 60: U.K Patient Adherence and Compliance Market Value & Volume, 2023-2030 ($)
Figure 61: U.K GDP and Population, 2023-2030 ($)
Figure 62: U.K GDP – Composition of 2023, By Sector of Origin
Figure 63: U.K Export and Import Value & Volume, 2023-2030 ($)
Figure 64: Germany Patient Adherence and Compliance Market Value & Volume, 2023-2030 ($)
Figure 65: Germany GDP and Population, 2023-2030 ($)
Figure 66: Germany GDP – Composition of 2023, By Sector of Origin
Figure 67: Germany Export and Import Value & Volume, 2023-2030 ($)
Figure 68: Italy Patient Adherence and Compliance Market Value & Volume, 2023-2030 ($)
Figure 69: Italy GDP and Population, 2023-2030 ($)
Figure 70: Italy GDP – Composition of 2023, By Sector of Origin
Figure 71: Italy Export and Import Value & Volume, 2023-2030 ($)
Figure 72: France Patient Adherence and Compliance Market Value & Volume, 2023-2030 ($)
Figure 73: France GDP and Population, 2023-2030 ($)
Figure 74: France GDP – Composition of 2023, By Sector of Origin
Figure 75: France Export and Import Value & Volume, 2023-2030 ($)
Figure 76: Netherlands Patient Adherence and Compliance Market Value & Volume, 2023-2030 ($)
Figure 77: Netherlands GDP and Population, 2023-2030 ($)
Figure 78: Netherlands GDP – Composition of 2023, By Sector of Origin
Figure 79: Netherlands Export and Import Value & Volume, 2023-2030 ($)
Figure 80: Belgium Patient Adherence and Compliance Market Value & Volume, 2023-2030 ($)
Figure 81: Belgium GDP and Population, 2023-2030 ($)
Figure 82: Belgium GDP – Composition of 2023, By Sector of Origin
Figure 83: Belgium Export and Import Value & Volume, 2023-2030 ($)
Figure 84: Spain Patient Adherence and Compliance Market Value & Volume, 2023-2030 ($)
Figure 85: Spain GDP and Population, 2023-2030 ($)
Figure 86: Spain GDP – Composition of 2023, By Sector of Origin
Figure 87: Spain Export and Import Value & Volume, 2023-2030 ($)
Figure 88: Denmark Patient Adherence and Compliance Market Value & Volume, 2023-2030 ($)
Figure 89: Denmark GDP and Population, 2023-2030 ($)
Figure 90: Denmark GDP – Composition of 2023, By Sector of Origin
Figure 91: Denmark Export and Import Value & Volume, 2023-2030 ($)
Figure 92: APAC Patient Adherence and Compliance Market Value & Volume, 2023-2030 ($)
Figure 93: China Patient Adherence and Compliance Market Value & Volume, 2023-2030
Figure 94: China GDP and Population, 2023-2030 ($)
Figure 95: China GDP – Composition of 2023, By Sector of Origin
Figure 96: China Export and Import Value & Volume, 2023-2030 ($)Patient Adherence and Compliance Market China Export and Import Value & Volume, 2023-2030 ($)
Figure 97: Australia Patient Adherence and Compliance Market Value & Volume, 2023-2030 ($)
Figure 98: Australia GDP and Population, 2023-2030 ($)
Figure 99: Australia GDP – Composition of 2023, By Sector of Origin
Figure 100: Australia Export and Import Value & Volume, 2023-2030 ($)
Figure 101: South Korea Patient Adherence and Compliance Market Value & Volume, 2023-2030 ($)
Figure 102: South Korea GDP and Population, 2023-2030 ($)
Figure 103: South Korea GDP – Composition of 2023, By Sector of Origin
Figure 104: South Korea Export and Import Value & Volume, 2023-2030 ($)
Figure 105: India Patient Adherence and Compliance Market Value & Volume, 2023-2030 ($)
Figure 106: India GDP and Population, 2023-2030 ($)
Figure 107: India GDP – Composition of 2023, By Sector of Origin
Figure 108: India Export and Import Value & Volume, 2023-2030 ($)
Figure 109: Taiwan Patient Adherence and Compliance Market Value & Volume, 2023-2030 ($)
Figure 110: Taiwan GDP and Population, 2023-2030 ($)
Figure 111: Taiwan GDP – Composition of 2023, By Sector of Origin
Figure 112: Taiwan Export and Import Value & Volume, 2023-2030 ($)
Figure 113: Malaysia Patient Adherence and Compliance Market Value & Volume, 2023-2030 ($)
Figure 114: Malaysia GDP and Population, 2023-2030 ($)
Figure 115: Malaysia GDP – Composition of 2023, By Sector of Origin
Figure 116: Malaysia Export and Import Value & Volume, 2023-2030 ($)
Figure 117: Hong Kong Patient Adherence and Compliance Market Value & Volume, 2023-2030 ($)
Figure 118: Hong Kong GDP and Population, 2023-2030 ($)
Figure 119: Hong Kong GDP – Composition of 2023, By Sector of Origin
Figure 120: Hong Kong Export and Import Value & Volume, 2023-2030 ($)
Figure 121: Middle East & Africa Patient Adherence and Compliance Market Middle East & Africa 3D Printing Market Value & Volume, 2023-2030 ($)
Figure 122: Russia Patient Adherence and Compliance Market Value & Volume, 2023-2030 ($)
Figure 123: Russia GDP and Population, 2023-2030 ($)
Figure 124: Russia GDP – Composition of 2023, By Sector of Origin
Figure 125: Russia Export and Import Value & Volume, 2023-2030 ($)
Figure 126: Israel Patient Adherence and Compliance Market Value & Volume, 2023-2030 ($)
Figure 127: Israel GDP and Population, 2023-2030 ($)
Figure 128: Israel GDP – Composition of 2023, By Sector of Origin
Figure 129: Israel Export and Import Value & Volume, 2023-2030 ($)
Figure 130: Entropy Share, By Strategies, 2023-2030* (%)Patient Adherence and Compliance Market
Figure 131: Developments, 2023-2030*Patient Adherence and Compliance Market
Figure 132: Company 1 Patient Adherence and Compliance Market Net Revenue, By Years, 2023-2030* ($)
Figure 133: Company 1 Patient Adherence and Compliance Market Net Revenue Share, By Business segments, 2023 (%)
Figure 134: Company 1 Patient Adherence and Compliance Market Net Sales Share, By Geography, 2023 (%)
Figure 135: Company 2 Patient Adherence and Compliance Market Net Revenue, By Years, 2023-2030* ($)
Figure 136: Company 2 Patient Adherence and Compliance Market Net Revenue Share, By Business segments, 2023 (%)
Figure 137: Company 2 Patient Adherence and Compliance Market Net Sales Share, By Geography, 2023 (%)
Figure 138: Company 3 Patient Adherence and Compliance Market Net Revenue, By Years, 2023-2030* ($)
Figure 139: Company 3 Patient Adherence and Compliance Market Net Revenue Share, By Business segments, 2023 (%)
Figure 140: Company 3 Patient Adherence and Compliance Market Net Sales Share, By Geography, 2023 (%)
Figure 141: Company 4 Patient Adherence and Compliance Market Net Revenue, By Years, 2023-2030* ($)
Figure 142: Company 4 Patient Adherence and Compliance Market Net Revenue Share, By Business segments, 2023 (%)
Figure 143: Company 4 Patient Adherence and Compliance Market Net Sales Share, By Geography, 2023 (%)
Figure 144: Company 5 Patient Adherence and Compliance Market Net Revenue, By Years, 2023-2030* ($)
Figure 145: Company 5 Patient Adherence and Compliance Market Net Revenue Share, By Business segments, 2023 (%)
Figure 146: Company 5 Patient Adherence and Compliance Market Net Sales Share, By Geography, 2023 (%)
Figure 147: Company 6 Patient Adherence and Compliance Market Net Revenue, By Years, 2023-2030* ($)
Figure 148: Company 6 Patient Adherence and Compliance Market Net Revenue Share, By Business segments, 2023 (%)
Figure 149: Company 6 Patient Adherence and Compliance Market Net Sales Share, By Geography, 2023 (%)
Figure 150: Company 7 Patient Adherence and Compliance Market Net Revenue, By Years, 2023-2030* ($)
Figure 151: Company 7 Patient Adherence and Compliance Market Net Revenue Share, By Business segments, 2023 (%)
Figure 152: Company 7 Patient Adherence and Compliance Market Net Sales Share, By Geography, 2023 (%)
Figure 153: Company 8 Patient Adherence and Compliance Market Net Revenue, By Years, 2023-2030* ($)
Figure 154: Company 8 Patient Adherence and Compliance Market Net Revenue Share, By Business segments, 2023 (%)
Figure 155: Company 8 Patient Adherence and Compliance Market Net Sales Share, By Geography, 2023 (%)
Figure 156: Company 9 Patient Adherence and Compliance Market Net Revenue, By Years, 2023-2030* ($)
Figure 157: Company 9 Patient Adherence and Compliance Market Net Revenue Share, By Business segments, 2023 (%)
Figure 158: Company 9 Patient Adherence and Compliance Market Net Sales Share, By Geography, 2023 (%)
Figure 159: Company 10 Patient Adherence and Compliance Market Net Revenue, By Years, 2023-2030* ($)
Figure 160: Company 10 Patient Adherence and Compliance Market Net Revenue Share, By Business segments, 2023 (%)
Figure 161: Company 10 Patient Adherence and Compliance Market Net Sales Share, By Geography, 2023 (%)
Figure 162: Company 11 Patient Adherence and Compliance Market Net Revenue, By Years, 2023-2030* ($)
Figure 163: Company 11 Patient Adherence and Compliance Market Net Revenue Share, By Business segments, 2023 (%)
Figure 164: Company 11 Patient Adherence and Compliance Market Net Sales Share, By Geography, 2023 (%)
Figure 165: Company 12 Patient Adherence and Compliance Market Net Revenue, By Years, 2023-2030* ($)
Figure 166: Company 12 Patient Adherence and Compliance Market Net Revenue Share, By Business segments, 2023 (%)
Figure 167: Company 12 Patient Adherence and Compliance Market Net Sales Share, By Geography, 2023 (%)
Figure 168: Company 13 Patient Adherence and Compliance Market Net Revenue, By Years, 2023-2030* ($)
Figure 169: Company 13 Patient Adherence and Compliance Market Net Revenue Share, By Business segments, 2023 (%)
Figure 170: Company 13 Patient Adherence and Compliance Market Net Sales Share, By Geography, 2023 (%)
Figure 171: Company 14 Patient Adherence and Compliance Market Net Revenue, By Years, 2023-2030* ($)
Figure 172: Company 14 Patient Adherence and Compliance Market Net Revenue Share, By Business segments, 2023 (%)
Figure 173: Company 14 Patient Adherence and Compliance Market Net Sales Share, By Geography, 2023 (%)
Figure 174: Company 15 Patient Adherence and Compliance Market Net Revenue, By Years, 2023-2030* ($)
Figure 175: Company 15 Patient Adherence and Compliance Market Net Revenue Share, By Business segments, 2023 (%)
Figure 176: Company 15 Patient Adherence and Compliance Market Net Sales Share, By Geography, 2023 (%)