 Email
Email Print
Print


Power Line Communication (PLC) Systems Market - Forecast(2024 - 2030)
Global Power Line Communication (PLC) Systems Market Outlook
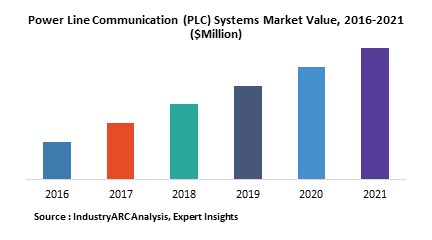
Growing deployment of smart grids, and the emerging use of bidirectional communication technology in power lines is surging the growth of the global power line communication systems market. As per our recent business intelligence report, the global power line communication systems market size was approximately $6.0 billion to $6.5 billion as of 2018, and the market demand is projected to increment at a robust CAGR of 12% to 15% over the forecast period of 2019 to 2025.
PLC is a technology which is used for the transmission of data through electric power transmission cables. PLC systems are widely preferred over wireless and home networking technologies because of their attributes which includes easy installation, availability of alternate current outlets, higher throughput, security, and low cost. These systems are used for the delivery of xDSL and broadband internet services along with the electricity to the consumers.
PLC is an optimal solution for smart grid (SG) applications. PLC systems deployed in the smart grids are used to provide two way communication in the grids. With the integration of sensors, meters and actuators in the grid, the signaling takes place over a narrow frequency band (NB), which is based on low data rate techniques. In smart metering and home energy management systems, both broadband and narrowband standards of PLC systems are largely deployed which in turn growing the demand for smart grids in PLC system market.
Europe holds the largest share of the Power Line Communication Systems Market According to IndustryARC market analysis, Europe held the largest demand share of more than 28% to 32% of the overall demand as of 2018. The use of broadband power line communication systems such as last mile systems in Europe is more developed than the other regions. Application-wise, industries are the key in the PLC systems market, and the demand for this segment is projected to increment at a CAGR of about 8% to 10% over the forecast period of 2019-2025.
To monitor and control production processes and building systems, they are used in industries. PLC is commonly used in civil applications which includes washing machines and for controlling traffic signals and elevators. The increasing demand for broadband power line communication devices in the indoor networking application is also driving growth for the PLC systems market. However, electric noise generation is a major concern that affects the PLC performance coupled with various restrictions on frequency bands limit data rates acting as a restraint to its large scale adoption.
Power Line Communication (PLC) Systems Market: Competitive Landscape
Some of the major players operating in the power line communication systems market are Broadcom Corporation, Maxim Integrated, Cypress Semiconductor, STMicroelectronics, Microchip, Texas Instruments, Echelon Corporation, Megachips Corp, Qualcomm, and NXP Semiconductors.
Texas Instruments –
- Texas Instruments is a global semiconductor design and manufacturing company with 80000+ analog ICs, embedded processors, software, and largest sales or support staff.
- Texas offers various kinds of power line communication winning products such as TMS320F28069, AFE031, TPS3828-33, and TPS62240. These products provide the elasticity of a single hardware and software design that can support multiple standards in a single global platform.
- Its AFE031 is an integrated, low cost, power line communication product which supports analog front end device. It is used in various applications such as eMetering, lighting, solar, and pilot wire.
Power line communication (PLC) is a technology which is used for the transmission of data through electric power transmission cables. Growing deployment of smart grids is foreseen to create new revenue avenues for the players operating in the power line communication systems market during the forecast period 2019 to 2025.
Power Line Communication Market Research Scope:
The base year of the study is 2017, with forecast done up to 2023. The study presents a thorough analysis of the competitive landscape, taking into account the market shares of the leading companies. It also provides information on unit shipments. These provide the key market participants with the necessary business intelligence and help them understand the future of the PLC market. The assessment includes the forecast, an overview of the competitive structure, the market shares of the competitors, as well as the market trends, market demands, market drivers, market challenges, and product analysis. The market drivers and restraints have been assessed to fathom their impact over the forecast period. This report further identifies the key opportunities for growth while also detailing the key challenges and possible threats.
The power line communication market report also analyzes the major geographic regions for the market as well as the major countries for the market in these regions. The regions and countries covered in the study include:
- North America: The U.S., Canada, Mexico
- South America: Brazil, Venezuela, Argentina, Ecuador, Peru, Colombia, Costa Rica
- Europe: The U.K., Germany, Italy, France, The Netherlands, Belgium, Spain, Denmark
- APAC: China, Japan, Australia, South Korea, India, Taiwan, Malaysia, Hong Kong
- Middle East and Africa: Israel, South Africa, Saudi Arabia
1. Power Line Communication (PLC) Systems Market– Market Overview
2. Executive Summary
3. Power Line Communication (PLC) Systems Market– Market Landscape
3.1. Market Share Analysis
3.2. Comparative Analysis
3.2.1. Product Benchmarking
3.2.2. End User Profiling
3.2.3. Top 5 Financials Analysis
4. Power Line Communication (PLC) Systems Market– Market Forces
4.1. Market Drivers
4.2. Market Constraints
4.3. Market Challenges
4.4. Attractiveness of the Power Line Communication (PLC) Systems Market
4.4.1. Power of Suppliers
4.4.2. Power of Customers
4.4.3. Threat of New Entrants
4.4.4. Threat of Substitution
4.4.5. Degree of Competition
5. Power Line Communication (PLC) Systems Market– Strategic Analysis
5.1. Value Chain Analysis
5.2. Pricing Analysis
5.3. Opportunities Analysis
5.4. Product/Market Life Cycle Analysis
5.5. Suppliers and Distributors
6. Power Line Communication (PLC) Systems Market– By Frequency
6.1. Narrowband
6.2. Broadband
7. Power Line Communication (PLC) Systems Market– By Application
7.1. Smart Grids
7.2. Networking
7.3. Long-haul
8. Power Line Communication (PLC) Systems Market– By Industry
8.1. Residential
8.2. Commercial
8.3. Automotive
8.4. Healthcare
8.5. Telecommunication
8.6. Industrial
9. Power Line Communication (PLC) Systems Market– By Component
9.1. Line Trap Units
9.2. Coupling Capacitors
9.3. Line Units
9.4. Transmitters
9.5. Receivers
10. Power Line Communication (PLC) Systems Market– By Voltage
10.1. Low
10.2. Medium
10.3. High
11. Power Line Communication (PLC) Systems Market– By Modulation
11.1. Single
11.2. Multi
11.3. Spread Spectrum
12. Power Line Communication (PLC) Systems Market– By Geography
12.1. Introduction
12.2. Global Study
12.3. Americas
12.3.1. North America
12.3.2. Brazil
12.3.3. Argentina
12.3.4. Others
12.4. Europe
12.4.1. U.K.
12.4.2. France
12.4.3. Germany
12.4.4. Others
12.5. APAC
12.5.1. China
12.5.2. Japan
12.5.3. India
12.5.4. Others
12.6. ROW
13. Market Entropy
13.1. New Product Launches
13.2. M&As, Collaborations, JVs and Partnerships
14. Company Profiles
14.1. Company 1
14.2. Company 2
14.3. Company 3
14.4. Company 4
14.5. Company 5
14.6. Company 6
14.7. Company 7
14.8. Company 8
14.9. Company 9
14.10. Company 10
*More than 10 Companies are profiled in this Research Report*
"*Financials would be provided on a best efforts basis for private companies"
15. Appendix
15.1. Abbreviations
15.2. Sources
15.3. Research Methodology
15.4. Bibliography
15.5. Compilation of Expert Insights
15.6. Disclaimer
List of Tables:
Table 1: Power Line Communication (PLC) Systems Market Overview 2023-2030
Table 2: Power Line Communication (PLC) Systems Market Leader Analysis 2023-2030 (US$)
Table 3: Power Line Communication (PLC) Systems Market Product Analysis 2023-2030 (US$)
Table 4: Power Line Communication (PLC) Systems Market End User Analysis 2023-2030 (US$)
Table 5: Power Line Communication (PLC) Systems Market Patent Analysis 2013-2023* (US$)
Table 6: Power Line Communication (PLC) Systems Market Financial Analysis 2023-2030 (US$)
Table 7: Power Line Communication (PLC) Systems Market Driver Analysis 2023-2030 (US$)
Table 8: Power Line Communication (PLC) Systems Market Challenges Analysis 2023-2030 (US$)
Table 9: Power Line Communication (PLC) Systems Market Constraint Analysis 2023-2030 (US$)
Table 10: Power Line Communication (PLC) Systems Market Supplier Bargaining Power Analysis 2023-2030 (US$)
Table 11: Power Line Communication (PLC) Systems Market Buyer Bargaining Power Analysis 2023-2030 (US$)
Table 12: Power Line Communication (PLC) Systems Market Threat of Substitutes Analysis 2023-2030 (US$)
Table 13: Power Line Communication (PLC) Systems Market Threat of New Entrants Analysis 2023-2030 (US$)
Table 14: Power Line Communication (PLC) Systems Market Degree of Competition Analysis 2023-2030 (US$)
Table 15: Power Line Communication (PLC) Systems Market Value Chain Analysis 2023-2030 (US$)
Table 16: Power Line Communication (PLC) Systems Market Pricing Analysis 2023-2030 (US$)
Table 17: Power Line Communication (PLC) Systems Market Opportunities Analysis 2023-2030 (US$)
Table 18: Power Line Communication (PLC) Systems Market Product Life Cycle Analysis 2023-2030 (US$)
Table 19: Power Line Communication (PLC) Systems Market Supplier Analysis 2023-2030 (US$)
Table 20: Power Line Communication (PLC) Systems Market Distributor Analysis 2023-2030 (US$)
Table 21: Power Line Communication (PLC) Systems Market Trend Analysis 2023-2030 (US$)
Table 22: Power Line Communication (PLC) Systems Market Size 2023 (US$)
Table 23: Power Line Communication (PLC) Systems Market Forecast Analysis 2023-2030 (US$)
Table 24: Power Line Communication (PLC) Systems Market Sales Forecast Analysis 2023-2030 (Units)
Table 25: Power Line Communication (PLC) Systems Market, Revenue & Volume, By Frequency, 2023-2030 ($)
Table 26: Power Line Communication (PLC) Systems Market By Frequency, Revenue & Volume, By Narrowband, 2023-2030 ($)
Table 27: Power Line Communication (PLC) Systems Market By Frequency, Revenue & Volume, By Broadband, 2023-2030 ($)
Table 28: Power Line Communication (PLC) Systems Market, Revenue & Volume, By Component, 2023-2030 ($)
Table 29: Power Line Communication (PLC) Systems Market By Component, Revenue & Volume, By Line Trap Units, 2023-2030 ($)
Table 30: Power Line Communication (PLC) Systems Market By Component, Revenue & Volume, By Coupling Capacitors, 2023-2030 ($)
Table 31: Power Line Communication (PLC) Systems Market By Component, Revenue & Volume, By Line Units, 2023-2030 ($)
Table 32: Power Line Communication (PLC) Systems Market By Component, Revenue & Volume, By Transmitters, 2023-2030 ($)
Table 33: Power Line Communication (PLC) Systems Market By Component, Revenue & Volume, By Receivers, 2023-2030 ($)
Table 34: Power Line Communication (PLC) Systems Market, Revenue & Volume, By Voltage, 2023-2030 ($)
Table 35: Power Line Communication (PLC) Systems Market By Voltage, Revenue & Volume, By Low, 2023-2030 ($)
Table 36: Power Line Communication (PLC) Systems Market By Voltage, Revenue & Volume, By Medium, 2023-2030 ($)
Table 37: Power Line Communication (PLC) Systems Market By Voltage, Revenue & Volume, By High, 2023-2030 ($)
Table 38: Power Line Communication (PLC) Systems Market, Revenue & Volume, By Application, 2023-2030 ($)
Table 39: Power Line Communication (PLC) Systems Market By Application, Revenue & Volume, By Smart Grids, 2023-2030 ($)
Table 40: Power Line Communication (PLC) Systems Market By Application, Revenue & Volume, By Networking, 2023-2030 ($)
Table 41: Power Line Communication (PLC) Systems Market By Application, Revenue & Volume, By Long-haul, 2023-2030 ($)
Table 42: Power Line Communication (PLC) Systems Market, Revenue & Volume, By Industry, 2023-2030 ($)
Table 43: Power Line Communication (PLC) Systems Market By Industry, Revenue & Volume, By Residential, 2023-2030 ($)
Table 44: Power Line Communication (PLC) Systems Market By Industry, Revenue & Volume, By Commercial, 2023-2030 ($)
Table 45: Power Line Communication (PLC) Systems Market By Industry, Revenue & Volume, By Automotive, 2023-2030 ($)
Table 46: Power Line Communication (PLC) Systems Market By Industry, Revenue & Volume, By Healthcare, 2023-2030 ($)
Table 47: Power Line Communication (PLC) Systems Market By Industry, Revenue & Volume, By Telecommunication, 2023-2030 ($)
Table 48: North America Power Line Communication (PLC) Systems Market, Revenue & Volume, By Frequency, 2023-2030 ($)
Table 49: North America Power Line Communication (PLC) Systems Market, Revenue & Volume, By Component, 2023-2030 ($)
Table 50: North America Power Line Communication (PLC) Systems Market, Revenue & Volume, By Voltage, 2023-2030 ($)
Table 51: North America Power Line Communication (PLC) Systems Market, Revenue & Volume, By Application, 2023-2030 ($)
Table 52: North America Power Line Communication (PLC) Systems Market, Revenue & Volume, By Industry, 2023-2030 ($)
Table 53: South america Power Line Communication (PLC) Systems Market, Revenue & Volume, By Frequency, 2023-2030 ($)
Table 54: South america Power Line Communication (PLC) Systems Market, Revenue & Volume, By Component, 2023-2030 ($)
Table 55: South america Power Line Communication (PLC) Systems Market, Revenue & Volume, By Voltage, 2023-2030 ($)
Table 56: South america Power Line Communication (PLC) Systems Market, Revenue & Volume, By Application, 2023-2030 ($)
Table 57: South america Power Line Communication (PLC) Systems Market, Revenue & Volume, By Industry, 2023-2030 ($)
Table 58: Europe Power Line Communication (PLC) Systems Market, Revenue & Volume, By Frequency, 2023-2030 ($)
Table 59: Europe Power Line Communication (PLC) Systems Market, Revenue & Volume, By Component, 2023-2030 ($)
Table 60: Europe Power Line Communication (PLC) Systems Market, Revenue & Volume, By Voltage, 2023-2030 ($)
Table 61: Europe Power Line Communication (PLC) Systems Market, Revenue & Volume, By Application, 2023-2030 ($)
Table 62: Europe Power Line Communication (PLC) Systems Market, Revenue & Volume, By Industry, 2023-2030 ($)
Table 63: APAC Power Line Communication (PLC) Systems Market, Revenue & Volume, By Frequency, 2023-2030 ($)
Table 64: APAC Power Line Communication (PLC) Systems Market, Revenue & Volume, By Component, 2023-2030 ($)
Table 65: APAC Power Line Communication (PLC) Systems Market, Revenue & Volume, By Voltage, 2023-2030 ($)
Table 66: APAC Power Line Communication (PLC) Systems Market, Revenue & Volume, By Application, 2023-2030 ($)
Table 67: APAC Power Line Communication (PLC) Systems Market, Revenue & Volume, By Industry, 2023-2030 ($)
Table 68: Middle East & Africa Power Line Communication (PLC) Systems Market, Revenue & Volume, By Frequency, 2023-2030 ($)
Table 69: Middle East & Africa Power Line Communication (PLC) Systems Market, Revenue & Volume, By Component, 2023-2030 ($)
Table 70: Middle East & Africa Power Line Communication (PLC) Systems Market, Revenue & Volume, By Voltage, 2023-2030 ($)
Table 71: Middle East & Africa Power Line Communication (PLC) Systems Market, Revenue & Volume, By Application, 2023-2030 ($)
Table 72: Middle East & Africa Power Line Communication (PLC) Systems Market, Revenue & Volume, By Industry, 2023-2030 ($)
Table 73: Russia Power Line Communication (PLC) Systems Market, Revenue & Volume, By Frequency, 2023-2030 ($)
Table 74: Russia Power Line Communication (PLC) Systems Market, Revenue & Volume, By Component, 2023-2030 ($)
Table 75: Russia Power Line Communication (PLC) Systems Market, Revenue & Volume, By Voltage, 2023-2030 ($)
Table 76: Russia Power Line Communication (PLC) Systems Market, Revenue & Volume, By Application, 2023-2030 ($)
Table 77: Russia Power Line Communication (PLC) Systems Market, Revenue & Volume, By Industry, 2023-2030 ($)
Table 78: Israel Power Line Communication (PLC) Systems Market, Revenue & Volume, By Frequency, 2023-2030 ($)
Table 79: Israel Power Line Communication (PLC) Systems Market, Revenue & Volume, By Component, 2023-2030 ($)
Table 80: Israel Power Line Communication (PLC) Systems Market, Revenue & Volume, By Voltage, 2023-2030 ($)
Table 81: Israel Power Line Communication (PLC) Systems Market, Revenue & Volume, By Application, 2023-2030 ($)
Table 82: Israel Power Line Communication (PLC) Systems Market, Revenue & Volume, By Industry, 2023-2030 ($)
Table 83: Top Companies 2023 (US$) Power Line Communication (PLC) Systems Market, Revenue & Volume
Table 84: Product Launch 2023-2030 Power Line Communication (PLC) Systems Market, Revenue & Volume
Table 85: Mergers & Acquistions 2023-2030 Power Line Communication (PLC) Systems Market, Revenue & Volume
List of Figures:
Figure 1: Overview of Power Line Communication (PLC) Systems Market 2023-2030
Figure 2: Market Share Analysis for Power Line Communication (PLC) Systems Market 2023 (US$)
Figure 3: Product Comparison in Power Line Communication (PLC) Systems Market 2023-2030 (US$)
Figure 4: End User Profile for Power Line Communication (PLC) Systems Market 2023-2030 (US$)
Figure 5: Patent Application and Grant in Power Line Communication (PLC) Systems Market 2013-2023* (US$)
Figure 6: Top 5 Companies Financial Analysis in Power Line Communication (PLC) Systems Market 2023-2030 (US$)
Figure 7: Market Entry Strategy in Power Line Communication (PLC) Systems Market 2023-2030
Figure 8: Ecosystem Analysis in Power Line Communication (PLC) Systems Market 2023
Figure 9: Average Selling Price in Power Line Communication (PLC) Systems Market 2023-2030
Figure 10: Top Opportunites in Power Line Communication (PLC) Systems Market 2023-2030
Figure 11: Market Life Cycle Analysis in Power Line Communication (PLC) Systems Market
Figure 12: GlobalBy Frequency Power Line Communication (PLC) Systems Market Revenue, 2023-2030 ($)
Figure 13: GlobalBy Component Power Line Communication (PLC) Systems Market Revenue, 2023-2030 ($)
Figure 14: GlobalBy Voltage Power Line Communication (PLC) Systems Market Revenue, 2023-2030 ($)
Figure 15: GlobalBy Application Power Line Communication (PLC) Systems Market Revenue, 2023-2030 ($)
Figure 16: GlobalBy Industry Power Line Communication (PLC) Systems Market Revenue, 2023-2030 ($)
Figure 17: Global Power Line Communication (PLC) Systems Market - By Geography
Figure 18: Global Power Line Communication (PLC) Systems Market Value & Volume, By Geography, 2023-2030 ($)
Figure 19: Global Power Line Communication (PLC) Systems Market CAGR, By Geography, 2023-2030 (%)
Figure 20: North America Power Line Communication (PLC) Systems Market Value & Volume, 2023-2030 ($)
Figure 21: US Power Line Communication (PLC) Systems Market Value & Volume, 2023-2030 ($)
Figure 22: US GDP and Population, 2023-2030 ($)
Figure 23: US GDP – Composition of 2023, By Sector of Origin
Figure 24: US Export and Import Value & Volume, 2023-2030 ($)
Figure 25: Canada Power Line Communication (PLC) Systems Market Value & Volume, 2023-2030 ($)
Figure 26: Canada GDP and Population, 2023-2030 ($)
Figure 27: Canada GDP – Composition of 2023, By Sector of Origin
Figure 28: Canada Export and Import Value & Volume, 2023-2030 ($)
Figure 29: Mexico Power Line Communication (PLC) Systems Market Value & Volume, 2023-2030 ($)
Figure 30: Mexico GDP and Population, 2023-2030 ($)
Figure 31: Mexico GDP – Composition of 2023, By Sector of Origin
Figure 32: Mexico Export and Import Value & Volume, 2023-2030 ($)
Figure 33: South America Power Line Communication (PLC) Systems Market Value & Volume, 2023-2030 ($)
Figure 34: Brazil Power Line Communication (PLC) Systems Market Value & Volume, 2023-2030 ($)
Figure 35: Brazil GDP and Population, 2023-2030 ($)
Figure 36: Brazil GDP – Composition of 2023, By Sector of Origin
Figure 37: Brazil Export and Import Value & Volume, 2023-2030 ($)
Figure 38: Venezuela Power Line Communication (PLC) Systems Market Value & Volume, 2023-2030 ($)
Figure 39: Venezuela GDP and Population, 2023-2030 ($)
Figure 40: Venezuela GDP – Composition of 2023, By Sector of Origin
Figure 41: Venezuela Export and Import Value & Volume, 2023-2030 ($)
Figure 42: Argentina Power Line Communication (PLC) Systems Market Value & Volume, 2023-2030 ($)
Figure 43: Argentina GDP and Population, 2023-2030 ($)
Figure 44: Argentina GDP – Composition of 2023, By Sector of Origin
Figure 45: Argentina Export and Import Value & Volume, 2023-2030 ($)
Figure 46: Ecuador Power Line Communication (PLC) Systems Market Value & Volume, 2023-2030 ($)
Figure 47: Ecuador GDP and Population, 2023-2030 ($)
Figure 48: Ecuador GDP – Composition of 2023, By Sector of Origin
Figure 49: Ecuador Export and Import Value & Volume, 2023-2030 ($)
Figure 50: Peru Power Line Communication (PLC) Systems Market Value & Volume, 2023-2030 ($)
Figure 51: Peru GDP and Population, 2023-2030 ($)
Figure 52: Peru GDP – Composition of 2023, By Sector of Origin
Figure 53: Peru Export and Import Value & Volume, 2023-2030 ($)
Figure 54: Colombia Power Line Communication (PLC) Systems Market Value & Volume, 2023-2030 ($)
Figure 55: Colombia GDP and Population, 2023-2030 ($)
Figure 56: Colombia GDP – Composition of 2023, By Sector of Origin
Figure 57: Colombia Export and Import Value & Volume, 2023-2030 ($)
Figure 58: Costa Rica Power Line Communication (PLC) Systems Market Value & Volume, 2023-2030 ($)
Figure 59: Costa Rica GDP and Population, 2023-2030 ($)
Figure 60: Costa Rica GDP – Composition of 2023, By Sector of Origin
Figure 61: Costa Rica Export and Import Value & Volume, 2023-2030 ($)
Figure 62: Europe Power Line Communication (PLC) Systems Market Value & Volume, 2023-2030 ($)
Figure 63: U.K Power Line Communication (PLC) Systems Market Value & Volume, 2023-2030 ($)
Figure 64: U.K GDP and Population, 2023-2030 ($)
Figure 65: U.K GDP – Composition of 2023, By Sector of Origin
Figure 66: U.K Export and Import Value & Volume, 2023-2030 ($)
Figure 67: Germany Power Line Communication (PLC) Systems Market Value & Volume, 2023-2030 ($)
Figure 68: Germany GDP and Population, 2023-2030 ($)
Figure 69: Germany GDP – Composition of 2023, By Sector of Origin
Figure 70: Germany Export and Import Value & Volume, 2023-2030 ($)
Figure 71: Italy Power Line Communication (PLC) Systems Market Value & Volume, 2023-2030 ($)
Figure 72: Italy GDP and Population, 2023-2030 ($)
Figure 73: Italy GDP – Composition of 2023, By Sector of Origin
Figure 74: Italy Export and Import Value & Volume, 2023-2030 ($)
Figure 75: France Power Line Communication (PLC) Systems Market Value & Volume, 2023-2030 ($)
Figure 76: France GDP and Population, 2023-2030 ($)
Figure 77: France GDP – Composition of 2023, By Sector of Origin
Figure 78: France Export and Import Value & Volume, 2023-2030 ($)
Figure 79: Netherlands Power Line Communication (PLC) Systems Market Value & Volume, 2023-2030 ($)
Figure 80: Netherlands GDP and Population, 2023-2030 ($)
Figure 81: Netherlands GDP – Composition of 2023, By Sector of Origin
Figure 82: Netherlands Export and Import Value & Volume, 2023-2030 ($)
Figure 83: Belgium Power Line Communication (PLC) Systems Market Value & Volume, 2023-2030 ($)
Figure 84: Belgium GDP and Population, 2023-2030 ($)
Figure 85: Belgium GDP – Composition of 2023, By Sector of Origin
Figure 86: Belgium Export and Import Value & Volume, 2023-2030 ($)
Figure 87: Spain Power Line Communication (PLC) Systems Market Value & Volume, 2023-2030 ($)
Figure 88: Spain GDP and Population, 2023-2030 ($)
Figure 89: Spain GDP – Composition of 2023, By Sector of Origin
Figure 90: Spain Export and Import Value & Volume, 2023-2030 ($)
Figure 91: Denmark Power Line Communication (PLC) Systems Market Value & Volume, 2023-2030 ($)
Figure 92: Denmark GDP and Population, 2023-2030 ($)
Figure 93: Denmark GDP – Composition of 2023, By Sector of Origin
Figure 94: Denmark Export and Import Value & Volume, 2023-2030 ($)
Figure 95: APAC Power Line Communication (PLC) Systems Market Value & Volume, 2023-2030 ($)
Figure 96: China Power Line Communication (PLC) Systems Market Value & Volume, 2023-2030
Figure 97: China GDP and Population, 2023-2030 ($)
Figure 98: China GDP – Composition of 2023, By Sector of Origin
Figure 99: China Export and Import Value & Volume, 2023-2030 ($) Power Line Communication (PLC) Systems Market China Export and Import Value & Volume, 2023-2030 ($)
Figure 100: Australia Power Line Communication (PLC) Systems Market Value & Volume, 2023-2030 ($)
Figure 101: Australia GDP and Population, 2023-2030 ($)
Figure 102: Australia GDP – Composition of 2023, By Sector of Origin
Figure 103: Australia Export and Import Value & Volume, 2023-2030 ($)
Figure 104: South Korea Power Line Communication (PLC) Systems Market Value & Volume, 2023-2030 ($)
Figure 105: South Korea GDP and Population, 2023-2030 ($)
Figure 106: South Korea GDP – Composition of 2023, By Sector of Origin
Figure 107: South Korea Export and Import Value & Volume, 2023-2030 ($)
Figure 108: India Power Line Communication (PLC) Systems Market Value & Volume, 2023-2030 ($)
Figure 109: India GDP and Population, 2023-2030 ($)
Figure 110: India GDP – Composition of 2023, By Sector of Origin
Figure 111: India Export and Import Value & Volume, 2023-2030 ($)
Figure 112: Taiwan Power Line Communication (PLC) Systems Market Value & Volume, 2023-2030 ($)
Figure 113: Taiwan GDP and Population, 2023-2030 ($)
Figure 114: Taiwan GDP – Composition of 2023, By Sector of Origin
Figure 115: Taiwan Export and Import Value & Volume, 2023-2030 ($)
Figure 116: Malaysia Power Line Communication (PLC) Systems Market Value & Volume, 2023-2030 ($)
Figure 117: Malaysia GDP and Population, 2023-2030 ($)
Figure 118: Malaysia GDP – Composition of 2023, By Sector of Origin
Figure 119: Malaysia Export and Import Value & Volume, 2023-2030 ($)
Figure 120: Hong Kong Power Line Communication (PLC) Systems Market Value & Volume, 2023-2030 ($)
Figure 121: Hong Kong GDP and Population, 2023-2030 ($)
Figure 122: Hong Kong GDP – Composition of 2023, By Sector of Origin
Figure 123: Hong Kong Export and Import Value & Volume, 2023-2030 ($)
Figure 124: Middle East & Africa Power Line Communication (PLC) Systems Market Middle East & Africa 3D Printing Market Value & Volume, 2023-2030 ($)
Figure 125: Russia Power Line Communication (PLC) Systems Market Value & Volume, 2023-2030 ($)
Figure 126: Russia GDP and Population, 2023-2030 ($)
Figure 127: Russia GDP – Composition of 2023, By Sector of Origin
Figure 128: Russia Export and Import Value & Volume, 2023-2030 ($)
Figure 129: Israel Power Line Communication (PLC) Systems Market Value & Volume, 2023-2030 ($)
Figure 130: Israel GDP and Population, 2023-2030 ($)
Figure 131: Israel GDP – Composition of 2023, By Sector of Origin
Figure 132: Israel Export and Import Value & Volume, 2023-2030 ($)
Figure 133: Entropy Share, By Strategies, 2023-2030* (%) Power Line Communication (PLC) Systems Market
Figure 134: Developments, 2023-2030* Power Line Communication (PLC) Systems Market
Figure 135: Company 1 Power Line Communication (PLC) Systems Market Net Revenue, By Years, 2023-2030* ($)
Figure 136: Company 1 Power Line Communication (PLC) Systems Market Net Revenue Share, By Business segments, 2023 (%)
Figure 137: Company 1 Power Line Communication (PLC) Systems Market Net Sales Share, By Geography, 2023 (%)
Figure 138: Company 2 Power Line Communication (PLC) Systems Market Net Revenue, By Years, 2023-2030* ($)
Figure 139: Company 2 Power Line Communication (PLC) Systems Market Net Revenue Share, By Business segments, 2023 (%)
Figure 140: Company 2 Power Line Communication (PLC) Systems Market Net Sales Share, By Geography, 2023 (%)
Figure 141: Company 3 Power Line Communication (PLC) Systems Market Net Revenue, By Years, 2023-2030* ($)
Figure 142: Company 3 Power Line Communication (PLC) Systems Market Net Revenue Share, By Business segments, 2023 (%)
Figure 143: Company 3 Power Line Communication (PLC) Systems Market Net Sales Share, By Geography, 2023 (%)
Figure 144: Company 4 Power Line Communication (PLC) Systems Market Net Revenue, By Years, 2023-2030* ($)
Figure 145: Company 4 Power Line Communication (PLC) Systems Market Net Revenue Share, By Business segments, 2023 (%)
Figure 146: Company 4 Power Line Communication (PLC) Systems Market Net Sales Share, By Geography, 2023 (%)
Figure 147: Company 5 Power Line Communication (PLC) Systems Market Net Revenue, By Years, 2023-2030* ($)
Figure 148: Company 5 Power Line Communication (PLC) Systems Market Net Revenue Share, By Business segments, 2023 (%)
Figure 149: Company 5 Power Line Communication (PLC) Systems Market Net Sales Share, By Geography, 2023 (%)
Figure 150: Company 6 Power Line Communication (PLC) Systems Market Net Revenue, By Years, 2023-2030* ($)
Figure 151: Company 6 Power Line Communication (PLC) Systems Market Net Revenue Share, By Business segments, 2023 (%)
Figure 152: Company 6 Power Line Communication (PLC) Systems Market Net Sales Share, By Geography, 2023 (%)
Figure 153: Company 7 Power Line Communication (PLC) Systems Market Net Revenue, By Years, 2023-2030* ($)
Figure 154: Company 7 Power Line Communication (PLC) Systems Market Net Revenue Share, By Business segments, 2023 (%)
Figure 155: Company 7 Power Line Communication (PLC) Systems Market Net Sales Share, By Geography, 2023 (%)
Figure 156: Company 8 Power Line Communication (PLC) Systems Market Net Revenue, By Years, 2023-2030* ($)
Figure 157: Company 8 Power Line Communication (PLC) Systems Market Net Revenue Share, By Business segments, 2023 (%)
Figure 158: Company 8 Power Line Communication (PLC) Systems Market Net Sales Share, By Geography, 2023 (%)
Figure 159: Company 9 Power Line Communication (PLC) Systems Market Net Revenue, By Years, 2023-2030* ($)
Figure 160: Company 9 Power Line Communication (PLC) Systems Market Net Revenue Share, By Business segments, 2023 (%)
Figure 161: Company 9 Power Line Communication (PLC) Systems Market Net Sales Share, By Geography, 2023 (%)
Figure 162: Company 10 Power Line Communication (PLC) Systems Market Net Revenue, By Years, 2023-2030* ($)
Figure 163: Company 10 Power Line Communication (PLC) Systems Market Net Revenue Share, By Business segments, 2023 (%)
Figure 164: Company 10 Power Line Communication (PLC) Systems Market Net Sales Share, By Geography, 2023 (%)
Figure 165: Company 11 Power Line Communication (PLC) Systems Market Net Revenue, By Years, 2023-2030* ($)
Figure 166: Company 11 Power Line Communication (PLC) Systems Market Net Revenue Share, By Business segments, 2023 (%)
Figure 167: Company 11 Power Line Communication (PLC) Systems Market Net Sales Share, By Geography, 2023 (%)
Figure 168: Company 12 Power Line Communication (PLC) Systems Market Net Revenue, By Years, 2023-2030* ($)
Figure 169: Company 12 Power Line Communication (PLC) Systems Market Net Revenue Share, By Business segments, 2023 (%)
Figure 170: Company 12 Power Line Communication (PLC) Systems Market Net Sales Share, By Geography, 2023 (%)
Figure 171: Company 13 Power Line Communication (PLC) Systems Market Net Revenue, By Years, 2023-2030* ($)
Figure 172: Company 13 Power Line Communication (PLC) Systems Market Net Revenue Share, By Business segments, 2023 (%)
Figure 173: Company 13 Power Line Communication (PLC) Systems Market Net Sales Share, By Geography, 2023 (%)
Figure 174: Company 14 Power Line Communication (PLC) Systems Market Net Revenue, By Years, 2023-2030* ($)
Figure 175: Company 14 Power Line Communication (PLC) Systems Market Net Revenue Share, By Business segments, 2023 (%)
Figure 176: Company 14 Power Line Communication (PLC) Systems Market Net Sales Share, By Geography, 2023 (%)
Figure 177: Company 15 Power Line Communication (PLC) Systems Market Net Revenue, By Years, 2023-2030* ($)
Figure 178: Company 15 Power Line Communication (PLC) Systems Market Net Revenue Share, By Business segments, 2023 (%)
Figure 179: Company 15 Power Line Communication (PLC) Systems Market Net Sales Share, By Geography, 2023 (%)