 Email
Email Print
Print


A pyrometer is a device used to measure temperature and can do so remotely. Pyrometers have the ability to detect very high temperatures owing to the remote sensing capability. They have the ability to detect the thermal radiation emitted by an object. There are two types of pyrometers, namely, optical pyrometers and radiation/infrared pyrometers. Optical pyrometers work on the principle of comparison of the intensity of light that a target radiates at a visible wavelength with the known brightness of an internally calibrated lamp. One limitation of the optical pyrometers is that it detects temperature of only those objects that emit a light or are glowing. When extremely high temperatures need to be measured, pyrometers are the best option since the use of conventional thermometers will result in damage to the measuring instrument. Radiation pyrometers work on the principle of detecting the intensity of the heat radiated from the surface of the object whose temperature is to be measured. Typical application for a radiation pyrometer is in furnaces and boilers.
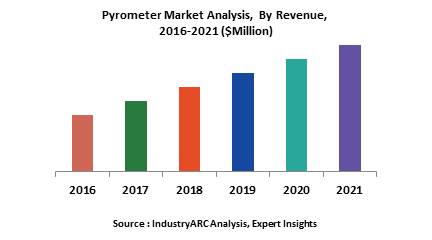
Pyrometers are used in a range of applications, with industrial having the largest share of the market. Petrochemical industry is another growing application for the pyrometer market. The non-contact ability of measuring temperature is a major driving factor for the pyrometer market as this leads to ease of use and longer durability. Increasing automation across various industries is another factor that is expected to have a significant impact on this market.
The Pyrometer Market can be segmented as
- on the basis of type
- Optical Pyrometers, Infrared/Radiation Pyrometers and Others
- Optical pyrometers are further segmented into
- Single range, double range, triple range and high-end optical pyrometers
- The radiation pyrometers are further segmented into
- Fixed focus type radiation pyrometer and variable focus type radiation pyrometer
- In terms of applications
- Industrial, Automotive, Aerospace and Defense, Metallurgy, Petrochemical and Others
- By Geography
- North America, South America, APAC, Europe, Middle East and Africa
While the market is highly fragmented with a number of players in the market, there has been some amount of consolidation as well with several mergers, collaborations and partnerships being formed.
Sample Companies profiled in this Report are:
- Pyrometer Instrument Company
- Wilcon Industries
- Watlow Electric Manufacturing Company
- Conax Buffalo Technologies
- Honeywell
- 10+.
1. Pyrometer Market - Overview
1.1. Definitions and Scope
2. Pyrometer Market - Executive summary
2.1. Market Revenue, Market Size and Key Trends by Company
2.2. Key Trends by type of Application
2.3. Key Trends segmented by Geography
3. Pyrometer Market
3.1. Comparative analysis
3.1.1. Product Benchmarking - Top 10 companies
3.1.2. Top 5 Financials Analysis
3.1.3. Market Value split by Top 10 companies
3.1.4. Patent Analysis - Top 10 companies
3.1.5. Pricing Analysis
4. Pyrometer Market – Startup companies Scenario Premium
4.1. Top 10 startup company Analysis by
4.1.1. Investment
4.1.2. Revenue
4.1.3. Market Shares
4.1.4. Market Size and Application Analysis
4.1.5. Venture Capital and Funding Scenario
5. Pyrometer Market – Industry Market Entry Scenario Premium
5.1. Regulatory Framework Overview
5.2. New Business and Ease of Doing business index
5.3. Case studies of successful ventures
5.4. Customer Analysis – Top 10 companies
6. Pyrometer Market Forces
6.1. Drivers
6.2. Constraints
6.3. Challenges
6.4. Porters five force model
6.4.1. Bargaining power of suppliers
6.4.2. Bargaining powers of customers
6.4.3. Threat of new entrants
6.4.4. Rivalry among existing players
6.4.5. Threat of substitutes
7. Pyrometer Market -Strategic analysis
7.1. Value chain analysis
7.2. Opportunities analysis
7.3. Product life cycle
7.4. Suppliers and distributors Market Share
8. Pyrometer Market – By Type (Market Size -$Million / $Billion)
8.1. Market Size and Market Share Analysis
8.2. Application Revenue and Trend Research
8.3. Product Segment Analysis
8.3.1. Optical Pyrometers
8.3.1.1. Single Range
8.3.1.2. Double Range
8.3.1.3. Triple Range
8.3.1.4. High-end Optical Pyrometer
8.3.2. Radiation/Infrared Pyrometers
8.3.2.1. Fixed Focus Type Radiation Pyrometer
8.3.2.2. Variable Focus Type Radiation Pyrometer
8.3.3. Others
9. Pyrometer Market – By Application (Market Size -$Million / $Billion)
9.1. Automotive
9.2. Aerospace and Defense
9.3. Industrial
9.4. Petrochemical
9.5. Metallurgy
9.6. Others
10. Pyrometer - By Geography (Market Size -$Million / $Billion)
10.1. Pyrometer Market - North America Segment Research
10.2. North America Market Research (Million / $Billion)
10.2.1. Segment type Size and Market Size Analysis
10.2.2. Revenue and Trends
10.2.3. Application Revenue and Trends by type of Application
10.2.4. Company Revenue and Product Analysis
10.2.5. North America Product type and Application Market Size
10.2.5.1. U.S.
10.2.5.2. Canada
10.2.5.3. Mexico
10.2.5.4. Rest of North America
10.3. Pyrometer - South America Segment Research
10.4. South America Market Research (Market Size -$Million / $Billion)
10.4.1. Segment type Size and Market Size Analysis
10.4.2. Revenue and Trends
10.4.3. Application Revenue and Trends by type of Application
10.4.4. Company Revenue and Product Analysis
10.4.5. South America Product type and Application Market Size
10.4.5.1. Brazil
10.4.5.2. Venezuela
10.4.5.3. Argentina
10.4.5.4. Ecuador
10.4.5.5. Peru
10.4.5.6. Colombia
10.4.5.7. Costa Rica
10.4.5.8. Rest of South America
10.5. Pyrometer - Europe Segment Research
10.6. Europe Market Research (Market Size -$Million / $Billion)
10.6.1. Segment type Size and Market Size Analysis
10.6.2. Revenue and Trends
10.6.3. Application Revenue and Trends by type of Application
10.6.4. Company Revenue and Product Analysis
10.6.5. Europe Segment Product type and Application Market Size
10.6.5.1. U.K
10.6.5.2. Germany
10.6.5.3. Italy
10.6.5.4. France
10.6.5.5. Netherlands
10.6.5.6. Belgium
10.6.5.7. Spain
10.6.5.8. Denmark
10.6.5.9. Rest of Europe
10.7. Pyrometer – APAC Segment Research
10.8. APAC Market Research (Market Size -$Million / $Billion)
10.8.1. Segment type Size and Market Size Analysis
10.8.2. Revenue and Trends
10.8.3. Application Revenue and Trends by type of Application
10.8.4. Company Revenue and Product Analysis
10.8.5. APAC Segment – Product type and Application Market Size
10.8.5.1. China
10.8.5.2. Australia
10.8.5.3. Japan
10.8.5.4. South Korea
10.8.5.5. India
10.8.5.6. Taiwan
10.8.5.7. Malaysia
11. Pyrometer Market - Entropy
11.1. New product launches
11.2. M&A's, collaborations, JVs and partnerships
12. Pyrometer Market – Industry / Segment Competition landscape Premium
12.1. Market Share Analysis
12.1.1. Market Share by Country- Top companies
12.1.2. Market Share by Region- Top 10 companies
12.1.3. Market Share by type of Application – Top 10 companies
12.1.4. Market Share by type of Product / Product category- Top 10 companies
12.1.5. Market Share at global level- Top 10 companies
12.1.6. Best Practises for companies
13. Pyrometer Market – Key Company List by Country Premium
14. Pyrometer Market Company Analysis
14.1. Market Share, Company Revenue, Products, M&A, Developments
14.2. Honeywell
14.3. Wika
14.4. Wilcon Industries
14.5. Analog Devices
14.6. Pyrometer Instrument Company
14.7. Omega Engineering
14.8. ARI Industries
14.9. Watlow Electric Manufacturing Company
14.10. Pyromation
14.11. Yamari Industries
14.12. Conax Buffalo Technologies
14.13. Ametek
14.14. Marsh Bellofram Group
14.15. LumaSense
14.16. Company 15
14.17. Company 16
14.18. Company 17 and more
"*Financials would be provided on a best efforts basis for private companies"
16. Pyrometer Market -Appendix
16.1. Abbreviations
16.2. Sources
17. Pyrometer Market -Methodology Premium
17.1. Research Methodology
17.1.1. Company Expert Interviews
17.1.2. Industry Databases
17.1.3. Associations
17.1.4. Company News
17.1.5. Company Annual Reports
17.1.6. Application Trends
17.1.7. New Products and Product database
17.1.8. Company Transcripts
17.1.9. R&D Trends
17.1.10. Key Opinion Leaders Interviews
17.1.11. Supply and Demand Trends
List of Tables:
Table 1: Pyrometer Market Overview 2023-2030
Table 2: Pyrometer Market Leader Analysis 2023-2030 (US$)
Table 3: Pyrometer Market Product Analysis 2023-2030 (US$)
Table 4: Pyrometer Market End User Analysis 2023-2030 (US$)
Table 5: Pyrometer Market Patent Analysis 2013-2023* (US$)
Table 6: Pyrometer Market Financial Analysis 2023-2030 (US$)
Table 7: Pyrometer Market Driver Analysis 2023-2030 (US$)
Table 8: Pyrometer Market Challenges Analysis 2023-2030 (US$)
Table 9: Pyrometer Market Constraint Analysis 2023-2030 (US$)
Table 10: Pyrometer Market Supplier Bargaining Power Analysis 2023-2030 (US$)
Table 11: Pyrometer Market Buyer Bargaining Power Analysis 2023-2030 (US$)
Table 12: Pyrometer Market Threat of Substitutes Analysis 2023-2030 (US$)
Table 13: Pyrometer Market Threat of New Entrants Analysis 2023-2030 (US$)
Table 14: Pyrometer Market Degree of Competition Analysis 2023-2030 (US$)
Table 15: Pyrometer Market Value Chain Analysis 2023-2030 (US$)
Table 16: Pyrometer Market Pricing Analysis 2023-2030 (US$)
Table 17: Pyrometer Market Opportunities Analysis 2023-2030 (US$)
Table 18: Pyrometer Market Product Life Cycle Analysis 2023-2030 (US$)
Table 19: Pyrometer Market Supplier Analysis 2023-2030 (US$)
Table 20: Pyrometer Market Distributor Analysis 2023-2030 (US$)
Table 21: Pyrometer Market Trend Analysis 2023-2030 (US$)
Table 22: Pyrometer Market Size 2023 (US$)
Table 23: Pyrometer Market Forecast Analysis 2023-2030 (US$)
Table 24: Pyrometer Market Sales Forecast Analysis 2023-2030 (Units)
Table 25: Pyrometer Market, Revenue & Volume, By Type, 2023-2030 ($)
Table 26: Pyrometer Market By Type, Revenue & Volume, By Optical Pyrometers, 2023-2030 ($)
Table 27: Pyrometer Market By Type, Revenue & Volume, By Radiation/Infrared Pyrometers, 2023-2030 ($)
Table 28: Pyrometer Market, Revenue & Volume, By Application, 2023-2030 ($)
Table 29: Pyrometer Market By Application, Revenue & Volume, By Automotive, 2023-2030 ($)
Table 30: Pyrometer Market By Application, Revenue & Volume, By Aerospace and Defense, 2023-2030 ($)
Table 31: Pyrometer Market By Application, Revenue & Volume, By Industrial, 2023-2030 ($)
Table 32: Pyrometer Market By Application, Revenue & Volume, By Petrochemical, 2023-2030 ($)
Table 33: Pyrometer Market By Application, Revenue & Volume, By Metallurgy, 2023-2030 ($)
Table 34: North America Pyrometer Market, Revenue & Volume, By Type, 2023-2030 ($)
Table 35: North America Pyrometer Market, Revenue & Volume, By Application, 2023-2030 ($)
Table 36: South america Pyrometer Market, Revenue & Volume, By Type, 2023-2030 ($)
Table 37: South america Pyrometer Market, Revenue & Volume, By Application, 2023-2030 ($)
Table 38: Europe Pyrometer Market, Revenue & Volume, By Type, 2023-2030 ($)
Table 39: Europe Pyrometer Market, Revenue & Volume, By Application, 2023-2030 ($)
Table 40: APAC Pyrometer Market, Revenue & Volume, By Type, 2023-2030 ($)
Table 41: APAC Pyrometer Market, Revenue & Volume, By Application, 2023-2030 ($)
Table 42: Middle East & Africa Pyrometer Market, Revenue & Volume, By Type, 2023-2030 ($)
Table 43: Middle East & Africa Pyrometer Market, Revenue & Volume, By Application, 2023-2030 ($)
Table 44: Russia Pyrometer Market, Revenue & Volume, By Type, 2023-2030 ($)
Table 45: Russia Pyrometer Market, Revenue & Volume, By Application, 2023-2030 ($)
Table 46: Israel Pyrometer Market, Revenue & Volume, By Type, 2023-2030 ($)
Table 47: Israel Pyrometer Market, Revenue & Volume, By Application, 2023-2030 ($)
Table 48: Top Companies 2023 (US$) Pyrometer Market, Revenue & Volume
Table 49: Product Launch 2023-2030 Pyrometer Market, Revenue & Volume
Table 50: Mergers & Acquistions 2023-2030 Pyrometer Market, Revenue & Volume
List of Figures:
Figure 1: Overview of Pyrometer Market 2023-2030
Figure 2: Market Share Analysis for Pyrometer Market 2023 (US$)
Figure 3: Product Comparison in Pyrometer Market 2023-2030 (US$)
Figure 4: End User Profile for Pyrometer Market 2023-2030 (US$)
Figure 5: Patent Application and Grant in Pyrometer Market 2013-2023* (US$)
Figure 6: Top 5 Companies Financial Analysis in Pyrometer Market 2023-2030 (US$)
Figure 7: Market Entry Strategy in Pyrometer Market 2023-2030
Figure 8: Ecosystem Analysis in Pyrometer Market 2023
Figure 9: Average Selling Price in Pyrometer Market 2023-2030
Figure 10: Top Opportunites in Pyrometer Market 2023-2030
Figure 11: Market Life Cycle Analysis in Pyrometer Market
Figure 12: GlobalBy Type Pyrometer Market Revenue, 2023-2030 ($)
Figure 13: GlobalBy Application Pyrometer Market Revenue, 2023-2030 ($)
Figure 14: Global Pyrometer Market - By Geography
Figure 15: Global Pyrometer Market Value & Volume, By Geography, 2023-2030 ($)
Figure 16: Global Pyrometer Market CAGR, By Geography, 2023-2030 (%)
Figure 17: North America Pyrometer Market Value & Volume, 2023-2030 ($)
Figure 18: US Pyrometer Market Value & Volume, 2023-2030 ($)
Figure 19: US GDP and Population, 2023-2030 ($)
Figure 20: US GDP – Composition of 2023, By Sector of Origin
Figure 21: US Export and Import Value & Volume, 2023-2030 ($)
Figure 22: Canada Pyrometer Market Value & Volume, 2023-2030 ($)
Figure 23: Canada GDP and Population, 2023-2030 ($)
Figure 24: Canada GDP – Composition of 2023, By Sector of Origin
Figure 25: Canada Export and Import Value & Volume, 2023-2030 ($)
Figure 26: Mexico Pyrometer Market Value & Volume, 2023-2030 ($)
Figure 27: Mexico GDP and Population, 2023-2030 ($)
Figure 28: Mexico GDP – Composition of 2023, By Sector of Origin
Figure 29: Mexico Export and Import Value & Volume, 2023-2030 ($)
Figure 30: South America Pyrometer Market Value & Volume, 2023-2030 ($)
Figure 31: Brazil Pyrometer Market Value & Volume, 2023-2030 ($)
Figure 32: Brazil GDP and Population, 2023-2030 ($)
Figure 33: Brazil GDP – Composition of 2023, By Sector of Origin
Figure 34: Brazil Export and Import Value & Volume, 2023-2030 ($)
Figure 35: Venezuela Pyrometer Market Value & Volume, 2023-2030 ($)
Figure 36: Venezuela GDP and Population, 2023-2030 ($)
Figure 37: Venezuela GDP – Composition of 2023, By Sector of Origin
Figure 38: Venezuela Export and Import Value & Volume, 2023-2030 ($)
Figure 39: Argentina Pyrometer Market Value & Volume, 2023-2030 ($)
Figure 40: Argentina GDP and Population, 2023-2030 ($)
Figure 41: Argentina GDP – Composition of 2023, By Sector of Origin
Figure 42: Argentina Export and Import Value & Volume, 2023-2030 ($)
Figure 43: Ecuador Pyrometer Market Value & Volume, 2023-2030 ($)
Figure 44: Ecuador GDP and Population, 2023-2030 ($)
Figure 45: Ecuador GDP – Composition of 2023, By Sector of Origin
Figure 46: Ecuador Export and Import Value & Volume, 2023-2030 ($)
Figure 47: Peru Pyrometer Market Value & Volume, 2023-2030 ($)
Figure 48: Peru GDP and Population, 2023-2030 ($)
Figure 49: Peru GDP – Composition of 2023, By Sector of Origin
Figure 50: Peru Export and Import Value & Volume, 2023-2030 ($)
Figure 51: Colombia Pyrometer Market Value & Volume, 2023-2030 ($)
Figure 52: Colombia GDP and Population, 2023-2030 ($)
Figure 53: Colombia GDP – Composition of 2023, By Sector of Origin
Figure 54: Colombia Export and Import Value & Volume, 2023-2030 ($)
Figure 55: Costa Rica Pyrometer Market Value & Volume, 2023-2030 ($)
Figure 56: Costa Rica GDP and Population, 2023-2030 ($)
Figure 57: Costa Rica GDP – Composition of 2023, By Sector of Origin
Figure 58: Costa Rica Export and Import Value & Volume, 2023-2030 ($)
Figure 59: Europe Pyrometer Market Value & Volume, 2023-2030 ($)
Figure 60: U.K Pyrometer Market Value & Volume, 2023-2030 ($)
Figure 61: U.K GDP and Population, 2023-2030 ($)
Figure 62: U.K GDP – Composition of 2023, By Sector of Origin
Figure 63: U.K Export and Import Value & Volume, 2023-2030 ($)
Figure 64: Germany Pyrometer Market Value & Volume, 2023-2030 ($)
Figure 65: Germany GDP and Population, 2023-2030 ($)
Figure 66: Germany GDP – Composition of 2023, By Sector of Origin
Figure 67: Germany Export and Import Value & Volume, 2023-2030 ($)
Figure 68: Italy Pyrometer Market Value & Volume, 2023-2030 ($)
Figure 69: Italy GDP and Population, 2023-2030 ($)
Figure 70: Italy GDP – Composition of 2023, By Sector of Origin
Figure 71: Italy Export and Import Value & Volume, 2023-2030 ($)
Figure 72: France Pyrometer Market Value & Volume, 2023-2030 ($)
Figure 73: France GDP and Population, 2023-2030 ($)
Figure 74: France GDP – Composition of 2023, By Sector of Origin
Figure 75: France Export and Import Value & Volume, 2023-2030 ($)
Figure 76: Netherlands Pyrometer Market Value & Volume, 2023-2030 ($)
Figure 77: Netherlands GDP and Population, 2023-2030 ($)
Figure 78: Netherlands GDP – Composition of 2023, By Sector of Origin
Figure 79: Netherlands Export and Import Value & Volume, 2023-2030 ($)
Figure 80: Belgium Pyrometer Market Value & Volume, 2023-2030 ($)
Figure 81: Belgium GDP and Population, 2023-2030 ($)
Figure 82: Belgium GDP – Composition of 2023, By Sector of Origin
Figure 83: Belgium Export and Import Value & Volume, 2023-2030 ($)
Figure 84: Spain Pyrometer Market Value & Volume, 2023-2030 ($)
Figure 85: Spain GDP and Population, 2023-2030 ($)
Figure 86: Spain GDP – Composition of 2023, By Sector of Origin
Figure 87: Spain Export and Import Value & Volume, 2023-2030 ($)
Figure 88: Denmark Pyrometer Market Value & Volume, 2023-2030 ($)
Figure 89: Denmark GDP and Population, 2023-2030 ($)
Figure 90: Denmark GDP – Composition of 2023, By Sector of Origin
Figure 91: Denmark Export and Import Value & Volume, 2023-2030 ($)
Figure 92: APAC Pyrometer Market Value & Volume, 2023-2030 ($)
Figure 93: China Pyrometer Market Value & Volume, 2023-2030
Figure 94: China GDP and Population, 2023-2030 ($)
Figure 95: China GDP – Composition of 2023, By Sector of Origin
Figure 96: China Export and Import Value & Volume, 2023-2030 ($) Pyrometer Market China Export and Import Value & Volume, 2023-2030 ($)
Figure 97: Australia Pyrometer Market Value & Volume, 2023-2030 ($)
Figure 98: Australia GDP and Population, 2023-2030 ($)
Figure 99: Australia GDP – Composition of 2023, By Sector of Origin
Figure 100: Australia Export and Import Value & Volume, 2023-2030 ($)
Figure 101: South Korea Pyrometer Market Value & Volume, 2023-2030 ($)
Figure 102: South Korea GDP and Population, 2023-2030 ($)
Figure 103: South Korea GDP – Composition of 2023, By Sector of Origin
Figure 104: South Korea Export and Import Value & Volume, 2023-2030 ($)
Figure 105: India Pyrometer Market Value & Volume, 2023-2030 ($)
Figure 106: India GDP and Population, 2023-2030 ($)
Figure 107: India GDP – Composition of 2023, By Sector of Origin
Figure 108: India Export and Import Value & Volume, 2023-2030 ($)
Figure 109: Taiwan Pyrometer Market Value & Volume, 2023-2030 ($)
Figure 110: Taiwan GDP and Population, 2023-2030 ($)
Figure 111: Taiwan GDP – Composition of 2023, By Sector of Origin
Figure 112: Taiwan Export and Import Value & Volume, 2023-2030 ($)
Figure 113: Malaysia Pyrometer Market Value & Volume, 2023-2030 ($)
Figure 114: Malaysia GDP and Population, 2023-2030 ($)
Figure 115: Malaysia GDP – Composition of 2023, By Sector of Origin
Figure 116: Malaysia Export and Import Value & Volume, 2023-2030 ($)
Figure 117: Hong Kong Pyrometer Market Value & Volume, 2023-2030 ($)
Figure 118: Hong Kong GDP and Population, 2023-2030 ($)
Figure 119: Hong Kong GDP – Composition of 2023, By Sector of Origin
Figure 120: Hong Kong Export and Import Value & Volume, 2023-2030 ($)
Figure 121: Middle East & Africa Pyrometer Market Middle East & Africa 3D Printing Market Value & Volume, 2023-2030 ($)
Figure 122: Russia Pyrometer Market Value & Volume, 2023-2030 ($)
Figure 123: Russia GDP and Population, 2023-2030 ($)
Figure 124: Russia GDP – Composition of 2023, By Sector of Origin
Figure 125: Russia Export and Import Value & Volume, 2023-2030 ($)
Figure 126: Israel Pyrometer Market Value & Volume, 2023-2030 ($)
Figure 127: Israel GDP and Population, 2023-2030 ($)
Figure 128: Israel GDP – Composition of 2023, By Sector of Origin
Figure 129: Israel Export and Import Value & Volume, 2023-2030 ($)
Figure 130: Entropy Share, By Strategies, 2023-2030* (%) Pyrometer Market
Figure 131: Developments, 2023-2030* Pyrometer Market
Figure 132: Company 1 Pyrometer Market Net Revenue, By Years, 2023-2030* ($)
Figure 133: Company 1 Pyrometer Market Net Revenue Share, By Business segments, 2023 (%)
Figure 134: Company 1 Pyrometer Market Net Sales Share, By Geography, 2023 (%)
Figure 135: Company 2 Pyrometer Market Net Revenue, By Years, 2023-2030* ($)
Figure 136: Company 2 Pyrometer Market Net Revenue Share, By Business segments, 2023 (%)
Figure 137: Company 2 Pyrometer Market Net Sales Share, By Geography, 2023 (%)
Figure 138: Company 3 Pyrometer Market Net Revenue, By Years, 2023-2030* ($)
Figure 139: Company 3 Pyrometer Market Net Revenue Share, By Business segments, 2023 (%)
Figure 140: Company 3 Pyrometer Market Net Sales Share, By Geography, 2023 (%)
Figure 141: Company 4 Pyrometer Market Net Revenue, By Years, 2023-2030* ($)
Figure 142: Company 4 Pyrometer Market Net Revenue Share, By Business segments, 2023 (%)
Figure 143: Company 4 Pyrometer Market Net Sales Share, By Geography, 2023 (%)
Figure 144: Company 5 Pyrometer Market Net Revenue, By Years, 2023-2030* ($)
Figure 145: Company 5 Pyrometer Market Net Revenue Share, By Business segments, 2023 (%)
Figure 146: Company 5 Pyrometer Market Net Sales Share, By Geography, 2023 (%)
Figure 147: Company 6 Pyrometer Market Net Revenue, By Years, 2023-2030* ($)
Figure 148: Company 6 Pyrometer Market Net Revenue Share, By Business segments, 2023 (%)
Figure 149: Company 6 Pyrometer Market Net Sales Share, By Geography, 2023 (%)
Figure 150: Company 7 Pyrometer Market Net Revenue, By Years, 2023-2030* ($)
Figure 151: Company 7 Pyrometer Market Net Revenue Share, By Business segments, 2023 (%)
Figure 152: Company 7 Pyrometer Market Net Sales Share, By Geography, 2023 (%)
Figure 153: Company 8 Pyrometer Market Net Revenue, By Years, 2023-2030* ($)
Figure 154: Company 8 Pyrometer Market Net Revenue Share, By Business segments, 2023 (%)
Figure 155: Company 8 Pyrometer Market Net Sales Share, By Geography, 2023 (%)
Figure 156: Company 9 Pyrometer Market Net Revenue, By Years, 2023-2030* ($)
Figure 157: Company 9 Pyrometer Market Net Revenue Share, By Business segments, 2023 (%)
Figure 158: Company 9 Pyrometer Market Net Sales Share, By Geography, 2023 (%)
Figure 159: Company 10 Pyrometer Market Net Revenue, By Years, 2023-2030* ($)
Figure 160: Company 10 Pyrometer Market Net Revenue Share, By Business segments, 2023 (%)
Figure 161: Company 10 Pyrometer Market Net Sales Share, By Geography, 2023 (%)
Figure 162: Company 11 Pyrometer Market Net Revenue, By Years, 2023-2030* ($)
Figure 163: Company 11 Pyrometer Market Net Revenue Share, By Business segments, 2023 (%)
Figure 164: Company 11 Pyrometer Market Net Sales Share, By Geography, 2023 (%)
Figure 165: Company 12 Pyrometer Market Net Revenue, By Years, 2023-2030* ($)
Figure 166: Company 12 Pyrometer Market Net Revenue Share, By Business segments, 2023 (%)
Figure 167: Company 12 Pyrometer Market Net Sales Share, By Geography, 2023 (%)
Figure 168: Company 13 Pyrometer Market Net Revenue, By Years, 2023-2030* ($)
Figure 169: Company 13 Pyrometer Market Net Revenue Share, By Business segments, 2023 (%)
Figure 170: Company 13 Pyrometer Market Net Sales Share, By Geography, 2023 (%)
Figure 171: Company 14 Pyrometer Market Net Revenue, By Years, 2023-2030* ($)
Figure 172: Company 14 Pyrometer Market Net Revenue Share, By Business segments, 2023 (%)
Figure 173: Company 14 Pyrometer Market Net Sales Share, By Geography, 2023 (%)
Figure 174: Company 15 Pyrometer Market Net Revenue, By Years, 2023-2030* ($)
Figure 175: Company 15 Pyrometer Market Net Revenue Share, By Business segments, 2023 (%)
Figure 176: Company 15 Pyrometer Market Net Sales Share, By Geography, 2023 (%)