 Email
Email Print
Print


Sensors in Healthcare Applications Market - Forecast(2024 - 2030)
Sensors Market in Healthcare Applications Overview:
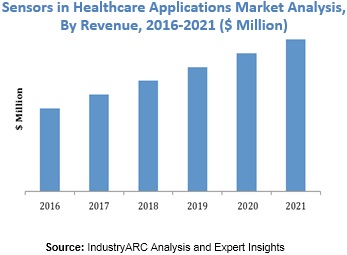
The United Nations (UN) has estimated that, in 2050, the population of people beyond 60 years will be two times of that in 2015, and it was already 962 million in 2017[1]. Apparently, a lot of geriatric conditions and chronic diseases are associated with aging, which is stirring the home healthcare sector where the application of the sensors is imperative in order to monitor the treatment and results. This is one of the segments in the healthcare sector which is creating opportunities in the sensors market in healthcare applications for the vendors; and according to the findings by IndustryARC’s market analyst, the global market size was $18 billion to $20 billion in 2018. Furthermore, the analyst estimates the medical imaging application segment of the sensors market in the healthcare sector to grow with a global CAGR of 8% to 10% during the forecast period of 2019 to 2025.
The technology of motion sensors in APAC is on the perpetual rise. This is coupled with respiratory diseases that are attributed to the air pollution which is the major concern in the developing countries of APAC, and it is quite evident when the urban air population was held responsible for the death of 500,000 individuals by the World Health Organization (WHO)[2]. This is having a consequent effect on the sales of medical sensors APAC, and according to the market analyst, the region held the maximum regional market share of around 30% in 2018.
Sensors Market in Healthcare Applications Outlook:
Sensors are generally used in the healthcare sector for remote patient monitoring through health rate monitor. They are used in different ways that range from medical imaging, rehabilitation robotics and through wearable devices that monitor the health of the patient remotely. The global medical imaging equipment revenues are poised to reach $24 billion in 2020, according to WHO[3]. Now, these imaging equipment make use of sensors which is leading to subsequent stir in the sensors market in healthcare applications. According to the market analyst of IndustryARC, the application of sensors in medical imaging will observe a supercharging CAGR of more than 15% through to 2025.
Sensors Market in Healthcare Applications Growth Drivers:
- The Evolution of Medical Diagnosis –
There is a myriad of rare or newly found diseases in the contemporary world which do not have a specific diagnostic process. However, there is a constant R&D by medical institutes across the globe to create a diagnostic process and formulate new medicines for these diseases. This is coupled with the technological advancements such as sensors which are leveraged by health care professionals to evaluate the disease and formulate vaccines that can cure them which is driving the demand growth in sensors market in healthcare applications.
- The Nascent Virtual Healthcare Systems –
Nowadays, hospitals have a patient portal which collates the data pertaining to patient history that include every stage from diagnosis to the last visit. These portals are utilized for data analysis and to enhance disease management. Each patient has a unique account which can be accessed by hospital management or the patient which creates the need for an IoT sensor which can connect all the information about a patient and make a database on the portal. This is a rampant practice in hospitals which is further flourishing the sensors market in healthcare applications.
- Sensors in Medical Equipment –
Pressure sensors are an integral part of anesthesia delivery machines, oxygen concentrators, ventilators, and other healthcare equipment that are used for kidney dialysis, blood pressure monitoring, and hospital bed surgical fluid management systems. “The diverse application of sensors in medical equipment coupled with the fact that healthcare equipment market demand is observing a steady growth owing to the increasing incidences of chronic diseases is creating a sustainable demand of sensors which will observe an increment in the future,” remarks the market analyst in the market research report.
Sensors Market in Healthcare Applications Challenges:
The major challenge faced by the vendors in the sensors market in healthcare applications is that the application of sensors in wearable medical devices is facing regulatory issues by Food and Drug Administration (FDA) and physicians are also showing reluctance to prescribe these devices which contain sensors. However, the healthcare sector is undergoing constant digitalization which is compensating these trifle challenges and creating opportunities for the vendors that manufacture healthcare sensors.
Sensors Market in Healthcare Applications Key Players Perspective:
The key players striving to capitalize on the demand influx in the sensors market in healthcare applications are Smiths Group, Honeywell, GE, STMicroelectronics, MSI, Analog, TI, NXP, First Sensor, Medtronic, TE Connectivity, Murata, and Sensiron.
Sensors Market in Healthcare Applications Trends:
- Latest Development – In May 2018, LifePlus Inc. announced about the development of the world’s first non-invasive continuous blood glucose monitoring multi-sensor wearable device.
- Cardiac monitors, wearable imaging, and diagnostic wearable are three trends that are going to influence the sensors market in healthcare applications in the future.
Sensors Market in Healthcare Applications Research Scope:
The base year of the study is 2018, with forecast done up to 2025. The study presents a thorough analysis of the competitive landscape, taking into account the market shares of the leading companies. It also provides information on unit shipments. These provide the key market participants with the necessary business intelligence and help them understand the future of the sensors market in healthcare applications. The assessment includes the forecast, an overview of the competitive structure, the market shares of the competitors, as well as the market trends, market demands, market drivers, market challenges, and product analysis. The market drivers and restraints have been assessed to fathom their impact over the forecast period. This report further identifies the key opportunities for growth while also detailing the key challenges and possible threats. The key areas of focus include the types of sensors market in healthcare applications, and their specific applications in patient monitoring, diagnostics, therapeutics, imaging, and others.
Sensors Market in Healthcare Applications Report: Industry Coverage
The report analyses the product demands by the type of product - temperature, pressure, chemical, bio, level, flow, position, and others.
The sensors market in healthcare applications report also analyzes the major geographic regions as well as the major countries in these regions. The regions and countries covered in the study include:
- North America: The U.S., Canada, Mexico
- South America: Brazil, Venezuela, Argentina, Ecuador, Peru, Colombia, Costa Rica
- Europe: The U.K., Germany, Italy, France, the Netherlands, Belgium, Spain, Denmark
- APAC: China, Japan, Australia, South Korea, India, Taiwan, Malaysia, Hong Kong
- Middle East and Africa: Israel, South Africa, Saudi Arabia
Key Questions Addressed in the Sensors Market in Healthcare Applications Market Report
Is the market demand for Sensors Market in Healthcare Applications growing? How long will it continue to grow and at what rate?
Which type of home security system presents the major growth opportunities?
Is there a possibility for change in the market structure over time?
Are additional developments needed for the existing product or services offerings or do the existing products meet the customer demands?
Do the key vendors look for partnerships to expand their businesses with respect to geography or product?
What are the short-term, long-term, and medium-term growth drivers for the market?
What are the short-term, medium-term, and long-term challenges for the market?
What are the short-term, medium-term, and long-term opportunities for the market
Who are the top players/companies of the market?
What are the recent innovations in the market?
How many patents have been filed by the leading players?
What are the types of patents filed by the leading players?
What is our Vision 2030 for Sensors Market in Healthcare Applications market?
A Few Focus Points Of This Research Are Given Below:
- Give a deep-dive analysis of the key operational strategies with focus on the corporate structure, R&D strategies, localization strategies, production capabilities, and sales performance of various companies
- Provide an overview of the product portfolio, including product planning, development, and positioning
- Discuss the role of technology companies in partnerships
- Explore the regional sales activities
- Analyze the market size and giving the forecast for current and future global Sensors Market in Healthcare Applications market during the forecast 2018–2023
- Analyze the competitive factors, competitors’ market shares, product capabilities, and supply chain structures
Reference:
[1]http://www.un.org/en/sections/issues-depth/ageing/
[2]http://www.wpro.who.int/health_research/documents/dhs_hr_health_in_asia_and_the_pacific_18_chapter_13_key_health_challenges_in_the_asia_pacific_region.pdf
[3]https://technology.ihs.com/595601/three-global-trends-changing-the-landscape-of-the-medical-imaging-equipment-market
1. Sensors in Healthcare Applications Market - Overview
1.1. Definitions and Scope
2. Sensors in Healthcare Applications Market - Executive summary
2.1. Market Revenue, Market Size and Key Trends by Company
2.2. Key Trends by type of Application
2.3. Key Trends segmented by Geography
3. Sensors in Healthcare Applications Market
3.1. Comparative analysis
3.1.1. Product Benchmarking - Top 10 companies
3.1.2. Top 5 Financials Analysis
3.1.3. Market Value split by Top 10 companies
3.1.4. Patent Analysis - Top 10 companies
3.1.5. Pricing Analysis
4. Sensors in Healthcare Applications Market – Startup companies Scenario Premium
4.1. Top 10 startup company Analysis by
4.1.1. Investment
4.1.2. Revenue
4.1.3. Market Shares
4.1.4. Market Size and Application Analysis
4.1.5. Venture Capital and Funding Scenario
5. Sensors in Healthcare Applications Market – Industry Market Entry Scenario Premium
5.1. Regulatory Framework Overview
5.2. New Business and Ease of Doing business index
5.3. Case studies of successful ventures
5.4. Customer Analysis – Top 10 companies
6. Sensors in Healthcare Applications Market Forces
6.1. Drivers
6.2. Constraints
6.3. Challenges
6.4. Porters five force model
6.4.1. Bargaining power of suppliers
6.4.2. Bargaining powers of customers
6.4.3. Threat of new entrants
6.4.4. Rivalry among existing players
6.4.5. Threat of substitutes
7. Sensors in Healthcare Applications Market -Strategic analysis
7.1. Value chain analysis
7.2. Opportunities analysis
7.3. Product life cycle
7.4. Suppliers and distributors Market Share
8. Sensors in Healthcare Applications Market – By Type (Market Size -$Million / $Billion)
8.1. Market Size and Market Share Analysis
8.2. Application Revenue and Trend Research
8.3. Product Segment Analysis
8.3.1. Temperature Sensors
8.3.2. Pressure Sensors
8.3.3. Chemical Sensors
8.3.4. Flow Sensors
8.3.5. Position Sensors
8.3.6. Level Sensors
8.3.7. Biosensors
8.3.8. Others
9. Sensors in Healthcare Applications Market – By Application (Market Size -$Million / $Billion)
9.1. Diagnostics
9.2. Patient Monitoring
9.3. Therapeutics
9.4. Imaging
9.5. Others
10. Sensors in Healthcare Applications - By Geography (Market Size -$Million / $Billion)
10.1. Sensors in Healthcare Applications Market - North America Segment Research
10.2. North America Market Research (Million / $Billion)
10.2.1. Segment type Size and Market Size Analysis
10.2.2. Revenue and Trends
10.2.3. Application Revenue and Trends by type of Application
10.2.4. Company Revenue and Product Analysis
10.2.5. North America Product type and Application Market Size
10.2.5.1. U.S.
10.2.5.2. Canada
10.2.5.3. Mexico
10.2.5.4. Rest of North America
10.3. Sensors in Healthcare Applications - South America Segment Research
10.4. South America Market Research (Market Size -$Million / $Billion)
10.4.1. Segment type Size and Market Size Analysis
10.4.2. Revenue and Trends
10.4.3. Application Revenue and Trends by type of Application
10.4.4. Company Revenue and Product Analysis
10.4.5. South America Product type and Application Market Size
10.4.5.1. Brazil
10.4.5.2. Venezuela
10.4.5.3. Argentina
10.4.5.4. Ecuador
10.4.5.5. Peru
10.4.5.6. Colombia
10.4.5.7. Costa Rica
10.4.5.8. Rest of South America
10.5. Sensors in Healthcare Applications - Europe Segment Research
10.6. Europe Market Research (Market Size -$Million / $Billion)
10.6.1. Segment type Size and Market Size Analysis
10.6.2. Revenue and Trends
10.6.3. Application Revenue and Trends by type of Application
10.6.4. Company Revenue and Product Analysis
10.6.5. Europe Segment Product type and Application Market Size
10.6.5.1. U.K
10.6.5.2. Germany
10.6.5.3. Italy
10.6.5.4. France
10.6.5.5. Netherlands
10.6.5.6. Belgium
10.6.5.7. Spain
10.6.5.8. Denmark
10.6.5.9. Rest of Europe
10.7. Sensors in Healthcare Applications – APAC Segment Research
10.8. APAC Market Research (Market Size -$Million / $Billion)
10.8.1. Segment type Size and Market Size Analysis
10.8.2. Revenue and Trends
10.8.3. Application Revenue and Trends by type of Application
10.8.4. Company Revenue and Product Analysis
10.8.5. APAC Segment – Product type and Application Market Size
10.8.5.1. China
10.8.5.2. Australia
10.8.5.3. Japan
10.8.5.4. South Korea
10.8.5.5. India
10.8.5.6. Taiwan
10.8.5.7. Malaysia
11. Sensors in Healthcare Applications Market - Entropy
11.1. New product launches
11.2. M&A's, collaborations, JVs and partnerships
12. Sensors in Healthcare Applications Market – Industry / Segment Competition landscape Premium
12.1. Market Share Analysis
12.1.1. Market Share by Country- Top companies
12.1.2. Market Share by Region- Top 10 companies
12.1.3. Market Share by type of Application – Top 10 companies
12.1.4. Market Share by type of Product / Product category- Top 10 companies
12.1.5. Market Share at global level- Top 10 companies
12.1.6. Best Practises for companies
13. Sensors in Healthcare Applications Market – Key Company List by Country Premium
14. Sensors in Healthcare Applications Market Company Analysis
14.1. Market Share, Company Revenue, Products, M&A, Developments
14.2. Honeywell International, Inc
14.3. Thermofisher Scientific, Inc.,
14.4. Abott Laboratories
14.5. Bio-Rad Laboratories
14.6. Texas Instruments
14.7. Company 6
14.8. Company 7
14.9. Company 8
14.10. Company 9
14.10. Company 10 and more
"*Financials would be provided on a best efforts basis for private companies"
15. Sensors in Healthcare Applications Market -Appendix
15.1. Abbreviations
15.2. Sources
16. Sensors in Healthcare Applications Market -Methodology Premium
16.1. Research Methodology
16.1.1. Company Expert Interviews
16.1.2. Industry Databases
16.1.3. Associations
16.1.4. Company News
16.1.5. Company Annual Reports
16.1.6. Application Trends
16.1.7. New Products and Product database
16.1.8. Company Transcripts
16.1.9. R&D Trends
16.1.10. Key Opinion Leaders Interviews
16.1.10. Supply and Demand Trends
List of Tables
Table 1: Sensors in Healthcare Applications Market Overview 2023-2030
Table 2: Sensors in Healthcare Applications Market Leader Analysis 2023-2030 (US$)
Table 3: Sensors in Healthcare Applications Market Product Analysis 2023-2030 (US$)
Table 4: Sensors in Healthcare Applications Market End User Analysis 2023-2030 (US$)
Table 5: Sensors in Healthcare Applications Market Patent Analysis 2013-2023* (US$)
Table 6: Sensors in Healthcare Applications Market Financial Analysis 2023-2030 (US$)
Table 7: Sensors in Healthcare Applications Market Driver Analysis 2023-2030 (US$)
Table 8: Sensors in Healthcare Applications Market Challenges Analysis 2023-2030 (US$)
Table 9: Sensors in Healthcare Applications Market Constraint Analysis 2023-2030 (US$)
Table 10: Sensors in Healthcare Applications Market Supplier Bargaining Power Analysis 2023-2030 (US$)
Table 11: Sensors in Healthcare Applications Market Buyer Bargaining Power Analysis 2023-2030 (US$)
Table 12: Sensors in Healthcare Applications Market Threat of Substitutes Analysis 2023-2030 (US$)
Table 13: Sensors in Healthcare Applications Market Threat of New Entrants Analysis 2023-2030 (US$)
Table 14: Sensors in Healthcare Applications Market Degree of Competition Analysis 2023-2030 (US$)
Table 15: Sensors in Healthcare Applications Market Value Chain Analysis 2023-2030 (US$)
Table 16: Sensors in Healthcare Applications Market Pricing Analysis 2023-2030 (US$)
Table 17: Sensors in Healthcare Applications Market Opportunities Analysis 2023-2030 (US$)
Table 18: Sensors in Healthcare Applications Market Product Life Cycle Analysis 2023-2030 (US$)
Table 19: Sensors in Healthcare Applications Market Supplier Analysis 2023-2030 (US$)
Table 20: Sensors in Healthcare Applications Market Distributor Analysis 2023-2030 (US$)
Table 21: Sensors in Healthcare Applications Market Trend Analysis 2023-2030 (US$)
Table 22: Sensors in Healthcare Applications Market Size 2023 (US$)
Table 23: Sensors in Healthcare Applications Market Forecast Analysis 2023-2030 (US$)
Table 24: Sensors in Healthcare Applications Market Sales Forecast Analysis 2023-2030 (Units)
Table 25: Sensors in Healthcare Applications Market, Revenue & Volume,By Type, 2023-2030 ($)
Table 26: Sensors in Healthcare Applications Market By Type, Revenue & Volume,By Temperature Sensors, 2023-2030 ($)
Table 27: Sensors in Healthcare Applications Market By Type, Revenue & Volume,By Pressure Sensors, 2023-2030 ($)
Table 28: Sensors in Healthcare Applications Market By Type, Revenue & Volume,By Chemical Sensors, 2023-2030 ($)
Table 29: Sensors in Healthcare Applications Market By Type, Revenue & Volume,By Flow Sensors, 2023-2030 ($)
Table 30: Sensors in Healthcare Applications Market By Type, Revenue & Volume,By Position Sensors, 2023-2030 ($)
Table 31: Sensors in Healthcare Applications Market, Revenue & Volume,By Application, 2023-2030 ($)
Table 32: Sensors in Healthcare Applications Market By Application, Revenue & Volume,By Diagnostics, 2023-2030 ($)
Table 33: Sensors in Healthcare Applications Market By Application, Revenue & Volume,By Patient Monitoring, 2023-2030 ($)
Table 34: Sensors in Healthcare Applications Market By Application, Revenue & Volume,By Therapeutics, 2023-2030 ($)
Table 35: Sensors in Healthcare Applications Market By Application, Revenue & Volume,By Imaging, 2023-2030 ($)
Table 36: North America Sensors in Healthcare Applications Market, Revenue & Volume,By Type, 2023-2030 ($)
Table 37: North America Sensors in Healthcare Applications Market, Revenue & Volume,By Application, 2023-2030 ($)
Table 38: South america Sensors in Healthcare Applications Market, Revenue & Volume,By Type, 2023-2030 ($)
Table 39: South america Sensors in Healthcare Applications Market, Revenue & Volume,By Application, 2023-2030 ($)
Table 40: Europe Sensors in Healthcare Applications Market, Revenue & Volume,By Type, 2023-2030 ($)
Table 41: Europe Sensors in Healthcare Applications Market, Revenue & Volume,By Application, 2023-2030 ($)
Table 42: APAC Sensors in Healthcare Applications Market, Revenue & Volume,By Type, 2023-2030 ($)
Table 43: APAC Sensors in Healthcare Applications Market, Revenue & Volume,By Application, 2023-2030 ($)
Table 44: Middle East & Africa Sensors in Healthcare Applications Market, Revenue & Volume,By Type, 2023-2030 ($)
Table 45: Middle East & Africa Sensors in Healthcare Applications Market, Revenue & Volume,By Application, 2023-2030 ($)
Table 46: Russia Sensors in Healthcare Applications Market, Revenue & Volume,By Type, 2023-2030 ($)
Table 47: Russia Sensors in Healthcare Applications Market, Revenue & Volume,By Application, 2023-2030 ($)
Table 48: Israel Sensors in Healthcare Applications Market, Revenue & Volume,By Type, 2023-2030 ($)
Table 49: Israel Sensors in Healthcare Applications Market, Revenue & Volume,By Application, 2023-2030 ($)
Table 50: Top Companies 2023 (US$)Sensors in Healthcare Applications Market, Revenue & Volume
Table 51: Product Launch 2023-2030Sensors in Healthcare Applications Market, Revenue & Volume
Table 52: Mergers & Acquistions 2023-2030Sensors in Healthcare Applications Market, Revenue & Volume
List of Figures
Figure 1: Overview of Sensors in Healthcare Applications Market 2023-2030
Figure 2: Market Share Analysis for Sensors in Healthcare Applications Market 2023 (US$)
Figure 3: Product Comparison in Sensors in Healthcare Applications Market 2023-2030 (US$)
Figure 4: End User Profile for Sensors in Healthcare Applications Market 2023-2030 (US$)
Figure 5: Patent Application and Grant in Sensors in Healthcare Applications Market 2013-2023* (US$)
Figure 6: Top 5 Companies Financial Analysis in Sensors in Healthcare Applications Market 2023-2030 (US$)
Figure 7: Market Entry Strategy in Sensors in Healthcare Applications Market 2023-2030
Figure 8: Ecosystem Analysis in Sensors in Healthcare Applications Market 2023
Figure 9: Average Selling Price in Sensors in Healthcare Applications Market 2023-2030
Figure 10: Top Opportunites in Sensors in Healthcare Applications Market 2023-2030
Figure 11: Market Life Cycle Analysis in Sensors in Healthcare Applications Market
Figure 12: GlobalBy TypeSensors in Healthcare Applications Market Revenue, 2023-2030 ($)
Figure 13: GlobalBy ApplicationSensors in Healthcare Applications Market Revenue, 2023-2030 ($)
Figure 14: Global Sensors in Healthcare Applications Market - By Geography
Figure 15: Global Sensors in Healthcare Applications Market Value & Volume, By Geography, 2023-2030 ($)
Figure 16: Global Sensors in Healthcare Applications Market CAGR, By Geography, 2023-2030 (%)
Figure 17: North America Sensors in Healthcare Applications Market Value & Volume, 2023-2030 ($)
Figure 18: US Sensors in Healthcare Applications Market Value & Volume, 2023-2030 ($)
Figure 19: US GDP and Population, 2023-2030 ($)
Figure 20: US GDP – Composition of 2023, By Sector of Origin
Figure 21: US Export and Import Value & Volume, 2023-2030 ($)
Figure 22: Canada Sensors in Healthcare Applications Market Value & Volume, 2023-2030 ($)
Figure 23: Canada GDP and Population, 2023-2030 ($)
Figure 24: Canada GDP – Composition of 2023, By Sector of Origin
Figure 25: Canada Export and Import Value & Volume, 2023-2030 ($)
Figure 26: Mexico Sensors in Healthcare Applications Market Value & Volume, 2023-2030 ($)
Figure 27: Mexico GDP and Population, 2023-2030 ($)
Figure 28: Mexico GDP – Composition of 2023, By Sector of Origin
Figure 29: Mexico Export and Import Value & Volume, 2023-2030 ($)
Figure 30: South America Sensors in Healthcare Applications Market Value & Volume, 2023-2030 ($)
Figure 31: Brazil Sensors in Healthcare Applications Market Value & Volume, 2023-2030 ($)
Figure 32: Brazil GDP and Population, 2023-2030 ($)
Figure 33: Brazil GDP – Composition of 2023, By Sector of Origin
Figure 34: Brazil Export and Import Value & Volume, 2023-2030 ($)
Figure 35: Venezuela Sensors in Healthcare Applications Market Value & Volume, 2023-2030 ($)
Figure 36: Venezuela GDP and Population, 2023-2030 ($)
Figure 37: Venezuela GDP – Composition of 2023, By Sector of Origin
Figure 38: Venezuela Export and Import Value & Volume, 2023-2030 ($)
Figure 39: Argentina Sensors in Healthcare Applications Market Value & Volume, 2023-2030 ($)
Figure 40: Argentina GDP and Population, 2023-2030 ($)
Figure 41: Argentina GDP – Composition of 2023, By Sector of Origin
Figure 42: Argentina Export and Import Value & Volume, 2023-2030 ($)
Figure 43: Ecuador Sensors in Healthcare Applications Market Value & Volume, 2023-2030 ($)
Figure 44: Ecuador GDP and Population, 2023-2030 ($)
Figure 45: Ecuador GDP – Composition of 2023, By Sector of Origin
Figure 46: Ecuador Export and Import Value & Volume, 2023-2030 ($)
Figure 47: Peru Sensors in Healthcare Applications Market Value & Volume, 2023-2030 ($)
Figure 48: Peru GDP and Population, 2023-2030 ($)
Figure 49: Peru GDP – Composition of 2023, By Sector of Origin
Figure 50: Peru Export and Import Value & Volume, 2023-2030 ($)
Figure 51: Colombia Sensors in Healthcare Applications Market Value & Volume, 2023-2030 ($)
Figure 52: Colombia GDP and Population, 2023-2030 ($)
Figure 53: Colombia GDP – Composition of 2023, By Sector of Origin
Figure 54: Colombia Export and Import Value & Volume, 2023-2030 ($)
Figure 55: Costa Rica Sensors in Healthcare Applications Market Value & Volume, 2023-2030 ($)
Figure 56: Costa Rica GDP and Population, 2023-2030 ($)
Figure 57: Costa Rica GDP – Composition of 2023, By Sector of Origin
Figure 58: Costa Rica Export and Import Value & Volume, 2023-2030 ($)
Figure 59: Europe Sensors in Healthcare Applications Market Value & Volume, 2023-2030 ($)
Figure 60: U.K Sensors in Healthcare Applications Market Value & Volume, 2023-2030 ($)
Figure 61: U.K GDP and Population, 2023-2030 ($)
Figure 62: U.K GDP – Composition of 2023, By Sector of Origin
Figure 63: U.K Export and Import Value & Volume, 2023-2030 ($)
Figure 64: Germany Sensors in Healthcare Applications Market Value & Volume, 2023-2030 ($)
Figure 65: Germany GDP and Population, 2023-2030 ($)
Figure 66: Germany GDP – Composition of 2023, By Sector of Origin
Figure 67: Germany Export and Import Value & Volume, 2023-2030 ($)
Figure 68: Italy Sensors in Healthcare Applications Market Value & Volume, 2023-2030 ($)
Figure 69: Italy GDP and Population, 2023-2030 ($)
Figure 70: Italy GDP – Composition of 2023, By Sector of Origin
Figure 71: Italy Export and Import Value & Volume, 2023-2030 ($)
Figure 72: France Sensors in Healthcare Applications Market Value & Volume, 2023-2030 ($)
Figure 73: France GDP and Population, 2023-2030 ($)
Figure 74: France GDP – Composition of 2023, By Sector of Origin
Figure 75: France Export and Import Value & Volume, 2023-2030 ($)
Figure 76: Netherlands Sensors in Healthcare Applications Market Value & Volume, 2023-2030 ($)
Figure 77: Netherlands GDP and Population, 2023-2030 ($)
Figure 78: Netherlands GDP – Composition of 2023, By Sector of Origin
Figure 79: Netherlands Export and Import Value & Volume, 2023-2030 ($)
Figure 80: Belgium Sensors in Healthcare Applications Market Value & Volume, 2023-2030 ($)
Figure 81: Belgium GDP and Population, 2023-2030 ($)
Figure 82: Belgium GDP – Composition of 2023, By Sector of Origin
Figure 83: Belgium Export and Import Value & Volume, 2023-2030 ($)
Figure 84: Spain Sensors in Healthcare Applications Market Value & Volume, 2023-2030 ($)
Figure 85: Spain GDP and Population, 2023-2030 ($)
Figure 86: Spain GDP – Composition of 2023, By Sector of Origin
Figure 87: Spain Export and Import Value & Volume, 2023-2030 ($)
Figure 88: Denmark Sensors in Healthcare Applications Market Value & Volume, 2023-2030 ($)
Figure 89: Denmark GDP and Population, 2023-2030 ($)
Figure 90: Denmark GDP – Composition of 2023, By Sector of Origin
Figure 91: Denmark Export and Import Value & Volume, 2023-2030 ($)
Figure 92: APAC Sensors in Healthcare Applications Market Value & Volume, 2023-2030 ($)
Figure 93: China Sensors in Healthcare Applications Market Value & Volume, 2023-2030
Figure 94: China GDP and Population, 2023-2030 ($)
Figure 95: China GDP – Composition of 2023, By Sector of Origin
Figure 96: China Export and Import Value & Volume, 2023-2030 ($)Sensors in Healthcare Applications Market China Export and Import Value & Volume, 2023-2030 ($)
Figure 97: Australia Sensors in Healthcare Applications Market Value & Volume, 2023-2030 ($)
Figure 98: Australia GDP and Population, 2023-2030 ($)
Figure 99: Australia GDP – Composition of 2023, By Sector of Origin
Figure 100: Australia Export and Import Value & Volume, 2023-2030 ($)
Figure 101: South Korea Sensors in Healthcare Applications Market Value & Volume, 2023-2030 ($)
Figure 102: South Korea GDP and Population, 2023-2030 ($)
Figure 103: South Korea GDP – Composition of 2023, By Sector of Origin
Figure 104: South Korea Export and Import Value & Volume, 2023-2030 ($)
Figure 105: India Sensors in Healthcare Applications Market Value & Volume, 2023-2030 ($)
Figure 106: India GDP and Population, 2023-2030 ($)
Figure 107: India GDP – Composition of 2023, By Sector of Origin
Figure 108: India Export and Import Value & Volume, 2023-2030 ($)
Figure 109: Taiwan Sensors in Healthcare Applications Market Value & Volume, 2023-2030 ($)
Figure 110: Taiwan GDP and Population, 2023-2030 ($)
Figure 111: Taiwan GDP – Composition of 2023, By Sector of Origin
Figure 112: Taiwan Export and Import Value & Volume, 2023-2030 ($)
Figure 113: Malaysia Sensors in Healthcare Applications Market Value & Volume, 2023-2030 ($)
Figure 114: Malaysia GDP and Population, 2023-2030 ($)
Figure 115: Malaysia GDP – Composition of 2023, By Sector of Origin
Figure 116: Malaysia Export and Import Value & Volume, 2023-2030 ($)
Figure 117: Hong Kong Sensors in Healthcare Applications Market Value & Volume, 2023-2030 ($)
Figure 118: Hong Kong GDP and Population, 2023-2030 ($)
Figure 119: Hong Kong GDP – Composition of 2023, By Sector of Origin
Figure 120: Hong Kong Export and Import Value & Volume, 2023-2030 ($)
Figure 121: Middle East & Africa Sensors in Healthcare Applications Market Middle East & Africa 3D Printing Market Value & Volume, 2023-2030 ($)
Figure 122: Russia Sensors in Healthcare Applications Market Value & Volume, 2023-2030 ($)
Figure 123: Russia GDP and Population, 2023-2030 ($)
Figure 124: Russia GDP – Composition of 2023, By Sector of Origin
Figure 125: Russia Export and Import Value & Volume, 2023-2030 ($)
Figure 126: Israel Sensors in Healthcare Applications Market Value & Volume, 2023-2030 ($)
Figure 127: Israel GDP and Population, 2023-2030 ($)
Figure 128: Israel GDP – Composition of 2023, By Sector of Origin
Figure 129: Israel Export and Import Value & Volume, 2023-2030 ($)
Figure 130: Entropy Share, By Strategies, 2023-2030* (%)Sensors in Healthcare Applications Market
Figure 131: Developments, 2023-2030*Sensors in Healthcare Applications Market
Figure 132: Company 1 Sensors in Healthcare Applications Market Net Revenue, By Years, 2023-2030* ($)
Figure 133: Company 1 Sensors in Healthcare Applications Market Net Revenue Share, By Business segments, 2023 (%)
Figure 134: Company 1 Sensors in Healthcare Applications Market Net Sales Share, By Geography, 2023 (%)
Figure 135: Company 2 Sensors in Healthcare Applications Market Net Revenue, By Years, 2023-2030* ($)
Figure 136: Company 2 Sensors in Healthcare Applications Market Net Revenue Share, By Business segments, 2023 (%)
Figure 137: Company 2 Sensors in Healthcare Applications Market Net Sales Share, By Geography, 2023 (%)
Figure 138: Company 3Sensors in Healthcare Applications Market Net Revenue, By Years, 2023-2030* ($)
Figure 139: Company 3Sensors in Healthcare Applications Market Net Revenue Share, By Business segments, 2023 (%)
Figure 140: Company 3Sensors in Healthcare Applications Market Net Sales Share, By Geography, 2023 (%)
Figure 141: Company 4 Sensors in Healthcare Applications Market Net Revenue, By Years, 2023-2030* ($)
Figure 142: Company 4 Sensors in Healthcare Applications Market Net Revenue Share, By Business segments, 2023 (%)
Figure 143: Company 4 Sensors in Healthcare Applications Market Net Sales Share, By Geography, 2023 (%)
Figure 144: Company 5 Sensors in Healthcare Applications Market Net Revenue, By Years, 2023-2030* ($)
Figure 145: Company 5 Sensors in Healthcare Applications Market Net Revenue Share, By Business segments, 2023 (%)
Figure 146: Company 5 Sensors in Healthcare Applications Market Net Sales Share, By Geography, 2023 (%)
Figure 147: Company 6 Sensors in Healthcare Applications Market Net Revenue, By Years, 2023-2030* ($)
Figure 148: Company 6 Sensors in Healthcare Applications Market Net Revenue Share, By Business segments, 2023 (%)
Figure 149: Company 6 Sensors in Healthcare Applications Market Net Sales Share, By Geography, 2023 (%)
Figure 150: Company 7 Sensors in Healthcare Applications Market Net Revenue, By Years, 2023-2030* ($)
Figure 151: Company 7 Sensors in Healthcare Applications Market Net Revenue Share, By Business segments, 2023 (%)
Figure 152: Company 7 Sensors in Healthcare Applications Market Net Sales Share, By Geography, 2023 (%)
Figure 153: Company 8 Sensors in Healthcare Applications Market Net Revenue, By Years, 2023-2030* ($)
Figure 154: Company 8 Sensors in Healthcare Applications Market Net Revenue Share, By Business segments, 2023 (%)
Figure 155: Company 8 Sensors in Healthcare Applications Market Net Sales Share, By Geography, 2023 (%)
Figure 156: Company 9 Sensors in Healthcare Applications Market Net Revenue, By Years, 2023-2030* ($)
Figure 157: Company 9 Sensors in Healthcare Applications Market Net Revenue Share, By Business segments, 2023 (%)
Figure 158: Company 9 Sensors in Healthcare Applications Market Net Sales Share, By Geography, 2023 (%)
Figure 159: Company 10 Sensors in Healthcare Applications Market Net Revenue, By Years, 2023-2030* ($)
Figure 160: Company 10 Sensors in Healthcare Applications Market Net Revenue Share, By Business segments, 2023 (%)
Figure 161: Company 10 Sensors in Healthcare Applications Market Net Sales Share, By Geography, 2023 (%)
Figure 162: Company 11 Sensors in Healthcare Applications Market Net Revenue, By Years, 2023-2030* ($)
Figure 163: Company 11 Sensors in Healthcare Applications Market Net Revenue Share, By Business segments, 2023 (%)
Figure 164: Company 11 Sensors in Healthcare Applications Market Net Sales Share, By Geography, 2023 (%)
Figure 165: Company 12 Sensors in Healthcare Applications Market Net Revenue, By Years, 2023-2030* ($)
Figure 166: Company 12 Sensors in Healthcare Applications Market Net Revenue Share, By Business segments, 2023 (%)
Figure 167: Company 12 Sensors in Healthcare Applications Market Net Sales Share, By Geography, 2023 (%)
Figure 168: Company 13Sensors in Healthcare Applications Market Net Revenue, By Years, 2023-2030* ($)
Figure 169: Company 13Sensors in Healthcare Applications Market Net Revenue Share, By Business segments, 2023 (%)
Figure 170: Company 13Sensors in Healthcare Applications Market Net Sales Share, By Geography, 2023 (%)
Figure 171: Company 14 Sensors in Healthcare Applications Market Net Revenue, By Years, 2023-2030* ($)
Figure 172: Company 14 Sensors in Healthcare Applications Market Net Revenue Share, By Business segments, 2023 (%)
Figure 173: Company 14 Sensors in Healthcare Applications Market Net Sales Share, By Geography, 2023 (%)
Figure 174: Company 15 Sensors in Healthcare Applications Market Net Revenue, By Years, 2023-2030* ($)
Figure 175: Company 15 Sensors in Healthcare Applications Market Net Revenue Share, By Business segments, 2023 (%)
Figure 176: Company 15 Sensors in Healthcare Applications Market Net Sales Share, By Geography, 2023 (%)