 Email
Email Print
Print


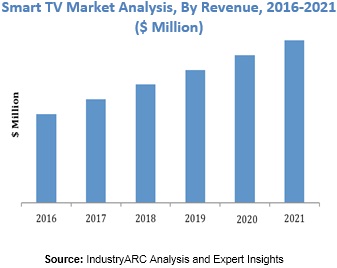
Smart TV Market Overview:
According to a Cisco study, in the year 2019, online video streaming will account for 90% of the Internet traffic[1]. The telecommunications marketplace has not missed this update, and capitalized majorly on this factor. Smart TVs, one of the latest and most important electronic inventions, has made entertainment streaming a cakewalk. Smart TV market companies and online streaming services have developed a symbiotic relationship where the latter benefits from the large screens, and easy connectivity, and smart TVs make use of the plethora of options offered by streaming services. The global smart TV market size in 2018 was between $130 billion to $140 billion. The market is also projected to grow at a notable CAGR of 8%-10% during the forecast period of 2019-2025.
Smart TV Market Outlook:
Any television that can be connected to the Internet, and used as a standalone device, is a smart TV. Though companies these days are selling intelligent TVs as a separate product, a regular TV with a set-top box can also be converted into a smart TV. Over-the-top content offered by online streaming services can be streamed seamlessly on smart TVs by connecting to the internet. This service is thoroughly utilized by consumers owing to the on demand streaming media facility that can be enjoyed on a large screen instead of being limited to our laptops, or mobile phones. As a result of China actively stealing production share of the smart TV market, Asia Pacific region leads the smart TV market globally with a regional share of 35%. 46 to 55 inches sized smart TVs are in extensive demand because of their screen size, as well as the accessibility their offer during global sports events like the FIFA World Cup, or the Olympics.
Smart TV Market Growth Drivers:
- Rising Demand for Personalized Entertainment
Gone are the days when people would flock to cinema halls, or flip through their satellite TV channels. We have entered the times of online streaming on a big screen. Smart TV provides that facility by providing internet connectivity which helps consumers in subscribing to their favorite online streaming services like Netflix, and Amazon Prime.
Global adoption of advanced technologies, and rising technological advancement will bolster the smart TV market growth.
Smart TV Market Challenges:
The most prominent challenge faced by the market is the taxation of smart TVs. In India for example, smart TVs are placed under the highest tax slab of the Goods and Services Tax. Consumers are supposed to pay 28% of the already exorbitant rates at which the TVs are sold. Relaxation of taxation will greatly benefit the market, and help fight this challenge.
Smart TV Market Key Players Perspective:
Key market players are equipping smart TVs with Artificial Intelligence in order to make the experience more seamless. Consumers can now communicate with their TVs, and more often than not, don’t need a remote control.
Key market players in the smart TV market are Sony Corporation, LG Electronics, Inc., TCL Corporation, and Koninklijke Philips N.V., Haier Electronics Group Co., Ltd, Intex Technologies, LeEco, Panasonic Corporation, Sansui Electric Co. Ltd., Samsung Electronics, Toshiba Corporation, and Videocon Industries Limited.
Smart TV Market Trends:
Smart TV Prices Will Fall Off In The Upcoming Years
Smart TVs share histories of what the consumer is watching with online streaming websites in order to present more relatable content. Interactive advertisement revenue is also shared between the TV companies, and the marketers, thus establishing a symbiotic relationship. Easier access to multiple shows, and similar services elevates consumer interest, which has led to virtually all sold televisions these days to be smart TVs. This will disrupt the market, and lead to lower prices with robust sales in the upcoming years.
Smart TV Market Research Scope:
The base year of the study is 2018, with forecast done up to 2025. The study presents a thorough analysis of the competitive landscape, taking into account the market shares of the leading companies. It also provides information on unit shipments. These provide the key market participants with the necessary business intelligence and help them understand the future of the Smart TV Market. The assessment includes the forecast, an overview of the competitive structure, the market shares of the competitors, as well as the market trends, market demands, market drivers, market challenges, and product analysis. The market drivers and restraints have been assessed to fathom their impact over the forecast period. This report further identifies the key opportunities for growth while also detailing the key challenges and possible threats. The key areas of focus include the types of cheese in the Smart TV Market, and their specific applications in different areas.
Smart TV Market Report: Industry Coverage
The Smart TV Market report also analyzes the major geographic regions for the market as well as the major countries for the market in these regions. The regions and countries covered in the study include:
- North America: The U.S., Canada, Mexico
- South America: Brazil, Venezuela, Argentina, Ecuador, Peru, Colombia, Costa Rica
- Europe: The U.K., Germany, Italy, France, The Netherlands, Belgium, Spain, Denmark
- APAC: China, Japan, Australia, South Korea, India, Taiwan, Malaysia, Hong Kong
- Middle East and Africa: Israel, South Africa, Saudi Arabia
Key Questions Addressed in the Smart TV Market Report
Is the market demand for the Smart TV growing? How long will it continue to grow and at what rate?
Which type of home security system presents the major growth opportunities?
Is there a possibility for change in the market structure over time?
Are additional developments needed for the existing product or services offerings or do the existing products meet the customer demands?
Do the key vendors look for partnerships to expand their businesses with respect to geography or product?
What are the short-term, long-term, and medium-term growth drivers for the market?
What are the short-term, medium-term, and long-term challenges for the market?
What are the short-term, medium-term, and long-term opportunities for the market
Who are the top players/companies of the market?
What are the recent innovations in the market?
How many patents have been filed by the leading players?
What are the types of patents filed by the leading players?
What is our Vision 2030 for the Smart TV market?
A Few Focus Points Of This Research Are Given Below:
- Give a deep-dive analysis of the key operational strategies with focus on the corporate structure, R&D strategies, localization strategies, production capabilities, and sales performance of various companies
- Provide an overview of the product portfolio, including product planning, development, and positioning
- Discuss the role of technology companies in partnerships
- Explore the regional sales activities
- Analyze the market size and giving the forecast for current and future global the Smart TV market during the forecast 2018–2023
- Analyze the competitive factors, competitors’ market shares, product capabilities, and supply chain structures
1. Smart TV Market Overview
1.1 Definitions and Scope
2. Smart TV Executive Summary
2.1 Market Revenue, Market Size and Key Trends by Company
2.2 Key trends by type
3. Smart TV Market Comparative analysis
3.1 Product Benchmarking
3.2 Top 5 Financials Analysis
3.3 Patent Analysis
3.4 Pricing Analysis
3.5 Technology Roadmap
4. Smart TV Market Forces
4.1 Market Drivers
4.2 Market Constraints
4.3 Market Opportunities
4.4 Porters five force model
4.4.1 Bargaining power of suppliers
4.4.2 Bargaining powers of customers
4.4.3 Threat of new entrants
4.4.4 Rivalry among existing players
4.4.5 Threat of substitutes
5. Smart TV Market - By Screen Type
5.1 Flat Screen
5.2 Curved Screen
5.3 Foldable screen
6. Smart TV Market - By Refresh Rate
6.1 60Hz
6.2 120Hz
6.3 240Hz
6.4 Others
7. Smart TV Market – By Resolution
7.1 4K UHD TV
7.2 Full HD TV
7.3 HDTV
7.4 8K TV
7.5 Others
8. Smart TV Market– By Panel Type
8.1 LED
8.2 LCD
8.3 OLED
8.4 QLED
8.5 Others
9. Smart TV Market – By Distribution Model
9.1 Online
9.2 Offline
10. Smart TV Market – By Screen Size
10.1 Less than 32inches
10.2 32-45 inches
10.3 46-55 inches
10.4 56-65 inches
10.5 Greater than 65 inches
11. Smart TV Market – By Platform
11.1 Android
11.2 Roku
11.3 Web OS
11.4 iOS
11.5 Tizen
11.6 Others
12. Smart TV Market – By End-user
12.1 Residential
12.1.1 Video gaming
12.1.2 Entertainment
12.2 Transportation
12.2.1 Railways
12.2.2 Airports
12.2.2.1 Domestic
12.2.2.2 International
12.3 Education
12.4 Commercial
12.4.1 Advertising
12.4.2 Others
12.5 Telecommunications
12.6 Others
13. Smart TV Market – By Geography
13.1 North America
13.1.1 U.S
13.1.2 Canada
13.1.3 Mexico
13.2 South America
13.2.1 Brazil
13.2.2 Argentina
13.2.3 Chile
13.2.4 Peru
13.2.5 Rest of South America
13.3 Europe
13.3.1 U.K.
13.3.2 Germany
13.3.3 Italy
13.3.4 France
13.3.5 Russia
13.3.6 Spain
13.3.7 Others
13.4 Asia-Pacific
13.4.1 China
13.4.2 Australia
13.4.3 Japan
13.4.4 South Korea
13.4.5 India
13.4.6 Others
13.5 Rest of the World
13.5.1 Middle East
13.5.2 Africa
14. Smart TV Market Entropy
15. Smart TV Market Company Analysis
15.1 Market Share,Company Revenue,Solution & Services,M&A,Developments
15.2 Company 1
15.3 Company 2
15.4 Company 3
15.5 Company 4
15.6 Company 5
15.7 Company 6
15.8 Company 7
15.9 Company 8
15.10 Company 9
15.11 Company10 and more
"*Financials would be provided on a best efforts basis for private companies
16. Smart TV Market -Appendix
16.1. Abbreviations
16.2. Sources
17. Smart TV Market -Methodology Premium
17.1. Research Methodology
17.1.1. Company Expert Interviews
17.1.2. Industry Databases
17.1.3. Associations
17.1.4. Company News
17.1.5. Company Annual Reports
17.1.6. Application Trends
17.1.7. New Products and Product database
17.1.8. Company Transcripts
17.1.9. R&D Trends
17.1.10. Key Opinion Leaders Interviews
17.1.11. Supply and Demand Trends
List of Tables:
Table 1: Smart TV Market Overview 2023-2030
Table 2: Smart TV Market Leader Analysis 2023-2030 (US$)
Table 3: Smart TV Market Product Analysis 2023-2030 (US$)
Table 4: Smart TV Market End User Analysis 2023-2030 (US$)
Table 5: Smart TV Market Patent Analysis 2013-2023* (US$)
Table 6: Smart TV Market Financial Analysis 2023-2030 (US$)
Table 7: Smart TV Market Driver Analysis 2023-2030 (US$)
Table 8: Smart TV Market Challenges Analysis 2023-2030 (US$)
Table 9: Smart TV Market Constraint Analysis 2023-2030 (US$)
Table 10: Smart TV Market Supplier Bargaining Power Analysis 2023-2030 (US$)
Table 11: Smart TV Market Buyer Bargaining Power Analysis 2023-2030 (US$)
Table 12: Smart TV Market Threat of Substitutes Analysis 2023-2030 (US$)
Table 13: Smart TV Market Threat of New Entrants Analysis 2023-2030 (US$)
Table 14: Smart TV Market Degree of Competition Analysis 2023-2030 (US$)
Table 15: Smart TV Market Value Chain Analysis 2023-2030 (US$)
Table 16: Smart TV Market Pricing Analysis 2023-2030 (US$)
Table 17: Smart TV Market Opportunities Analysis 2023-2030 (US$)
Table 18: Smart TV Market Product Life Cycle Analysis 2023-2030 (US$)
Table 19: Smart TV Market Supplier Analysis 2023-2030 (US$)
Table 20: Smart TV Market Distributor Analysis 2023-2030 (US$)
Table 21: Smart TV Market Trend Analysis 2023-2030 (US$)
Table 22: Smart TV Market Size 2023 (US$)
Table 23: Smart TV Market Forecast Analysis 2023-2030 (US$)
Table 24: Smart TV Market Sales Forecast Analysis 2023-2030 (Units)
Table 25: Smart TV Market, Revenue & Volume, By Components, 2023-2030 ($)
Table 26: Smart TV Market By Components, Revenue & Volume, By Camera, 2023-2030 ($)
Table 27: Smart TV Market By Components, Revenue & Volume, By Keypad, 2023-2030 ($)
Table 28: Smart TV Market By Components, Revenue & Volume, By Wireless LAN Adapter, 2023-2030 ($)
Table 29: Smart TV Market By Components, Revenue & Volume, By Software, 2023-2030 ($)
Table 30: Smart TV Market, Revenue & Volume, By Application, 2023-2030 ($)
Table 31: Smart TV Market By Application, Revenue & Volume, By Home Entertainment, 2023-2030 ($)
Table 32: Smart TV Market By Application, Revenue & Volume, By Education, 2023-2030 ($)
Table 33: Smart TV Market By Application, Revenue & Volume, By Corporate Sector, 2023-2030 ($)
Table 34: North America Smart TV Market, Revenue & Volume, By Components, 2023-2030 ($)
Table 35: North America Smart TV Market, Revenue & Volume, By Application, 2023-2030 ($)
Table 36: South america Smart TV Market, Revenue & Volume, By Components, 2023-2030 ($)
Table 37: South america Smart TV Market, Revenue & Volume, By Application, 2023-2030 ($)
Table 38: Europe Smart TV Market, Revenue & Volume, By Components, 2023-2030 ($)
Table 39: Europe Smart TV Market, Revenue & Volume, By Application, 2023-2030 ($)
Table 40: APAC Smart TV Market, Revenue & Volume, By Components, 2023-2030 ($)
Table 41: APAC Smart TV Market, Revenue & Volume, By Application, 2023-2030 ($)
Table 42: Middle East & Africa Smart TV Market, Revenue & Volume, By Components, 2023-2030 ($)
Table 43: Middle East & Africa Smart TV Market, Revenue & Volume, By Application, 2023-2030 ($)
Table 44: Russia Smart TV Market, Revenue & Volume, By Components, 2023-2030 ($)
Table 45: Russia Smart TV Market, Revenue & Volume, By Application, 2023-2030 ($)
Table 46: Israel Smart TV Market, Revenue & Volume, By Components, 2023-2030 ($)
Table 47: Israel Smart TV Market, Revenue & Volume, By Application, 2023-2030 ($)
Table 48: Top Companies 2023 (US$)Smart TV Market, Revenue & Volume
Table 49: Product Launch 2023-2030Smart TV Market, Revenue & Volume
Table 50: Mergers & Acquistions 2023-2030Smart TV Market, Revenue & Volume
List of Figures:
Figure 1: Overview of Smart TV Market 2023-2030
Figure 2: Market Share Analysis for Smart TV Market 2023 (US$)
Figure 3: Product Comparison in Smart TV Market 2023-2030 (US$)
Figure 4: End User Profile for Smart TV Market 2023-2030 (US$)
Figure 5: Patent Application and Grant in Smart TV Market 2013-2023* (US$)
Figure 6: Top 5 Companies Financial Analysis in Smart TV Market 2023-2030 (US$)
Figure 7: Market Entry Strategy in Smart TV Market 2023-2030
Figure 8: Ecosystem Analysis in Smart TV Market 2023
Figure 9: Average Selling Price in Smart TV Market 2023-2030
Figure 10: Top Opportunites in Smart TV Market 2023-2030
Figure 11: Market Life Cycle Analysis in Smart TV Market
Figure 12: GlobalBy ComponentsSmart TV Market Revenue, 2023-2030 ($)
Figure 13: GlobalBy ApplicationSmart TV Market Revenue, 2023-2030 ($)
Figure 14: Global Smart TV Market - By Geography
Figure 15: Global Smart TV Market Value & Volume, By Geography, 2023-2030 ($)
Figure 16: Global Smart TV Market CAGR, By Geography, 2023-2030 (%)
Figure 17: North America Smart TV Market Value & Volume, 2023-2030 ($)
Figure 18: US Smart TV Market Value & Volume, 2023-2030 ($)
Figure 19: US GDP and Population, 2023-2030 ($)
Figure 20: US GDP – Composition of 2023, By Sector of Origin
Figure 21: US Export and Import Value & Volume, 2023-2030 ($)
Figure 22: Canada Smart TV Market Value & Volume, 2023-2030 ($)
Figure 23: Canada GDP and Population, 2023-2030 ($)
Figure 24: Canada GDP – Composition of 2023, By Sector of Origin
Figure 25: Canada Export and Import Value & Volume, 2023-2030 ($)
Figure 26: Mexico Smart TV Market Value & Volume, 2023-2030 ($)
Figure 27: Mexico GDP and Population, 2023-2030 ($)
Figure 28: Mexico GDP – Composition of 2023, By Sector of Origin
Figure 29: Mexico Export and Import Value & Volume, 2023-2030 ($)
Figure 30: South America Smart TV Market Value & Volume, 2023-2030 ($)
Figure 31: Brazil Smart TV Market Value & Volume, 2023-2030 ($)
Figure 32: Brazil GDP and Population, 2023-2030 ($)
Figure 33: Brazil GDP – Composition of 2023, By Sector of Origin
Figure 34: Brazil Export and Import Value & Volume, 2023-2030 ($)
Figure 35: Venezuela Smart TV Market Value & Volume, 2023-2030 ($)
Figure 36: Venezuela GDP and Population, 2023-2030 ($)
Figure 37: Venezuela GDP – Composition of 2023, By Sector of Origin
Figure 38: Venezuela Export and Import Value & Volume, 2023-2030 ($)
Figure 39: Argentina Smart TV Market Value & Volume, 2023-2030 ($)
Figure 40: Argentina GDP and Population, 2023-2030 ($)
Figure 41: Argentina GDP – Composition of 2023, By Sector of Origin
Figure 42: Argentina Export and Import Value & Volume, 2023-2030 ($)
Figure 43: Ecuador Smart TV Market Value & Volume, 2023-2030 ($)
Figure 44: Ecuador GDP and Population, 2023-2030 ($)
Figure 45: Ecuador GDP – Composition of 2023, By Sector of Origin
Figure 46: Ecuador Export and Import Value & Volume, 2023-2030 ($)
Figure 47: Peru Smart TV Market Value & Volume, 2023-2030 ($)
Figure 48: Peru GDP and Population, 2023-2030 ($)
Figure 49: Peru GDP – Composition of 2023, By Sector of Origin
Figure 50: Peru Export and Import Value & Volume, 2023-2030 ($)
Figure 51: Colombia Smart TV Market Value & Volume, 2023-2030 ($)
Figure 52: Colombia GDP and Population, 2023-2030 ($)
Figure 53: Colombia GDP – Composition of 2023, By Sector of Origin
Figure 54: Colombia Export and Import Value & Volume, 2023-2030 ($)
Figure 55: Costa Rica Smart TV Market Value & Volume, 2023-2030 ($)
Figure 56: Costa Rica GDP and Population, 2023-2030 ($)
Figure 57: Costa Rica GDP – Composition of 2023, By Sector of Origin
Figure 58: Costa Rica Export and Import Value & Volume, 2023-2030 ($)
Figure 59: Europe Smart TV Market Value & Volume, 2023-2030 ($)
Figure 60: U.K Smart TV Market Value & Volume, 2023-2030 ($)
Figure 61: U.K GDP and Population, 2023-2030 ($)
Figure 62: U.K GDP – Composition of 2023, By Sector of Origin
Figure 63: U.K Export and Import Value & Volume, 2023-2030 ($)
Figure 64: Germany Smart TV Market Value & Volume, 2023-2030 ($)
Figure 65: Germany GDP and Population, 2023-2030 ($)
Figure 66: Germany GDP – Composition of 2023, By Sector of Origin
Figure 67: Germany Export and Import Value & Volume, 2023-2030 ($)
Figure 68: Italy Smart TV Market Value & Volume, 2023-2030 ($)
Figure 69: Italy GDP and Population, 2023-2030 ($)
Figure 70: Italy GDP – Composition of 2023, By Sector of Origin
Figure 71: Italy Export and Import Value & Volume, 2023-2030 ($)
Figure 72: France Smart TV Market Value & Volume, 2023-2030 ($)
Figure 73: France GDP and Population, 2023-2030 ($)
Figure 74: France GDP – Composition of 2023, By Sector of Origin
Figure 75: France Export and Import Value & Volume, 2023-2030 ($)
Figure 76: Netherlands Smart TV Market Value & Volume, 2023-2030 ($)
Figure 77: Netherlands GDP and Population, 2023-2030 ($)
Figure 78: Netherlands GDP – Composition of 2023, By Sector of Origin
Figure 79: Netherlands Export and Import Value & Volume, 2023-2030 ($)
Figure 80: Belgium Smart TV Market Value & Volume, 2023-2030 ($)
Figure 81: Belgium GDP and Population, 2023-2030 ($)
Figure 82: Belgium GDP – Composition of 2023, By Sector of Origin
Figure 83: Belgium Export and Import Value & Volume, 2023-2030 ($)
Figure 84: Spain Smart TV Market Value & Volume, 2023-2030 ($)
Figure 85: Spain GDP and Population, 2023-2030 ($)
Figure 86: Spain GDP – Composition of 2023, By Sector of Origin
Figure 87: Spain Export and Import Value & Volume, 2023-2030 ($)
Figure 88: Denmark Smart TV Market Value & Volume, 2023-2030 ($)
Figure 89: Denmark GDP and Population, 2023-2030 ($)
Figure 90: Denmark GDP – Composition of 2023, By Sector of Origin
Figure 91: Denmark Export and Import Value & Volume, 2023-2030 ($)
Figure 92: APAC Smart TV Market Value & Volume, 2023-2030 ($)
Figure 93: China Smart TV Market Value & Volume, 2023-2030
Figure 94: China GDP and Population, 2023-2030 ($)
Figure 95: China GDP – Composition of 2023, By Sector of Origin
Figure 96: China Export and Import Value & Volume, 2023-2030 ($)Smart TV Market China Export and Import Value & Volume, 2023-2030 ($)
Figure 97: Australia Smart TV Market Value & Volume, 2023-2030 ($)
Figure 98: Australia GDP and Population, 2023-2030 ($)
Figure 99: Australia GDP – Composition of 2023, By Sector of Origin
Figure 100: Australia Export and Import Value & Volume, 2023-2030 ($)
Figure 101: South Korea Smart TV Market Value & Volume, 2023-2030 ($)
Figure 102: South Korea GDP and Population, 2023-2030 ($)
Figure 103: South Korea GDP – Composition of 2023, By Sector of Origin
Figure 104: South Korea Export and Import Value & Volume, 2023-2030 ($)
Figure 105: India Smart TV Market Value & Volume, 2023-2030 ($)
Figure 106: India GDP and Population, 2023-2030 ($)
Figure 107: India GDP – Composition of 2023, By Sector of Origin
Figure 108: India Export and Import Value & Volume, 2023-2030 ($)
Figure 109: Taiwan Smart TV Market Value & Volume, 2023-2030 ($)
Figure 110: Taiwan GDP and Population, 2023-2030 ($)
Figure 111: Taiwan GDP – Composition of 2023, By Sector of Origin
Figure 112: Taiwan Export and Import Value & Volume, 2023-2030 ($)
Figure 113: Malaysia Smart TV Market Value & Volume, 2023-2030 ($)
Figure 114: Malaysia GDP and Population, 2023-2030 ($)
Figure 115: Malaysia GDP – Composition of 2023, By Sector of Origin
Figure 116: Malaysia Export and Import Value & Volume, 2023-2030 ($)
Figure 117: Hong Kong Smart TV Market Value & Volume, 2023-2030 ($)
Figure 118: Hong Kong GDP and Population, 2023-2030 ($)
Figure 119: Hong Kong GDP – Composition of 2023, By Sector of Origin
Figure 120: Hong Kong Export and Import Value & Volume, 2023-2030 ($)
Figure 121: Middle East & Africa Smart TV Market Middle East & Africa 3D Printing Market Value & Volume, 2023-2030 ($)
Figure 122: Russia Smart TV Market Value & Volume, 2023-2030 ($)
Figure 123: Russia GDP and Population, 2023-2030 ($)
Figure 124: Russia GDP – Composition of 2023, By Sector of Origin
Figure 125: Russia Export and Import Value & Volume, 2023-2030 ($)
Figure 126: Israel Smart TV Market Value & Volume, 2023-2030 ($)
Figure 127: Israel GDP and Population, 2023-2030 ($)
Figure 128: Israel GDP – Composition of 2023, By Sector of Origin
Figure 129: Israel Export and Import Value & Volume, 2023-2030 ($)
Figure 130: Entropy Share, By Strategies, 2023-2030* (%)Smart TV Market
Figure 131: Developments, 2023-2030*Smart TV Market
Figure 132: Company 1 Smart TV Market Net Revenue, By Years, 2023-2030* ($)
Figure 133: Company 1 Smart TV Market Net Revenue Share, By Business segments, 2023 (%)
Figure 134: Company 1 Smart TV Market Net Sales Share, By Geography, 2023 (%)
Figure 135: Company 2 Smart TV Market Net Revenue, By Years, 2023-2030* ($)
Figure 136: Company 2 Smart TV Market Net Revenue Share, By Business segments, 2023 (%)
Figure 137: Company 2 Smart TV Market Net Sales Share, By Geography, 2023 (%)
Figure 138: Company 3 Smart TV Market Net Revenue, By Years, 2023-2030* ($)
Figure 139: Company 3 Smart TV Market Net Revenue Share, By Business segments, 2023 (%)
Figure 140: Company 3 Smart TV Market Net Sales Share, By Geography, 2023 (%)
Figure 141: Company 4 Smart TV Market Net Revenue, By Years, 2023-2030* ($)
Figure 142: Company 4 Smart TV Market Net Revenue Share, By Business segments, 2023 (%)
Figure 143: Company 4 Smart TV Market Net Sales Share, By Geography, 2023 (%)
Figure 144: Company 5 Smart TV Market Net Revenue, By Years, 2023-2030* ($)
Figure 145: Company 5 Smart TV Market Net Revenue Share, By Business segments, 2023 (%)
Figure 146: Company 5 Smart TV Market Net Sales Share, By Geography, 2023 (%)
Figure 147: Company 6 Smart TV Market Net Revenue, By Years, 2023-2030* ($)
Figure 148: Company 6 Smart TV Market Net Revenue Share, By Business segments, 2023 (%)
Figure 149: Company 6 Smart TV Market Net Sales Share, By Geography, 2023 (%)
Figure 150: Company 7 Smart TV Market Net Revenue, By Years, 2023-2030* ($)
Figure 151: Company 7 Smart TV Market Net Revenue Share, By Business segments, 2023 (%)
Figure 152: Company 7 Smart TV Market Net Sales Share, By Geography, 2023 (%)
Figure 153: Company 8 Smart TV Market Net Revenue, By Years, 2023-2030* ($)
Figure 154: Company 8 Smart TV Market Net Revenue Share, By Business segments, 2023 (%)
Figure 155: Company 8 Smart TV Market Net Sales Share, By Geography, 2023 (%)
Figure 156: Company 9 Smart TV Market Net Revenue, By Years, 2023-2030* ($)
Figure 157: Company 9 Smart TV Market Net Revenue Share, By Business segments, 2023 (%)
Figure 158: Company 9 Smart TV Market Net Sales Share, By Geography, 2023 (%)
Figure 159: Company 10 Smart TV Market Net Revenue, By Years, 2023-2030* ($)
Figure 160: Company 10 Smart TV Market Net Revenue Share, By Business segments, 2023 (%)
Figure 161: Company 10 Smart TV Market Net Sales Share, By Geography, 2023 (%)
Figure 162: Company 11 Smart TV Market Net Revenue, By Years, 2023-2030* ($)
Figure 163: Company 11 Smart TV Market Net Revenue Share, By Business segments, 2023 (%)
Figure 164: Company 11 Smart TV Market Net Sales Share, By Geography, 2023 (%)
Figure 165: Company 12 Smart TV Market Net Revenue, By Years, 2023-2030* ($)
Figure 166: Company 12 Smart TV Market Net Revenue Share, By Business segments, 2023 (%)
Figure 167: Company 12 Smart TV Market Net Sales Share, By Geography, 2023 (%)
Figure 168: Company 13 Smart TV Market Net Revenue, By Years, 2023-2030* ($)
Figure 169: Company 13 Smart TV Market Net Revenue Share, By Business segments, 2023 (%)
Figure 170: Company 13 Smart TV Market Net Sales Share, By Geography, 2023 (%)
Figure 171: Company 14 Smart TV Market Net Revenue, By Years, 2023-2030* ($)
Figure 172: Company 14 Smart TV Market Net Revenue Share, By Business segments, 2023 (%)
Figure 173: Company 14 Smart TV Market Net Sales Share, By Geography, 2023 (%)
Figure 174: Company 15 Smart TV Market Net Revenue, By Years, 2023-2030* ($)
Figure 175: Company 15 Smart TV Market Net Revenue Share, By Business segments, 2023 (%)
Figure 176: Company 15 Smart TV Market Net Sales Share, By Geography, 2023 (%)