 Email
Email Print
Print


Solid State Transformer Market - Forecast(2024 - 2030)
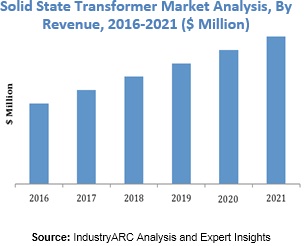
Solid state transformer is an emerging technology that can deliver the bi-directional power flow and reactive power compensation in the power distribution systems. Power generation, transmission, and distribution are the three main constituents of the modern power system, in which the solid-state transformer plays a major role for flexible operations. In addition, they are widely adopted in various applications, which would facilitate the smooth transition from AC to DC and DC to AC, besides voltage conversion. Companies operating in this market are looking for rising investments in R&D which further enables to deliver more efficient solid-state transformers, thus enhancing the growth during the forecast period.
Solid State Transformer market has been segmented by components, configurations, products, and end user industry. Based on the components the market is segmented into converters, switches, high-frequency transformers, and others. On the basis of configurations, the market is classified into single stage SST, 2-stage with LVDC link, 2-stage with HVDC link, three stage SST, and others. By products, the market is classified into distribution, traction, and power solid state transformer. In terms of applications, the market is distrusted into traction locomotive, power grid, and others.
Increasing demand for infiltration of renewable energy will likely to propel the solid-state transformers market during the forecast period. Moreover, increasing emphasis for renewable energy source, and growing use of traction locomotives & electric vehicles for public transport are also among the factor which are attributing to the growth in the market. However, high cost of solid state transformers and inadequate testing infrastructure are expected to hamper the market growth.
The overall market is also presented from the perspective of different geographic regions and the key countries in each region. The APAC region will continue to be a dominant market during the forecast period. The current vendors operating in the market will be investing in the APAC region as the number of manufacturing industries are high in the region, thus creating the demand for solid state transformers globally.
Sample Companies Profiled in this Report are:
- ABB Ltd.
- Alstom SA
- Amantys Limited
- Eaton Corporation PLC
- General Electric Co.
- 10+
The methodology for estimating the solid-state transformer market involved demand in the various industries. The segmentations have been cross-mapped extensively to understand various market dynamics. Simultaneously, the companies involved at integration and distribution level were also studied from the perspective of their services, geographical presence, annual turnover and few other parameters to substantiate the estimations. All these estimations were further validated through primary research and industry experts.
1. Solid State Transformer – Market Overview
1.1. Introduction
1.2. Market Scope
1.3. Stakeholders
2. Solid State Transformer Market – Executive Summary
3. Solid State Transformer Market – Market Landscape
3.1. Market Share Analysis
3.1.1. Comprehensive Market Share Analysis
3.2. Comparative Analysis
3.2.1. Competitor Benchmarking
3.2.2. Competitor Financial Analysis
3.2.3. Patent Analysis
3.2.4. End-User Profiling
4. Solid State Transformer Market– Market Forces
4.1. Market Drivers
4.2. Market Constraints
4.3. Market Challenges
4.4. Attractiveness of the Solid State Transformer Market Industry
4.4.1. Power of Suppliers
4.4.2. Power of Customers
4.4.3. Threat of New entrants
4.4.4. Threat of Substitution
4.4.5. Degree of Competition
5. Solid State Transformer Market– Strategic Analysis
5.1. Value Chain Analysis
5.2. Pricing Analysis
5.2.1. Influence Factor Analysis
5.2.2. Forecast of Prices
5.3. Opportunities Analysis
5.4. Life Cycle Analysis
5.5. Suppliers & Distributers
6. Solid State Transformer Market– By Components
6.1. Introduction
6.2. Converters
6.2.1. AC-DC
6.2.2. DC-DC
6.2.3. DC-AC
6.2.4. AC-AC
6.3. Switches
6.4. High-frequency Transformers
6.5. Others
7. Solid State Transformer Market– By Configurations
7.1. Single Stage SST
7.2. Two Stage with LVDC Link
7.3. Two Stage with HVDC Link
7.4. Three Stage SST
7.5. Others
8. Solid State Transformer Market– By Products
8.1. Distribution Solid State Transformer
8.2. Traction Solid State Transformer
8.3. Power Solid State Transformer
9. Solid State Transformer Market– By Applications
9.1. Introduction
9.2. Traction locomotive
9.3. Power Grid
9.4. EV Charging Stations
9.5. Power Generation
9.6. Others
10. Solid State Transformer Market– By Geography
10.1. Introduction
10.2. North America
10.2.1. U.S.
10.2.2. Canada
10.2.3. Mexico
10.3. Europe
10.3.1. Germany
10.3.2. U.K.
10.3.3. France
10.3.4. Italy
10.3.5. Rest of Europe
10.4. Asia-Pacific
10.4.1. China
10.4.2. South Korea
10.4.3. Japan
10.4.4. India
10.4.5. Rest of Asia-Pacific
10.5. RoW
10.5.1. Middle-East & Africa
10.5.2. Brazil
11. Market Entropy
11.1. Introduction
11.2. Most Dominant Strategy
11.3. Mergers, Agreements & Partnerships
11.4. Acquisitions and Others
12. Company Profiles
12.1. Company 1
12.2. Company 2
12.3. Company 3
12.4. Company 4
12.5. Company 5
12.6. Company 6
12.7. Company 7
12.8. Company 8
12.9. Company 9
12.10. Company 10
*More than 10 Companies are profiled in this Research Report*
"*Financials would be provided on a best efforts basis for private companies"
13. Appendix
13.1. Abbreviations
13.2. Sources
13.3. Research Methodology
13.4. Bibliography
13.5. Compilation of Experts
13.6. Disclaimer
List of Tables:
Table 1: Solid State Transformer Market Overview 2023-2030
Table 2: Solid State Transformer Market Leader Analysis 2023-2030 (US$)
Table 3: Solid State Transformer Market Product Analysis 2023-2030 (US$)
Table 4: Solid State Transformer Market End User Analysis 2023-2030 (US$)
Table 5: Solid State Transformer Market Patent Analysis 2013-2023* (US$)
Table 6: Solid State Transformer Market Financial Analysis 2023-2030 (US$)
Table 7: Solid State Transformer Market Driver Analysis 2023-2030 (US$)
Table 8: Solid State Transformer Market Challenges Analysis 2023-2030 (US$)
Table 9: Solid State Transformer Market Constraint Analysis 2023-2030 (US$)
Table 10: Solid State Transformer Market Supplier Bargaining Power Analysis 2023-2030 (US$)
Table 11: Solid State Transformer Market Buyer Bargaining Power Analysis 2023-2030 (US$)
Table 12: Solid State Transformer Market Threat of Substitutes Analysis 2023-2030 (US$)
Table 13: Solid State Transformer Market Threat of New Entrants Analysis 2023-2030 (US$)
Table 14: Solid State Transformer Market Degree of Competition Analysis 2023-2030 (US$)
Table 15: Solid State Transformer Market Value Chain Analysis 2023-2030 (US$)
Table 16: Solid State Transformer Market Pricing Analysis 2023-2030 (US$)
Table 17: Solid State Transformer Market Opportunities Analysis 2023-2030 (US$)
Table 18: Solid State Transformer Market Product Life Cycle Analysis 2023-2030 (US$)
Table 19: Solid State Transformer Market Supplier Analysis 2023-2030 (US$)
Table 20: Solid State Transformer Market Distributor Analysis 2023-2030 (US$)
Table 21: Solid State Transformer Market Trend Analysis 2023-2030 (US$)
Table 22: Solid State Transformer Market Size 2023 (US$)
Table 23: Solid State Transformer Market Forecast Analysis 2023-2030 (US$)
Table 24: Solid State Transformer Market Sales Forecast Analysis 2023-2030 (Units)
Table 25: Solid State Transformer Market, Revenue & Volume, By Components, 2023-2030 ($)
Table 26: Solid State Transformer Market By Components, Revenue & Volume, By Converters, 2023-2030 ($)
Table 27: Solid State Transformer Market By Components, Revenue & Volume, By Switches, 2023-2030 ($)
Table 28: Solid State Transformer Market By Components, Revenue & Volume, By High-frequency Transformers, 2023-2030 ($)
Table 29: Solid State Transformer Market, Revenue & Volume, By Product, 2023-2030 ($)
Table 30: Solid State Transformer Market By Product, Revenue & Volume, By Distribution Solid State Transformer, 2023-2030 ($)
Table 31: Solid State Transformer Market By Product, Revenue & Volume, By Traction Solid State Transformer, 2023-2030 ($)
Table 32: Solid State Transformer Market By Product, Revenue & Volume, By Power Solid State Transformer, 2023-2030 ($)
Table 33: Solid State Transformer Market, Revenue & Volume, By Configurations, 2023-2030 ($)
Table 34: Solid State Transformer Market By Configurations, Revenue & Volume, By Single Stage SST, 2023-2030 ($)
Table 35: Solid State Transformer Market By Configurations, Revenue & Volume, By Two Stage with LVDC Link, 2023-2030 ($)
Table 36: Solid State Transformer Market By Configurations, Revenue & Volume, By Two Stage with HVDC Link, 2023-2030 ($)
Table 37: Solid State Transformer Market By Configurations, Revenue & Volume, By Three Stage SST, 2023-2030 ($)
Table 38: Solid State Transformer Market, Revenue & Volume, By Application, 2023-2030 ($)
Table 39: Solid State Transformer Market By Application, Revenue & Volume, By Traction locomotive, 2023-2030 ($)
Table 40: Solid State Transformer Market By Application, Revenue & Volume, By Power Grid, 2023-2030 ($)
Table 41: Solid State Transformer Market By Application, Revenue & Volume, By EV Charging Stations, 2023-2030 ($)
Table 42: Solid State Transformer Market By Application, Revenue & Volume, By Power Generation, 2023-2030 ($)
Table 43: North America Solid State Transformer Market, Revenue & Volume, By Components, 2023-2030 ($)
Table 44: North America Solid State Transformer Market, Revenue & Volume, By Product, 2023-2030 ($)
Table 45: North America Solid State Transformer Market, Revenue & Volume, By Configurations, 2023-2030 ($)
Table 46: North America Solid State Transformer Market, Revenue & Volume, By Application, 2023-2030 ($)
Table 47: South america Solid State Transformer Market, Revenue & Volume, By Components, 2023-2030 ($)
Table 48: South america Solid State Transformer Market, Revenue & Volume, By Product, 2023-2030 ($)
Table 49: South america Solid State Transformer Market, Revenue & Volume, By Configurations, 2023-2030 ($)
Table 50: South america Solid State Transformer Market, Revenue & Volume, By Application, 2023-2030 ($)
Table 51: Europe Solid State Transformer Market, Revenue & Volume, By Components, 2023-2030 ($)
Table 52: Europe Solid State Transformer Market, Revenue & Volume, By Product, 2023-2030 ($)
Table 53: Europe Solid State Transformer Market, Revenue & Volume, By Configurations, 2023-2030 ($)
Table 54: Europe Solid State Transformer Market, Revenue & Volume, By Application, 2023-2030 ($)
Table 55: APAC Solid State Transformer Market, Revenue & Volume, By Components, 2023-2030 ($)
Table 56: APAC Solid State Transformer Market, Revenue & Volume, By Product, 2023-2030 ($)
Table 57: APAC Solid State Transformer Market, Revenue & Volume, By Configurations, 2023-2030 ($)
Table 58: APAC Solid State Transformer Market, Revenue & Volume, By Application, 2023-2030 ($)
Table 59: Middle East & Africa Solid State Transformer Market, Revenue & Volume, By Components, 2023-2030 ($)
Table 60: Middle East & Africa Solid State Transformer Market, Revenue & Volume, By Product, 2023-2030 ($)
Table 61: Middle East & Africa Solid State Transformer Market, Revenue & Volume, By Configurations, 2023-2030 ($)
Table 62: Middle East & Africa Solid State Transformer Market, Revenue & Volume, By Application, 2023-2030 ($)
Table 63: Russia Solid State Transformer Market, Revenue & Volume, By Components, 2023-2030 ($)
Table 64: Russia Solid State Transformer Market, Revenue & Volume, By Product, 2023-2030 ($)
Table 65: Russia Solid State Transformer Market, Revenue & Volume, By Configurations, 2023-2030 ($)
Table 66: Russia Solid State Transformer Market, Revenue & Volume, By Application, 2023-2030 ($)
Table 67: Israel Solid State Transformer Market, Revenue & Volume, By Components, 2023-2030 ($)
Table 68: Israel Solid State Transformer Market, Revenue & Volume, By Product, 2023-2030 ($)
Table 69: Israel Solid State Transformer Market, Revenue & Volume, By Configurations, 2023-2030 ($)
Table 70: Israel Solid State Transformer Market, Revenue & Volume, By Application, 2023-2030 ($)
Table 71: Top Companies 2023 (US$) Solid State Transformer Market, Revenue & Volume
Table 72: Product Launch 2023-2030 Solid State Transformer Market, Revenue & Volume
Table 73: Mergers & Acquistions 2023-2030 Solid State Transformer Market, Revenue & Volume
List of Figures:
Figure 1: Overview of Solid State Transformer Market 2023-2030
Figure 2: Market Share Analysis for Solid State Transformer Market 2023 (US$)
Figure 3: Product Comparison in Solid State Transformer Market 2023-2030 (US$)
Figure 4: End User Profile for Solid State Transformer Market 2023-2030 (US$)
Figure 5: Patent Application and Grant in Solid State Transformer Market 2013-2023* (US$)
Figure 6: Top 5 Companies Financial Analysis in Solid State Transformer Market 2023-2030 (US$)
Figure 7: Market Entry Strategy in Solid State Transformer Market 2023-2030
Figure 8: Ecosystem Analysis in Solid State Transformer Market 2023
Figure 9: Average Selling Price in Solid State Transformer Market 2023-2030
Figure 10: Top Opportunites in Solid State Transformer Market 2023-2030
Figure 11: Market Life Cycle Analysis in Solid State Transformer Market
Figure 12: GlobalBy Components Solid State Transformer Market Revenue, 2023-2030 ($)
Figure 13: GlobalBy Product Solid State Transformer Market Revenue, 2023-2030 ($)
Figure 14: GlobalBy Configurations Solid State Transformer Market Revenue, 2023-2030 ($)
Figure 15: GlobalBy Application Solid State Transformer Market Revenue, 2023-2030 ($)
Figure 16: Global Solid State Transformer Market - By Geography
Figure 17: Global Solid State Transformer Market Value & Volume, By Geography, 2023-2030 ($)
Figure 18: Global Solid State Transformer Market CAGR, By Geography, 2023-2030 (%)
Figure 19: North America Solid State Transformer Market Value & Volume, 2023-2030 ($)
Figure 20: US Solid State Transformer Market Value & Volume, 2023-2030 ($)
Figure 21: US GDP and Population, 2023-2030 ($)
Figure 22: US GDP – Composition of 2023, By Sector of Origin
Figure 23: US Export and Import Value & Volume, 2023-2030 ($)
Figure 24: Canada Solid State Transformer Market Value & Volume, 2023-2030 ($)
Figure 25: Canada GDP and Population, 2023-2030 ($)
Figure 26: Canada GDP – Composition of 2023, By Sector of Origin
Figure 27: Canada Export and Import Value & Volume, 2023-2030 ($)
Figure 28: Mexico Solid State Transformer Market Value & Volume, 2023-2030 ($)
Figure 29: Mexico GDP and Population, 2023-2030 ($)
Figure 30: Mexico GDP – Composition of 2023, By Sector of Origin
Figure 31: Mexico Export and Import Value & Volume, 2023-2030 ($)
Figure 32: South America Solid State Transformer Market Value & Volume, 2023-2030 ($)
Figure 33: Brazil Solid State Transformer Market Value & Volume, 2023-2030 ($)
Figure 34: Brazil GDP and Population, 2023-2030 ($)
Figure 35: Brazil GDP – Composition of 2023, By Sector of Origin
Figure 36: Brazil Export and Import Value & Volume, 2023-2030 ($)
Figure 37: Venezuela Solid State Transformer Market Value & Volume, 2023-2030 ($)
Figure 38: Venezuela GDP and Population, 2023-2030 ($)
Figure 39: Venezuela GDP – Composition of 2023, By Sector of Origin
Figure 40: Venezuela Export and Import Value & Volume, 2023-2030 ($)
Figure 41: Argentina Solid State Transformer Market Value & Volume, 2023-2030 ($)
Figure 42: Argentina GDP and Population, 2023-2030 ($)
Figure 43: Argentina GDP – Composition of 2023, By Sector of Origin
Figure 44: Argentina Export and Import Value & Volume, 2023-2030 ($)
Figure 45: Ecuador Solid State Transformer Market Value & Volume, 2023-2030 ($)
Figure 46: Ecuador GDP and Population, 2023-2030 ($)
Figure 47: Ecuador GDP – Composition of 2023, By Sector of Origin
Figure 48: Ecuador Export and Import Value & Volume, 2023-2030 ($)
Figure 49: Peru Solid State Transformer Market Value & Volume, 2023-2030 ($)
Figure 50: Peru GDP and Population, 2023-2030 ($)
Figure 51: Peru GDP – Composition of 2023, By Sector of Origin
Figure 52: Peru Export and Import Value & Volume, 2023-2030 ($)
Figure 53: Colombia Solid State Transformer Market Value & Volume, 2023-2030 ($)
Figure 54: Colombia GDP and Population, 2023-2030 ($)
Figure 55: Colombia GDP – Composition of 2023, By Sector of Origin
Figure 56: Colombia Export and Import Value & Volume, 2023-2030 ($)
Figure 57: Costa Rica Solid State Transformer Market Value & Volume, 2023-2030 ($)
Figure 58: Costa Rica GDP and Population, 2023-2030 ($)
Figure 59: Costa Rica GDP – Composition of 2023, By Sector of Origin
Figure 60: Costa Rica Export and Import Value & Volume, 2023-2030 ($)
Figure 61: Europe Solid State Transformer Market Value & Volume, 2023-2030 ($)
Figure 62: U.K Solid State Transformer Market Value & Volume, 2023-2030 ($)
Figure 63: U.K GDP and Population, 2023-2030 ($)
Figure 64: U.K GDP – Composition of 2023, By Sector of Origin
Figure 65: U.K Export and Import Value & Volume, 2023-2030 ($)
Figure 66: Germany Solid State Transformer Market Value & Volume, 2023-2030 ($)
Figure 67: Germany GDP and Population, 2023-2030 ($)
Figure 68: Germany GDP – Composition of 2023, By Sector of Origin
Figure 69: Germany Export and Import Value & Volume, 2023-2030 ($)
Figure 70: Italy Solid State Transformer Market Value & Volume, 2023-2030 ($)
Figure 71: Italy GDP and Population, 2023-2030 ($)
Figure 72: Italy GDP – Composition of 2023, By Sector of Origin
Figure 73: Italy Export and Import Value & Volume, 2023-2030 ($)
Figure 74: France Solid State Transformer Market Value & Volume, 2023-2030 ($)
Figure 75: France GDP and Population, 2023-2030 ($)
Figure 76: France GDP – Composition of 2023, By Sector of Origin
Figure 77: France Export and Import Value & Volume, 2023-2030 ($)
Figure 78: Netherlands Solid State Transformer Market Value & Volume, 2023-2030 ($)
Figure 79: Netherlands GDP and Population, 2023-2030 ($)
Figure 80: Netherlands GDP – Composition of 2023, By Sector of Origin
Figure 81: Netherlands Export and Import Value & Volume, 2023-2030 ($)
Figure 82: Belgium Solid State Transformer Market Value & Volume, 2023-2030 ($)
Figure 83: Belgium GDP and Population, 2023-2030 ($)
Figure 84: Belgium GDP – Composition of 2023, By Sector of Origin
Figure 85: Belgium Export and Import Value & Volume, 2023-2030 ($)
Figure 86: Spain Solid State Transformer Market Value & Volume, 2023-2030 ($)
Figure 87: Spain GDP and Population, 2023-2030 ($)
Figure 88: Spain GDP – Composition of 2023, By Sector of Origin
Figure 89: Spain Export and Import Value & Volume, 2023-2030 ($)
Figure 90: Denmark Solid State Transformer Market Value & Volume, 2023-2030 ($)
Figure 91: Denmark GDP and Population, 2023-2030 ($)
Figure 92: Denmark GDP – Composition of 2023, By Sector of Origin
Figure 93: Denmark Export and Import Value & Volume, 2023-2030 ($)
Figure 94: APAC Solid State Transformer Market Value & Volume, 2023-2030 ($)
Figure 95: China Solid State Transformer Market Value & Volume, 2023-2030
Figure 96: China GDP and Population, 2023-2030 ($)
Figure 97: China GDP – Composition of 2023, By Sector of Origin
Figure 98: China Export and Import Value & Volume, 2023-2030 ($) Solid State Transformer Market China Export and Import Value & Volume, 2023-2030 ($)
Figure 99: Australia Solid State Transformer Market Value & Volume, 2023-2030 ($)
Figure 100: Australia GDP and Population, 2023-2030 ($)
Figure 101: Australia GDP – Composition of 2023, By Sector of Origin
Figure 102: Australia Export and Import Value & Volume, 2023-2030 ($)
Figure 103: South Korea Solid State Transformer Market Value & Volume, 2023-2030 ($)
Figure 104: South Korea GDP and Population, 2023-2030 ($)
Figure 105: South Korea GDP – Composition of 2023, By Sector of Origin
Figure 106: South Korea Export and Import Value & Volume, 2023-2030 ($)
Figure 107: India Solid State Transformer Market Value & Volume, 2023-2030 ($)
Figure 108: India GDP and Population, 2023-2030 ($)
Figure 109: India GDP – Composition of 2023, By Sector of Origin
Figure 110: India Export and Import Value & Volume, 2023-2030 ($)
Figure 111: Taiwan Solid State Transformer Market Value & Volume, 2023-2030 ($)
Figure 112: Taiwan GDP and Population, 2023-2030 ($)
Figure 113: Taiwan GDP – Composition of 2023, By Sector of Origin
Figure 114: Taiwan Export and Import Value & Volume, 2023-2030 ($)
Figure 115: Malaysia Solid State Transformer Market Value & Volume, 2023-2030 ($)
Figure 116: Malaysia GDP and Population, 2023-2030 ($)
Figure 117: Malaysia GDP – Composition of 2023, By Sector of Origin
Figure 118: Malaysia Export and Import Value & Volume, 2023-2030 ($)
Figure 119: Hong Kong Solid State Transformer Market Value & Volume, 2023-2030 ($)
Figure 120: Hong Kong GDP and Population, 2023-2030 ($)
Figure 121: Hong Kong GDP – Composition of 2023, By Sector of Origin
Figure 122: Hong Kong Export and Import Value & Volume, 2023-2030 ($)
Figure 123: Middle East & Africa Solid State Transformer Market Middle East & Africa 3D Printing Market Value & Volume, 2023-2030 ($)
Figure 124: Russia Solid State Transformer Market Value & Volume, 2023-2030 ($)
Figure 125: Russia GDP and Population, 2023-2030 ($)
Figure 126: Russia GDP – Composition of 2023, By Sector of Origin
Figure 127: Russia Export and Import Value & Volume, 2023-2030 ($)
Figure 128: Israel Solid State Transformer Market Value & Volume, 2023-2030 ($)
Figure 129: Israel GDP and Population, 2023-2030 ($)
Figure 130: Israel GDP – Composition of 2023, By Sector of Origin
Figure 131: Israel Export and Import Value & Volume, 2023-2030 ($)
Figure 132: Entropy Share, By Strategies, 2023-2030* (%) Solid State Transformer Market
Figure 133: Developments, 2023-2030* Solid State Transformer Market
Figure 134: Company 1 Solid State Transformer Market Net Revenue, By Years, 2023-2030* ($)
Figure 135: Company 1 Solid State Transformer Market Net Revenue Share, By Business segments, 2023 (%)
Figure 136: Company 1 Solid State Transformer Market Net Sales Share, By Geography, 2023 (%)
Figure 137: Company 2 Solid State Transformer Market Net Revenue, By Years, 2023-2030* ($)
Figure 138: Company 2 Solid State Transformer Market Net Revenue Share, By Business segments, 2023 (%)
Figure 139: Company 2 Solid State Transformer Market Net Sales Share, By Geography, 2023 (%)
Figure 140: Company 3 Solid State Transformer Market Net Revenue, By Years, 2023-2030* ($)
Figure 141: Company 3 Solid State Transformer Market Net Revenue Share, By Business segments, 2023 (%)
Figure 142: Company 3 Solid State Transformer Market Net Sales Share, By Geography, 2023 (%)
Figure 143: Company 4 Solid State Transformer Market Net Revenue, By Years, 2023-2030* ($)
Figure 144: Company 4 Solid State Transformer Market Net Revenue Share, By Business segments, 2023 (%)
Figure 145: Company 4 Solid State Transformer Market Net Sales Share, By Geography, 2023 (%)
Figure 146: Company 5 Solid State Transformer Market Net Revenue, By Years, 2023-2030* ($)
Figure 147: Company 5 Solid State Transformer Market Net Revenue Share, By Business segments, 2023 (%)
Figure 148: Company 5 Solid State Transformer Market Net Sales Share, By Geography, 2023 (%)
Figure 149: Company 6 Solid State Transformer Market Net Revenue, By Years, 2023-2030* ($)
Figure 150: Company 6 Solid State Transformer Market Net Revenue Share, By Business segments, 2023 (%)
Figure 151: Company 6 Solid State Transformer Market Net Sales Share, By Geography, 2023 (%)
Figure 152: Company 7 Solid State Transformer Market Net Revenue, By Years, 2023-2030* ($)
Figure 153: Company 7 Solid State Transformer Market Net Revenue Share, By Business segments, 2023 (%)
Figure 154: Company 7 Solid State Transformer Market Net Sales Share, By Geography, 2023 (%)
Figure 155: Company 8 Solid State Transformer Market Net Revenue, By Years, 2023-2030* ($)
Figure 156: Company 8 Solid State Transformer Market Net Revenue Share, By Business segments, 2023 (%)
Figure 157: Company 8 Solid State Transformer Market Net Sales Share, By Geography, 2023 (%)
Figure 158: Company 9 Solid State Transformer Market Net Revenue, By Years, 2023-2030* ($)
Figure 159: Company 9 Solid State Transformer Market Net Revenue Share, By Business segments, 2023 (%)
Figure 160: Company 9 Solid State Transformer Market Net Sales Share, By Geography, 2023 (%)
Figure 161: Company 10 Solid State Transformer Market Net Revenue, By Years, 2023-2030* ($)
Figure 162: Company 10 Solid State Transformer Market Net Revenue Share, By Business segments, 2023 (%)
Figure 163: Company 10 Solid State Transformer Market Net Sales Share, By Geography, 2023 (%)
Figure 164: Company 11 Solid State Transformer Market Net Revenue, By Years, 2023-2030* ($)
Figure 165: Company 11 Solid State Transformer Market Net Revenue Share, By Business segments, 2023 (%)
Figure 166: Company 11 Solid State Transformer Market Net Sales Share, By Geography, 2023 (%)
Figure 167: Company 12 Solid State Transformer Market Net Revenue, By Years, 2023-2030* ($)
Figure 168: Company 12 Solid State Transformer Market Net Revenue Share, By Business segments, 2023 (%)
Figure 169: Company 12 Solid State Transformer Market Net Sales Share, By Geography, 2023 (%)
Figure 170: Company 13 Solid State Transformer Market Net Revenue, By Years, 2023-2030* ($)
Figure 171: Company 13 Solid State Transformer Market Net Revenue Share, By Business segments, 2023 (%)
Figure 172: Company 13 Solid State Transformer Market Net Sales Share, By Geography, 2023 (%)
Figure 173: Company 14 Solid State Transformer Market Net Revenue, By Years, 2023-2030* ($)
Figure 174: Company 14 Solid State Transformer Market Net Revenue Share, By Business segments, 2023 (%)
Figure 175: Company 14 Solid State Transformer Market Net Sales Share, By Geography, 2023 (%)
Figure 176: Company 15 Solid State Transformer Market Net Revenue, By Years, 2023-2030* ($)
Figure 177: Company 15 Solid State Transformer Market Net Revenue Share, By Business segments, 2023 (%)
Figure 178: Company 15 Solid State Transformer Market Net Sales Share, By Geography, 2023 (%)