 Email
Email Print
Print


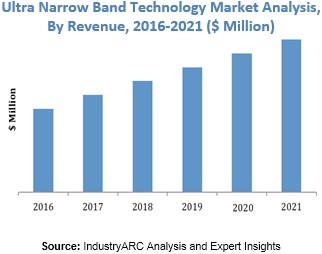
Ultra Narrow Band Technology Market - Forecast(2024 - 2030)
Ultra narrow band technology networks cater to the requirement of the concept of Internet of Things or IoT that include long range, low bandwidth and low power consumption. Ultra narrow band technology is categorized as a Low Power Wide Area (LPWA) radio technology. This technology is ideal for use in sensors and their applications. The low power consumption advantage paves the way for devices and their batteries to last longer and does away with the need to constantly and periodically replace either the devices or their batteries. Another positive outcome of low power consumption is that it extends the range of the devices that can be connected thus benefiting the overall performance of the network. The long-range property of the ultra narrow band makes it well suited for application in a rural, urban or suburban environment. This network technology is bi-directional and hence provides the capability to not only monitor but also control.
There is a significant amount of research and development underway across universities and research institutes around the world. This is expected to positively impact the market in the next few years.
In terms of applications, the Ultra Narrow Band Technology Market has been segmented across the following
- Smart Lighting, Smart Parking, Tracking, Smart Cities and Others
Europe has been the leading adopter of this technology owing to the presence of the major companies in the market. In 2013, the world’s first dedicated narrowband cellular network was launched for the Internet of Things. North America holds the second position in the market and the growth rate in the other regions are expected to remain moderate till the end of the forecast period considered in this report.
By Geography
- North America, South America, APAC, Europe, Middle East and Africa
The England headquartered Telensa, pioneered the use of the ultra narrow band communication technology that operates in the license free band. According to the company, there are over nine million ultra narrow band devices currently deployed across 30 countries. SigFox has network operators in over 25 countries. SigFox claims to have over 7 million of connected devices registered on the SIGFOX network. SIGFOX has a patented Ultra Narrow Band (UNB) technology and this enales the operation on unlicensed frequency bands available worldwide and with the benefit of fewer antennas.
Following are just a few of the companies that are operating in the Ultra Narrow Band Technology Market
- SigFox
- Qowisio
- Telensa
- Texas Instruments.
1. Ultra Narrow Band Technology– Market Overview
2. Executive Summary
3. Ultra Narrow Band Technology– Market Landscape
3.1. Market Share Analysis
3.2. Comparative Analysis
3.2.1. Product Benchmarking
3.2.2. End User Profiling
3.2.3. Top 5 Financials Analysis
4. Ultra Narrow Band Technology– Market Forces
4.1. Market Drivers
4.2. Market Constraints
4.3. Market Challenges
4.4. Attractiveness of the Ultra Narrow Band Technology Market
4.4.1. Power of Suppliers
4.4.2. Power of Customers
4.4.3. Threat of New Entrants
4.4.4. Threat of Substitution
4.4.5. Degree of Competition
5. Ultra Narrow Band Technology Market– Strategic Analysis
5.1. Value Chain Analysis
5.2. Pricing Analysis
5.3. Opportunities Analysis
5.4. Product/Market Life Cycle Analysis
5.5. Suppliers and Distributors
6. Ultra Narrow Band Technology Market– By Application:
6.1. Smart Parking
6.2. Smart Lighting
6.3. Tracking
6.4. Smart Cities
6.5. Others
7. Ultra Narrow Band Technology Market– By Geography:
7.1. Introduction
7.2. Global Study
7.3. Americas
7.3.1. North America
7.3.2. Brazil
7.3.3. Argentina
7.3.4. Others
7.4. Europe
7.4.1. U.K.
7.4.2. France
7.4.3. Germany
7.4.4. Others
7.5. APAC
7.5.1. China
7.5.2. Japan
7.5.3. India
7.5.4. Others
7.6. ROW
8. Market Entropy
8.1. New Product Launches
8.2. M&As, Collaborations, JVs and Partnerships
9. Company Profiles
9.1. Company 1
9.2. Company 2
9.3. Company 3
9.4. Company 4
9.5. Company 5
9.6. Company 6
9.7. Company 7
9.8. Company 8
9.9. Company 9
9.10. Company 10
*More than 40 Companies are profiled in this Research Report, Complete List available on Request*
"*Financials would be provided on a best efforts basis for private companies"
10. Appendix
10.1. Abbreviations
10.2. Sources
10.3. Research Methodology
10.4. Bibliography
10.5. Compilation of Expert Insights
10.6. Disclaimer
List of Tables:
Table1: Ultra Narrow Band Technology Market Overview 2023-2030
Table2: Ultra Narrow Band Technology Market Leader Analysis 2023-2030 (US$)
Table3: Ultra Narrow Band Technology Market Product Analysis 2023-2030 (US$)
Table4: Ultra Narrow Band Technology Market End User Analysis 2023-2030 (US$)
Table5: Ultra Narrow Band Technology Market Patent Analysis 2013-2023* (US$)
Table6: Ultra Narrow Band Technology Market Financial Analysis 2023-2030 (US$)
Table7: Ultra Narrow Band Technology Market Driver Analysis 2023-2030 (US$)
Table8: Ultra Narrow Band Technology Market Challenges Analysis 2023-2030 (US$)
Table9: Ultra Narrow Band Technology Market Constraint Analysis 2023-2030 (US$)
Table10: Ultra Narrow Band Technology Market Supplier Bargaining Power Analysis 2023-2030 (US$)
Table11: Ultra Narrow Band Technology Market Buyer Bargaining Power Analysis 2023-2030 (US$)
Table12: Ultra Narrow Band Technology Market Threat of Substitutes Analysis 2023-2030 (US$)
Table13: Ultra Narrow Band Technology Market Threat of New Entrants Analysis 2023-2030 (US$)
Table14: Ultra Narrow Band Technology Market Degree of Competition Analysis 2023-2030 (US$)
Table15: Ultra Narrow Band Technology Market Value Chain Analysis 2023-2030 (US$)
Table16: Ultra Narrow Band Technology Market Pricing Analysis 2023-2030 (US$)
Table17: Ultra Narrow Band Technology Market Opportunities Analysis 2023-2030 (US$)
Table18: Ultra Narrow Band Technology Market Product Life Cycle Analysis 2023-2030 (US$)
Table19: Ultra Narrow Band Technology Market Supplier Analysis 2023-2030 (US$)
Table20: Ultra Narrow Band Technology Market Distributor Analysis 2023-2030 (US$)
Table21: Ultra Narrow Band Technology Market Trend Analysis 2023-2030 (US$)
Table22: Ultra Narrow Band Technology Market Size 2023 (US$)
Table23: Ultra Narrow Band Technology Market Forecast Analysis 2023-2030 (US$)
Table24: Ultra Narrow Band Technology Market Sales Forecast Analysis 2023-2030 (Units)
Table25: Ultra Narrow Band Technology Market, Revenue & Volume, By Application, 2023-2030 ($)
Table26: Ultra Narrow Band Technology Market By Application, Revenue & Volume, Smart Parking, 2023-2030 ($)
Table27: Ultra Narrow Band Technology Market By Application, Revenue & Volume, Smart Lighting, 2023-2030 ($)
Table28: Ultra Narrow Band Technology Market By Application, Revenue & Volume, Tracking, 2023-2030 ($)
Table29: Ultra Narrow Band Technology Market By Application, Revenue & Volume, Smart Cities, 2023-2030 ($)
Table30: North America Ultra Narrow Band Technology Market, Revenue & Volume, By Application, 2023-2030 ($)
Table31: South america Ultra Narrow Band Technology Market, Revenue & Volume, By Application, 2023-2030 ($)
Table32: Europe Ultra Narrow Band Technology Market, Revenue & Volume, By Application, 2023-2030 ($)
Table33: APAC Ultra Narrow Band Technology Market, Revenue & Volume, By Application, 2023-2030 ($)
Table34: Middle East & Africa Ultra Narrow Band Technology Market, Revenue & Volume, By Application, 2023-2030 ($)
Table35: Russia Ultra Narrow Band Technology Market, Revenue & Volume, By Application, 2023-2030 ($)
Table36: Israel Ultra Narrow Band Technology Market, Revenue & Volume, By Application, 2023-2030 ($)
Table37: Top Companies 2023 (US$)Ultra Narrow Band Technology Market, Revenue & Volume
Table38: Product Launch 2023-2030Ultra Narrow Band Technology Market, Revenue & Volume
Table39: Mergers & Acquistions 2023-2030Ultra Narrow Band Technology Market, Revenue & Volume
List of Figures:
Figure 1: Overview of Ultra Narrow Band Technology Market 2023-2030
Figure 2: Market Share Analysis for Ultra Narrow Band Technology Market 2023 (US$)
Figure 3: Product Comparison in Ultra Narrow Band Technology Market 2023-2030 (US$)
Figure 4: End User Profile for Ultra Narrow Band Technology Market 2023-2030 (US$)
Figure 5: Patent Application and Grant in Ultra Narrow Band Technology Market 2013-2023* (US$)
Figure 6: Top 5 Companies Financial Analysis in Ultra Narrow Band Technology Market 2023-2030 (US$)
Figure 7: Market Entry Strategy in Ultra Narrow Band Technology Market 2023-2030
Figure 8: Ecosystem Analysis in Ultra Narrow Band Technology Market 2023
Figure 9: Average Selling Price in Ultra Narrow Band Technology Market 2023-2030
Figure 10: Top Opportunites in Ultra Narrow Band Technology Market 2023-2030
Figure 11: Market Life Cycle Analysis in Ultra Narrow Band Technology Market
Figure 12: GlobalBy ApplicationUltra Narrow Band Technology Market Revenue, 2023-2030 ($)
Figure 13: Global Ultra Narrow Band Technology Market - By Geography
Figure 14: Global Ultra Narrow Band Technology Market Value & Volume, By Geography, 2023-2030 ($)
Figure 15: Global Ultra Narrow Band Technology Market CAGR, By Geography, 2023-2030 (%)
Figure 16: North America Ultra Narrow Band Technology Market Value & Volume, 2023-2030 ($)
Figure 17: US Ultra Narrow Band Technology Market Value & Volume, 2023-2030 ($)
Figure 18: US GDP and Population, 2023-2030 ($)
Figure 19: US GDP – Composition of 2023, By Sector of Origin
Figure 20: US Export and Import Value & Volume, 2023-2030 ($)
Figure 21: Canada Ultra Narrow Band Technology Market Value & Volume, 2023-2030 ($)
Figure 22: Canada GDP and Population, 2023-2030 ($)
Figure 23: Canada GDP – Composition of 2023, By Sector of Origin
Figure 24: Canada Export and Import Value & Volume, 2023-2030 ($)
Figure 25: Mexico Ultra Narrow Band Technology Market Value & Volume, 2023-2030 ($)
Figure 26: Mexico GDP and Population, 2023-2030 ($)
Figure 27: Mexico GDP – Composition of 2023, By Sector of Origin
Figure 28: Mexico Export and Import Value & Volume, 2023-2030 ($)
Figure 29: South America Ultra Narrow Band Technology Market Value & Volume, 2023-2030 ($)
Figure 30: Brazil Ultra Narrow Band Technology Market Value & Volume, 2023-2030 ($)
Figure 31: Brazil GDP and Population, 2023-2030 ($)
Figure 32: Brazil GDP – Composition of 2023, By Sector of Origin
Figure 33: Brazil Export and Import Value & Volume, 2023-2030 ($)
Figure 34: Venezuela Ultra Narrow Band Technology Market Value & Volume, 2023-2030 ($)
Figure 35: Venezuela GDP and Population, 2023-2030 ($)
Figure 36: Venezuela GDP – Composition of 2023, By Sector of Origin
Figure 37: Venezuela Export and Import Value & Volume, 2023-2030 ($)
Figure 38: Argentina Ultra Narrow Band Technology Market Value & Volume, 2023-2030 ($)
Figure 39: Argentina GDP and Population, 2023-2030 ($)
Figure 40: Argentina GDP – Composition of 2023, By Sector of Origin
Figure 41: Argentina Export and Import Value & Volume, 2023-2030 ($)
Figure 42: Ecuador Ultra Narrow Band Technology Market Value & Volume, 2023-2030 ($)
Figure 43: Ecuador GDP and Population, 2023-2030 ($)
Figure 44: Ecuador GDP – Composition of 2023, By Sector of Origin
Figure 45: Ecuador Export and Import Value & Volume, 2023-2030 ($)
Figure 46: Peru Ultra Narrow Band Technology Market Value & Volume, 2023-2030 ($)
Figure 47: Peru GDP and Population, 2023-2030 ($)
Figure 48: Peru GDP – Composition of 2023, By Sector of Origin
Figure 49: Peru Export and Import Value & Volume, 2023-2030 ($)
Figure 50: Colombia Ultra Narrow Band Technology Market Value & Volume, 2023-2030 ($)
Figure 51: Colombia GDP and Population, 2023-2030 ($)
Figure 52: Colombia GDP – Composition of 2023, By Sector of Origin
Figure 53: Colombia Export and Import Value & Volume, 2023-2030 ($)
Figure 54: Costa Rica Ultra Narrow Band Technology Market Value & Volume, 2023-2030 ($)
Figure 55: Costa Rica GDP and Population, 2023-2030 ($)
Figure 56: Costa Rica GDP – Composition of 2023, By Sector of Origin
Figure 57: Costa Rica Export and Import Value & Volume, 2023-2030 ($)
Figure 58: Europe Ultra Narrow Band Technology Market Value & Volume, 2023-2030 ($)
Figure 59: U.K Ultra Narrow Band Technology Market Value & Volume, 2023-2030 ($)
Figure 60: U.K GDP and Population, 2023-2030 ($)
Figure 61: U.K GDP – Composition of 2023, By Sector of Origin
Figure 62: U.K Export and Import Value & Volume, 2023-2030 ($)
Figure 63: Germany Ultra Narrow Band Technology Market Value & Volume, 2023-2030 ($)
Figure 64: Germany GDP and Population, 2023-2030 ($)
Figure 65: Germany GDP – Composition of 2023, By Sector of Origin
Figure 66: Germany Export and Import Value & Volume, 2023-2030 ($)
Figure 67: Italy Ultra Narrow Band Technology Market Value & Volume, 2023-2030 ($)
Figure 68: Italy GDP and Population, 2023-2030 ($)
Figure 69: Italy GDP – Composition of 2023, By Sector of Origin
Figure 70: Italy Export and Import Value & Volume, 2023-2030 ($)
Figure 71: France Ultra Narrow Band Technology Market Value & Volume, 2023-2030 ($)
Figure 72: France GDP and Population, 2023-2030 ($)
Figure 73: France GDP – Composition of 2023, By Sector of Origin
Figure 74: France Export and Import Value & Volume, 2023-2030 ($)
Figure 75: Netherlands Ultra Narrow Band Technology Market Value & Volume, 2023-2030 ($)
Figure 76: Netherlands GDP and Population, 2023-2030 ($)
Figure 77: Netherlands GDP – Composition of 2023, By Sector of Origin
Figure 78: Netherlands Export and Import Value & Volume, 2023-2030 ($)
Figure 79: Belgium Ultra Narrow Band Technology Market Value & Volume, 2023-2030 ($)
Figure 80: Belgium GDP and Population, 2023-2030 ($)
Figure 81: Belgium GDP – Composition of 2023, By Sector of Origin
Figure 82: Belgium Export and Import Value & Volume, 2023-2030 ($)
Figure 83: Spain Ultra Narrow Band Technology Market Value & Volume, 2023-2030 ($)
Figure 84: Spain GDP and Population, 2023-2030 ($)
Figure 85: Spain GDP – Composition of 2023, By Sector of Origin
Figure 86: Spain Export and Import Value & Volume, 2023-2030 ($)
Figure 87: Denmark Ultra Narrow Band Technology Market Value & Volume, 2023-2030 ($)
Figure 88: Denmark GDP and Population, 2023-2030 ($)
Figure 89: Denmark GDP – Composition of 2023, By Sector of Origin
Figure 90: Denmark Export and Import Value & Volume, 2023-2030 ($)
Figure 91: APAC Ultra Narrow Band Technology Market Value & Volume, 2023-2030 ($)
Figure 92: China Ultra Narrow Band Technology Market Value & Volume, 2023-2030
Figure 93: China GDP and Population, 2023-2030 ($)
Figure 94: China GDP – Composition of 2023, By Sector of Origin
Figure 95: China Export and Import Value & Volume, 2023-2030 ($)Ultra Narrow Band Technology Market China Export and Import Value & Volume, 2023-2030 ($)
Figure 96: Australia Ultra Narrow Band Technology Market Value & Volume, 2023-2030 ($)
Figure 97: Australia GDP and Population, 2023-2030 ($)
Figure 98: Australia GDP – Composition of 2023, By Sector of Origin
Figure 99: Australia Export and Import Value & Volume, 2023-2030 ($)
Figure 100: South Korea Ultra Narrow Band Technology Market Value & Volume, 2023-2030 ($)
Figure 101: South Korea GDP and Population, 2023-2030 ($)
Figure 102: South Korea GDP – Composition of 2023, By Sector of Origin
Figure 103: South Korea Export and Import Value & Volume, 2023-2030 ($)
Figure 104: India Ultra Narrow Band Technology Market Value & Volume, 2023-2030 ($)
Figure 105: India GDP and Population, 2023-2030 ($)
Figure 106: India GDP – Composition of 2023, By Sector of Origin
Figure 107: India Export and Import Value & Volume, 2023-2030 ($)
Figure 108: Taiwan Ultra Narrow Band Technology Market Value & Volume, 2023-2030 ($)
Figure 109: Taiwan GDP and Population, 2023-2030 ($)
Figure 110: Taiwan GDP – Composition of 2023, By Sector of Origin
Figure 111: Taiwan Export and Import Value & Volume, 2023-2030 ($)
Figure 112: Malaysia Ultra Narrow Band Technology Market Value & Volume, 2023-2030 ($)
Figure 113: Malaysia GDP and Population, 2023-2030 ($)
Figure 114: Malaysia GDP – Composition of 2023, By Sector of Origin
Figure 115: Malaysia Export and Import Value & Volume, 2023-2030 ($)
Figure 116: Hong Kong Ultra Narrow Band Technology Market Value & Volume, 2023-2030 ($)
Figure 117: Hong Kong GDP and Population, 2023-2030 ($)
Figure 118: Hong Kong GDP – Composition of 2023, By Sector of Origin
Figure 119: Hong Kong Export and Import Value & Volume, 2023-2030 ($)
Figure 120: Middle East & Africa Ultra Narrow Band Technology Market Middle East & Africa 3D Printing Market Value & Volume, 2023-2030 ($)
Figure 121: Russia Ultra Narrow Band Technology Market Value & Volume, 2023-2030 ($)
Figure 122: Russia GDP and Population, 2023-2030 ($)
Figure 123: Russia GDP – Composition of 2023, By Sector of Origin
Figure 124: Russia Export and Import Value & Volume, 2023-2030 ($)
Figure 125: Israel Ultra Narrow Band Technology Market Value & Volume, 2023-2030 ($)
Figure 126: Israel GDP and Population, 2023-2030 ($)
Figure 127: Israel GDP – Composition of 2023, By Sector of Origin
Figure 128: Israel Export and Import Value & Volume, 2023-2030 ($)
Figure 129: Entropy Share, By Strategies, 2023-2030* (%)Ultra Narrow Band Technology Market
Figure 130: Developments, 2023-2030*Ultra Narrow Band Technology Market
Figure 131: Company 1 Ultra Narrow Band Technology Market Net Revenue, By Years, 2023-2030* ($)
Figure 132: Company 1 Ultra Narrow Band Technology Market Net Revenue Share, By Business segments, 2023 (%)
Figure 133: Company 1 Ultra Narrow Band Technology Market Net Sales Share, By Geography, 2023 (%)
Figure 134: Company 2 Ultra Narrow Band Technology Market Net Revenue, By Years, 2023-2030* ($)
Figure 135: Company 2 Ultra Narrow Band Technology Market Net Revenue Share, By Business segments, 2023 (%)
Figure 136: Company 2 Ultra Narrow Band Technology Market Net Sales Share, By Geography, 2023 (%)
Figure 137: Company 3 Ultra Narrow Band Technology Market Net Revenue, By Years, 2023-2030* ($)
Figure 138: Company 3 Ultra Narrow Band Technology Market Net Revenue Share, By Business segments, 2023 (%)
Figure 139: Company 3 Ultra Narrow Band Technology Market Net Sales Share, By Geography, 2023 (%)
Figure 140: Company 4 Ultra Narrow Band Technology Market Net Revenue, By Years, 2023-2030* ($)
Figure 141: Company 4 Ultra Narrow Band Technology Market Net Revenue Share, By Business segments, 2023 (%)
Figure 142: Company 4 Ultra Narrow Band Technology Market Net Sales Share, By Geography, 2023 (%)
Figure 143: Company 5 Ultra Narrow Band Technology Market Net Revenue, By Years, 2023-2030* ($)
Figure 144: Company 5 Ultra Narrow Band Technology Market Net Revenue Share, By Business segments, 2023 (%)
Figure 145: Company 5 Ultra Narrow Band Technology Market Net Sales Share, By Geography, 2023 (%)
Figure 146: Company 6 Ultra Narrow Band Technology Market Net Revenue, By Years, 2023-2030* ($)
Figure 147: Company 6 Ultra Narrow Band Technology Market Net Revenue Share, By Business segments, 2023 (%)
Figure 148: Company 6 Ultra Narrow Band Technology Market Net Sales Share, By Geography, 2023 (%)
Figure 149: Company 7 Ultra Narrow Band Technology Market Net Revenue, By Years, 2023-2030* ($)
Figure 150: Company 7 Ultra Narrow Band Technology Market Net Revenue Share, By Business segments, 2023 (%)
Figure 151: Company 7 Ultra Narrow Band Technology Market Net Sales Share, By Geography, 2023 (%)
Figure 152: Company 8 Ultra Narrow Band Technology Market Net Revenue, By Years, 2023-2030* ($)
Figure 153: Company 8 Ultra Narrow Band Technology Market Net Revenue Share, By Business segments, 2023 (%)
Figure 154: Company 8 Ultra Narrow Band Technology Market Net Sales Share, By Geography, 2023 (%)
Figure 155: Company 9 Ultra Narrow Band Technology Market Net Revenue, By Years, 2023-2030* ($)
Figure 156: Company 9 Ultra Narrow Band Technology Market Net Revenue Share, By Business segments, 2023 (%)
Figure 157: Company 9 Ultra Narrow Band Technology Market Net Sales Share, By Geography, 2023 (%)
Figure 158: Company 10 Ultra Narrow Band Technology Market Net Revenue, By Years, 2023-2030* ($)
Figure 159: Company 10 Ultra Narrow Band Technology Market Net Revenue Share, By Business segments, 2023 (%)
Figure 160: Company 10 Ultra Narrow Band Technology Market Net Sales Share, By Geography, 2023 (%)
Figure 161: Company 11 Ultra Narrow Band Technology Market Net Revenue, By Years, 2023-2030* ($)
Figure 162: Company 11 Ultra Narrow Band Technology Market Net Revenue Share, By Business segments, 2023 (%)
Figure 163: Company 11 Ultra Narrow Band Technology Market Net Sales Share, By Geography, 2023 (%)
Figure 164: Company 12 Ultra Narrow Band Technology Market Net Revenue, By Years, 2023-2030* ($)
Figure 165: Company 12 Ultra Narrow Band Technology Market Net Revenue Share, By Business segments, 2023 (%)
Figure 166: Company 12 Ultra Narrow Band Technology Market Net Sales Share, By Geography, 2023 (%)
Figure 167: Company 13 Ultra Narrow Band Technology Market Net Revenue, By Years, 2023-2030* ($)
Figure 168: Company 13 Ultra Narrow Band Technology Market Net Revenue Share, By Business segments, 2023 (%)
Figure 169: Company 13 Ultra Narrow Band Technology Market Net Sales Share, By Geography, 2023 (%)
Figure 170: Company 14 Ultra Narrow Band Technology Market Net Revenue, By Years, 2023-2030* ($)
Figure 171: Company 14 Ultra Narrow Band Technology Market Net Revenue Share, By Business segments, 2023 (%)
Figure 172: Company 14 Ultra Narrow Band Technology Market Net Sales Share, By Geography, 2023 (%)
Figure 173: Company 15 Ultra Narrow Band Technology Market Net Revenue, By Years, 2023-2030* ($)
Figure 174: Company 15 Ultra Narrow Band Technology Market Net Revenue Share, By Business segments, 2023 (%)
Figure 175: Company 15 Ultra Narrow Band Technology Market Net Sales Share, By Geography, 2023 (%)