 Email
Email Print
Print


Erbium Oxide Market Overview
Erbium Oxide Market size is projected to reach US$107.8 million by
2027, after growing at a CAGR of 4.8% during 2022-2027.
Erbium oxide (Er2O3) is a member of rare-earth sesquioxides. Erbium (III)
oxide, is synthesized from the lanthanide metal erbium. Photon
upconversion is a phenomenon where lower energy photons are piled up to
create higher energy photons. Erbium(III) chloride is a violet solid
with the formula ErCl3 and is used in the preparation of erbium metal. The product
offers various properties such as high dielectric constant, high mechanical
strength, high chemical and thermal stability in contact with Si and high
transparency in visible light among others. These properties of erbium oxide are
driving its demand among end-use industries such as glass processing,
semiconductors and optical among others. The growing demand from these
industries is driving the market for the Erbium industry. The COVID-19 outbreak led
to major economic problems and challenges for the Erbium Oxide industry globally. Governments all across
the globe announced strict measures to slow the spread of the coronavirus and
only the production of essential commodities was allowed, which impacted the
non-essential commodity industries, thereby impacting the production of the Erbium
Oxide industry.
Erbium Oxide Market Report Coverage
The “Erbium Oxide Market Report – Forecast (2022-2027)”
by IndustryARC, covers an in-depth analysis of the following segments in the Erbium
Oxide industry.
Key Takeaways
- The Asia-Pacific region is expected to grow at a high CAGR of 5.6% during the forecast period. One of the key drivers driving the market is rapid growth in the automotive and construction industry.
- The growing Important of erbium oxides in the manufacturing of glass displays, such as computer monitors and high temperature and corrosion-resistant coatings is expanding the Erbium Oxide Market size during the forecast period.
- Erbium metals such as lanthanide metal is used to manufacture Erbium (III) oxide and Erbium(III) chloride
- A detailed analysis of strengths, weaknesses, opportunities and threats will be provided in the Erbium Oxide Market Report.
Erbium Oxide Market Segment Analysis – by Type
The 2N segment
held a significant share in the Erbium Oxide industry in 2021 and is anticipated to grow at a
significant CAGR during the forecast period 2022-2027. 2N
erbium oxide is 99% purity erbium used in different industries such as
electronics, glass and ceramic among others. Erbium oxide and Erbium (III) Chloride 99% is used as a gate
dielectric in semiconductor devices since it has a high dielectric constant.
Hence the growth in these industries will drive the demand for erbium oxide
during the forecast period.
Erbium Oxide Market Segment Analysis - by Application
The glass
manufacturing segment held a significant share of 20%
in the Erbium Oxide industry in
2021 and is anticipated to grow at a significant CAGR during the forecast
period 2022-2027. Erbium oxide can be spread on glass or plastic for display
purposes, such as display monitors, mobile screens and laptop screens among
others. They are widely used in display monitors due to their electrical
properties. The growing consumer electronic production globally is supporting
the demand for the display panel, which is further anticipated to drive the
erbium oxide market size during the forecast period. According to the facts
published by Samsung, the company produced approximately 300 million smartphones
in 2021. According to Avalon Data, Apple
delivered 55.2 million iPhones in the first quarter of 2021. Hence the growth
in the smartphone market is driving the market for smart displays and further
driving the market for erbium oxide during the forecast period.
Erbium Oxide Market Segment Analysis – by Geography
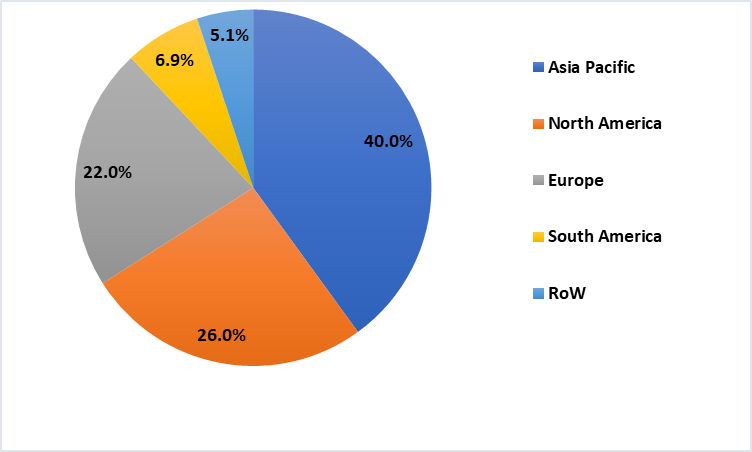
The Asia-Pacific region dominated the Erbium Oxide industry in terms of revenue with a share of 40% in 2021 and is projected to dominate the market during the forecast period 2022-2027. The presence of developing nations such as India and China is driving market growth in the region. The presence of end-use industries along with rapid industrialization is also supporting the market for Erbium Oxide. According to the facts published by the All India Glass Manufacturers' Federation (AIGMF), India has a total installed capacity of 12,000 tonnes/day in container glass, 7000 tonnes/day in flat glass and 1000 tonnes/day in table glassware. Hence the growth in the glass industry is driving the market for erbium oxide in the Asia Pacific region. According to the International Organization of Motor Vehicle Manufacturers (OICA), the total automobile production in China reached 2,60,82,220 units in 2021, an increase from 2,52,25,242 units in 2020 and 2,57,20,665 units in 2019 respectively. Hence the growth in the automotive industry is driving the market for smart displays and further driving Erbium Oxide
Erbium Oxide Market Drivers
Growing Demand for Lightweight Passenger Vehicles
Erbium Oxide is generally used in the automotive industry for different
applications such as electronic displays, semiconductors and fuel cells among
others. According to Hedges Company review, the United
States has around 17.55 million light vehicles registered in 2020. They also
mentioned, that Toyota company has registered around 2,112,940 units of light
vehicle sales in the US during 2020-2021. According to IBEF facts, In January
2022, the total production of passenger vehicles, three-wheelers, two-wheelers and
quadricycles reached 1,860,809 units in India. The rapid growth in automotive
production is supporting the Erbium Oxide market size. Photon upconversion
in lanthanide metals has recently shown compelling advantages in a wide
range of fields due to their exceptional anti-Stokes luminescence performances
and physicochemical properties. These properties of erbium oxide are also
boosting market growth.
Growing usage of Glass In Consumer Goods and Electronics Industry
Growing demand for erbium oxide from display panels is driving the market
for consumer goods and electronics. Erbium oxide is primarily used in various display
products such as LEDs and LCDs among others. The growing consumer electronic
industry is driving the demand for display panels, which is further driving the
erbium oxide market globally. The rapid growth of the Internet of things in developing
and developed countries are also driving the demand for display panels. The
growth in smartphone and phablet adoption in developing countries supports the display panel industry, further driving the erbium oxide market. The
product is also used in consumer electronics such as cameras, cell phones,
tablets and automotive displays among others. Hence the growth in the flowing
electronics is driving the market. Based on the article on mobile phones, more
than 4.14 million mobile phones are sold every day in the world, of which
almost 800,000 are Samsung. Hence the growth in electronics production is
driving the market for Erbium Oxide during the forecast period.
Erbium Oxide Market Challenges
Adverse Health effects of Erbium Oxide
The highly toxic nature of erbium is expected to
hamper the market growth. Erbium oxide, when injected, inhaled or taken orally
can have harmful effects on human health. The symptoms of erbium oxide toxicity
could be ataxia, writhing, arched back, labored respiration and sedation.
Erbium oxide is graded as an irritant by Environmental Protection Agency (EPA) and
can cause severe skin and eye irritation. Furthermore, high raw material cost
is anticipated to hamper the erbium oxide market. Supply of the erbium is
highly dependent on mining activities in regions where reserves are abundant.
Any political or economic disruptions in these regions can cause supply issues
and hence affect market growth. These are some of the major challenges
hampering the market growth for Erbium Oxide.
Erbium Oxide Industry Outlook
Technology
launches, acquisitions and R&D activities
are key strategies adopted by players in the Erbium Oxide Market. The top 10
companies in the Erbium Oxide Market include:
- Epsi Metals
- Arafura Resources
- Avalon Rare Metals Inc.
- Alkane Resources Ltd.
- China Rare Earth Holding Limited
- Great Western Minerals Group Ltd.
- Indian Rare Earths Limited
- Frontier Rare Earths Ltd.
- Molycorp Inc.
- Inner Mongolia Baotou Steel Rare Eartch Hi-Tech Co.
Relevant Reports
Report Code: CMR 95984
Report Code: CMR 97525
Report Code: CMR 16014
For more Chemicals and Materials Market reports, please click here
Table 1: Erbium Oxide Market Overview 2023-2030
Table 2: Erbium Oxide Market Leader Analysis 2023-2030 (US$)
Table 3: Erbium Oxide Market Product Analysis 2023-2030 (US$)
Table 4: Erbium Oxide Market End User Analysis 2023-2030 (US$)
Table 5: Erbium Oxide Market Patent Analysis 2013-2023* (US$)
Table 6: Erbium Oxide Market Financial Analysis 2023-2030 (US$)
Table 7: Erbium Oxide Market Driver Analysis 2023-2030 (US$)
Table 8: Erbium Oxide Market Challenges Analysis 2023-2030 (US$)
Table 9: Erbium Oxide Market Constraint Analysis 2023-2030 (US$)
Table 10: Erbium Oxide Market Supplier Bargaining Power Analysis 2023-2030 (US$)
Table 11: Erbium Oxide Market Buyer Bargaining Power Analysis 2023-2030 (US$)
Table 12: Erbium Oxide Market Threat of Substitutes Analysis 2023-2030 (US$)
Table 13: Erbium Oxide Market Threat of New Entrants Analysis 2023-2030 (US$)
Table 14: Erbium Oxide Market Degree of Competition Analysis 2023-2030 (US$)
Table 15: Erbium Oxide Market Value Chain Analysis 2023-2030 (US$)
Table 16: Erbium Oxide Market Pricing Analysis 2023-2030 (US$)
Table 17: Erbium Oxide Market Opportunities Analysis 2023-2030 (US$)
Table 18: Erbium Oxide Market Product Life Cycle Analysis 2023-2030 (US$)
Table 19: Erbium Oxide Market Supplier Analysis 2023-2030 (US$)
Table 20: Erbium Oxide Market Distributor Analysis 2023-2030 (US$)
Table 21: Erbium Oxide Market Trend Analysis 2023-2030 (US$)
Table 22: Erbium Oxide Market Size 2023 (US$)
Table 23: Erbium Oxide Market Forecast Analysis 2023-2030 (US$)
Table 24: Erbium Oxide Market Sales Forecast Analysis 2023-2030 (Units)
Table 25: Erbium Oxide Market, Revenue & Volume, By Applications, 2023-2030 ($)
Table 26: Erbium Oxide Market By Applications, Revenue & Volume, By Ceramics, 2023-2030 ($)
Table 27: Erbium Oxide Market By Applications, Revenue & Volume, By Glass, 2023-2030 ($)
Table 28: Erbium Oxide Market By Applications, Revenue & Volume, By Electrical & Electronics, 2023-2030 ($)
Table 29: Erbium Oxide Market By Applications, Revenue & Volume, By Aerospace, 2023-2030 ($)
Table 30: Erbium Oxide Market By Applications, Revenue & Volume, By Medical (Bio Imaging, Dentistry and Dermatology), 2023-2030 ($)
Table 31: North America Erbium Oxide Market, Revenue & Volume, By Applications, 2023-2030 ($)
Table 32: South america Erbium Oxide Market, Revenue & Volume, By Applications, 2023-2030 ($)
Table 33: Europe Erbium Oxide Market, Revenue & Volume, By Applications, 2023-2030 ($)
Table 34: APAC Erbium Oxide Market, Revenue & Volume, By Applications, 2023-2030 ($)
Table 35: Middle East & Africa Erbium Oxide Market, Revenue & Volume, By Applications, 2023-2030 ($)
Table 36: Russia Erbium Oxide Market, Revenue & Volume, By Applications, 2023-2030 ($)
Table 37: Israel Erbium Oxide Market, Revenue & Volume, By Applications, 2023-2030 ($)
Table 38: Top Companies 2023 (US$)Erbium Oxide Market, Revenue & Volume
Table 39: Product Launch 2023-2030Erbium Oxide Market, Revenue & Volume
Table 40: Mergers & Acquistions 2023-2030Erbium Oxide Market, Revenue & Volume
List of Figures:
Figure 1: Overview of Erbium Oxide Market 2023-2030
Figure 2: Market Share Analysis for Erbium Oxide Market 2023 (US$)
Figure 3: Product Comparison in Erbium Oxide Market 2023-2030 (US$)
Figure 4: End User Profile for Erbium Oxide Market 2023-2030 (US$)
Figure 5: Patent Application and Grant in Erbium Oxide Market 2013-2023* (US$)
Figure 6: Top 5 Companies Financial Analysis in Erbium Oxide Market 2023-2030 (US$)
Figure 7: Market Entry Strategy in Erbium Oxide Market 2023-2030
Figure 8: Ecosystem Analysis in Erbium Oxide Market 2023
Figure 9: Average Selling Price in Erbium Oxide Market 2023-2030
Figure 10: Top Opportunites in Erbium Oxide Market 2023-2030
Figure 11: Market Life Cycle Analysis in Erbium Oxide Market
Figure 12: GlobalBy ApplicationsErbium Oxide Market Revenue, 2023-2030 ($)
Figure 13: Global Erbium Oxide Market - By Geography
Figure 14: Global Erbium Oxide Market Value & Volume, By Geography, 2023-2030 ($)
Figure 15: Global Erbium Oxide Market CAGR, By Geography, 2023-2030 (%)
Figure 16: North America Erbium Oxide Market Value & Volume, 2023-2030 ($)
Figure 17: US Erbium Oxide Market Value & Volume, 2023-2030 ($)
Figure 18: US GDP and Population, 2023-2030 ($)
Figure 19: US GDP – Composition of 2023, By Sector of Origin
Figure 20: US Export and Import Value & Volume, 2023-2030 ($)
Figure 21: Canada Erbium Oxide Market Value & Volume, 2023-2030 ($)
Figure 22: Canada GDP and Population, 2023-2030 ($)
Figure 23: Canada GDP – Composition of 2023, By Sector of Origin
Figure 24: Canada Export and Import Value & Volume, 2023-2030 ($)
Figure 25: Mexico Erbium Oxide Market Value & Volume, 2023-2030 ($)
Figure 26: Mexico GDP and Population, 2023-2030 ($)
Figure 27: Mexico GDP – Composition of 2023, By Sector of Origin
Figure 28: Mexico Export and Import Value & Volume, 2023-2030 ($)
Figure 29: South America Erbium Oxide Market Value & Volume, 2023-2030 ($)
Figure 30: Brazil Erbium Oxide Market Value & Volume, 2023-2030 ($)
Figure 31: Brazil GDP and Population, 2023-2030 ($)
Figure 32: Brazil GDP – Composition of 2023, By Sector of Origin
Figure 33: Brazil Export and Import Value & Volume, 2023-2030 ($)
Figure 34: Venezuela Erbium Oxide Market Value & Volume, 2023-2030 ($)
Figure 35: Venezuela GDP and Population, 2023-2030 ($)
Figure 36: Venezuela GDP – Composition of 2023, By Sector of Origin
Figure 37: Venezuela Export and Import Value & Volume, 2023-2030 ($)
Figure 38: Argentina Erbium Oxide Market Value & Volume, 2023-2030 ($)
Figure 39: Argentina GDP and Population, 2023-2030 ($)
Figure 40: Argentina GDP – Composition of 2023, By Sector of Origin
Figure 41: Argentina Export and Import Value & Volume, 2023-2030 ($)
Figure 42: Ecuador Erbium Oxide Market Value & Volume, 2023-2030 ($)
Figure 43: Ecuador GDP and Population, 2023-2030 ($)
Figure 44: Ecuador GDP – Composition of 2023, By Sector of Origin
Figure 45: Ecuador Export and Import Value & Volume, 2023-2030 ($)
Figure 46: Peru Erbium Oxide Market Value & Volume, 2023-2030 ($)
Figure 47: Peru GDP and Population, 2023-2030 ($)
Figure 48: Peru GDP – Composition of 2023, By Sector of Origin
Figure 49: Peru Export and Import Value & Volume, 2023-2030 ($)
Figure 50: Colombia Erbium Oxide Market Value & Volume, 2023-2030 ($)
Figure 51: Colombia GDP and Population, 2023-2030 ($)
Figure 52: Colombia GDP – Composition of 2023, By Sector of Origin
Figure 53: Colombia Export and Import Value & Volume, 2023-2030 ($)
Figure 54: Costa Rica Erbium Oxide Market Value & Volume, 2023-2030 ($)
Figure 55: Costa Rica GDP and Population, 2023-2030 ($)
Figure 56: Costa Rica GDP – Composition of 2023, By Sector of Origin
Figure 57: Costa Rica Export and Import Value & Volume, 2023-2030 ($)
Figure 58: Europe Erbium Oxide Market Value & Volume, 2023-2030 ($)
Figure 59: U.K Erbium Oxide Market Value & Volume, 2023-2030 ($)
Figure 60: U.K GDP and Population, 2023-2030 ($)
Figure 61: U.K GDP – Composition of 2023, By Sector of Origin
Figure 62: U.K Export and Import Value & Volume, 2023-2030 ($)
Figure 63: Germany Erbium Oxide Market Value & Volume, 2023-2030 ($)
Figure 64: Germany GDP and Population, 2023-2030 ($)
Figure 65: Germany GDP – Composition of 2023, By Sector of Origin
Figure 66: Germany Export and Import Value & Volume, 2023-2030 ($)
Figure 67: Italy Erbium Oxide Market Value & Volume, 2023-2030 ($)
Figure 68: Italy GDP and Population, 2023-2030 ($)
Figure 69: Italy GDP – Composition of 2023, By Sector of Origin
Figure 70: Italy Export and Import Value & Volume, 2023-2030 ($)
Figure 71: France Erbium Oxide Market Value & Volume, 2023-2030 ($)
Figure 72: France GDP and Population, 2023-2030 ($)
Figure 73: France GDP – Composition of 2023, By Sector of Origin
Figure 74: France Export and Import Value & Volume, 2023-2030 ($)
Figure 75: Netherlands Erbium Oxide Market Value & Volume, 2023-2030 ($)
Figure 76: Netherlands GDP and Population, 2023-2030 ($)
Figure 77: Netherlands GDP – Composition of 2023, By Sector of Origin
Figure 78: Netherlands Export and Import Value & Volume, 2023-2030 ($)
Figure 79: Belgium Erbium Oxide Market Value & Volume, 2023-2030 ($)
Figure 80: Belgium GDP and Population, 2023-2030 ($)
Figure 81: Belgium GDP – Composition of 2023, By Sector of Origin
Figure 82: Belgium Export and Import Value & Volume, 2023-2030 ($)
Figure 83: Spain Erbium Oxide Market Value & Volume, 2023-2030 ($)
Figure 84: Spain GDP and Population, 2023-2030 ($)
Figure 85: Spain GDP – Composition of 2023, By Sector of Origin
Figure 86: Spain Export and Import Value & Volume, 2023-2030 ($)
Figure 87: Denmark Erbium Oxide Market Value & Volume, 2023-2030 ($)
Figure 88: Denmark GDP and Population, 2023-2030 ($)
Figure 89: Denmark GDP – Composition of 2023, By Sector of Origin
Figure 90: Denmark Export and Import Value & Volume, 2023-2030 ($)
Figure 91: APAC Erbium Oxide Market Value & Volume, 2023-2030 ($)
Figure 92: China Erbium Oxide Market Value & Volume, 2023-2030
Figure 93: China GDP and Population, 2023-2030 ($)
Figure 94: China GDP – Composition of 2023, By Sector of Origin
Figure 95: China Export and Import Value & Volume, 2023-2030 ($)Erbium Oxide Market China Export and Import Value & Volume, 2023-2030 ($)
Figure 96: Australia Erbium Oxide Market Value & Volume, 2023-2030 ($)
Figure 97: Australia GDP and Population, 2023-2030 ($)
Figure 98: Australia GDP – Composition of 2023, By Sector of Origin
Figure 99: Australia Export and Import Value & Volume, 2023-2030 ($)
Figure 100: South Korea Erbium Oxide Market Value & Volume, 2023-2030 ($)
Figure 101: South Korea GDP and Population, 2023-2030 ($)
Figure 102: South Korea GDP – Composition of 2023, By Sector of Origin
Figure 103: South Korea Export and Import Value & Volume, 2023-2030 ($)
Figure 104: India Erbium Oxide Market Value & Volume, 2023-2030 ($)
Figure 105: India GDP and Population, 2023-2030 ($)
Figure 106: India GDP – Composition of 2023, By Sector of Origin
Figure 107: India Export and Import Value & Volume, 2023-2030 ($)
Figure 108: Taiwan Erbium Oxide Market Value & Volume, 2023-2030 ($)
Figure 109: Taiwan GDP and Population, 2023-2030 ($)
Figure 110: Taiwan GDP – Composition of 2023, By Sector of Origin
Figure 111: Taiwan Export and Import Value & Volume, 2023-2030 ($)
Figure 112: Malaysia Erbium Oxide Market Value & Volume, 2023-2030 ($)
Figure 113: Malaysia GDP and Population, 2023-2030 ($)
Figure 114: Malaysia GDP – Composition of 2023, By Sector of Origin
Figure 115: Malaysia Export and Import Value & Volume, 2023-2030 ($)
Figure 116: Hong Kong Erbium Oxide Market Value & Volume, 2023-2030 ($)
Figure 117: Hong Kong GDP and Population, 2023-2030 ($)
Figure 118: Hong Kong GDP – Composition of 2023, By Sector of Origin
Figure 119: Hong Kong Export and Import Value & Volume, 2023-2030 ($)
Figure 120: Middle East & Africa Erbium Oxide Market Middle East & Africa 3D Printing Market Value & Volume, 2023-2030 ($)
Figure 121: Russia Erbium Oxide Market Value & Volume, 2023-2030 ($)
Figure 122: Russia GDP and Population, 2023-2030 ($)
Figure 123: Russia GDP – Composition of 2023, By Sector of Origin
Figure 124: Russia Export and Import Value & Volume, 2023-2030 ($)
Figure 125: Israel Erbium Oxide Market Value & Volume, 2023-2030 ($)
Figure 126: Israel GDP and Population, 2023-2030 ($)
Figure 127: Israel GDP – Composition of 2023, By Sector of Origin
Figure 128: Israel Export and Import Value & Volume, 2023-2030 ($)
Figure 129: Entropy Share, By Strategies, 2023-2030* (%)Erbium Oxide Market
Figure 130: Developments, 2023-2030*Erbium Oxide Market
Figure 131: Company 1 Erbium Oxide Market Net Revenue, By Years, 2023-2030* ($)
Figure 132: Company 1 Erbium Oxide Market Net Revenue Share, By Business segments, 2023 (%)
Figure 133: Company 1 Erbium Oxide Market Net Sales Share, By Geography, 2023 (%)
Figure 134: Company 2 Erbium Oxide Market Net Revenue, By Years, 2023-2030* ($)
Figure 135: Company 2 Erbium Oxide Market Net Revenue Share, By Business segments, 2023 (%)
Figure 136: Company 2 Erbium Oxide Market Net Sales Share, By Geography, 2023 (%)
Figure 137: Company 3 Erbium Oxide Market Net Revenue, By Years, 2023-2030* ($)
Figure 138: Company 3 Erbium Oxide Market Net Revenue Share, By Business segments, 2023 (%)
Figure 139: Company 3 Erbium Oxide Market Net Sales Share, By Geography, 2023 (%)
Figure 140: Company 4 Erbium Oxide Market Net Revenue, By Years, 2023-2030* ($)
Figure 141: Company 4 Erbium Oxide Market Net Revenue Share, By Business segments, 2023 (%)
Figure 142: Company 4 Erbium Oxide Market Net Sales Share, By Geography, 2023 (%)
Figure 143: Company 5 Erbium Oxide Market Net Revenue, By Years, 2023-2030* ($)
Figure 144: Company 5 Erbium Oxide Market Net Revenue Share, By Business segments, 2023 (%)
Figure 145: Company 5 Erbium Oxide Market Net Sales Share, By Geography, 2023 (%)
Figure 146: Company 6 Erbium Oxide Market Net Revenue, By Years, 2023-2030* ($)
Figure 147: Company 6 Erbium Oxide Market Net Revenue Share, By Business segments, 2023 (%)
Figure 148: Company 6 Erbium Oxide Market Net Sales Share, By Geography, 2023 (%)
Figure 149: Company 7 Erbium Oxide Market Net Revenue, By Years, 2023-2030* ($)
Figure 150: Company 7 Erbium Oxide Market Net Revenue Share, By Business segments, 2023 (%)
Figure 151: Company 7 Erbium Oxide Market Net Sales Share, By Geography, 2023 (%)
Figure 152: Company 8 Erbium Oxide Market Net Revenue, By Years, 2023-2030* ($)
Figure 153: Company 8 Erbium Oxide Market Net Revenue Share, By Business segments, 2023 (%)
Figure 154: Company 8 Erbium Oxide Market Net Sales Share, By Geography, 2023 (%)
Figure 155: Company 9 Erbium Oxide Market Net Revenue, By Years, 2023-2030* ($)
Figure 156: Company 9 Erbium Oxide Market Net Revenue Share, By Business segments, 2023 (%)
Figure 157: Company 9 Erbium Oxide Market Net Sales Share, By Geography, 2023 (%)
Figure 158: Company 10 Erbium Oxide Market Net Revenue, By Years, 2023-2030* ($)
Figure 159: Company 10 Erbium Oxide Market Net Revenue Share, By Business segments, 2023 (%)
Figure 160: Company 10 Erbium Oxide Market Net Sales Share, By Geography, 2023 (%)
Figure 161: Company 11 Erbium Oxide Market Net Revenue, By Years, 2023-2030* ($)
Figure 162: Company 11 Erbium Oxide Market Net Revenue Share, By Business segments, 2023 (%)
Figure 163: Company 11 Erbium Oxide Market Net Sales Share, By Geography, 2023 (%)
Figure 164: Company 12 Erbium Oxide Market Net Revenue, By Years, 2023-2030* ($)
Figure 165: Company 12 Erbium Oxide Market Net Revenue Share, By Business segments, 2023 (%)
Figure 166: Company 12 Erbium Oxide Market Net Sales Share, By Geography, 2023 (%)
Figure 167: Company 13 Erbium Oxide Market Net Revenue, By Years, 2023-2030* ($)
Figure 168: Company 13 Erbium Oxide Market Net Revenue Share, By Business segments, 2023 (%)
Figure 169: Company 13 Erbium Oxide Market Net Sales Share, By Geography, 2023 (%)
Figure 170: Company 14 Erbium Oxide Market Net Revenue, By Years, 2023-2030* ($)
Figure 171: Company 14 Erbium Oxide Market Net Revenue Share, By Business segments, 2023 (%)
Figure 172: Company 14 Erbium Oxide Market Net Sales Share, By Geography, 2023 (%)
Figure 173: Company 15 Erbium Oxide Market Net Revenue, By Years, 2023-2030* ($)
Figure 174: Company 15 Erbium Oxide Market Net Revenue Share, By Business segments, 2023 (%)
Figure 175: Company 15 Erbium Oxide Market Net Sales Share, By Geography, 2023 (%)