 Email
Email Print
Print


Ethoxylates Market- By Product (Alcohol, Fatty Amine, Fatty Acid & Others), By Application , By Geography - Global Opportunity Analysis & Industry Forecast, 2024-2030
Ethoxylates Market Overview
Ethoxylates market size is forecast to reach $20.1 billion by 2030, after growing at a CAGR of 3.8% during 2024-2030. Ethoxylates are organic compounds that are manufactured by treatment of alcohols and phenols with ethylene oxide in the presence of potassium hydroxide as a catalyst. Ethoxylates are used as intermediates during the manufacture of detergents, surface cleaners, cosmetics, and paints. Furthermore, ethoxylates are used as emulsion stabilizers during the processing of Emulsion polymers, floor polish, and wax, as they rapidly dissolve and provide ionic stability to the emulsion. Growing demand for industrial & institutional cleaning products and surge in demand for non-ionic surfactants will propel the ethoxylates demand during the forecast period.
Ethoxylates, versatile in nature, play a pivotal role in diverse industries, including agriculture, textiles, and pharmaceuticals. In agriculture, they serve as effective emulsifiers for sprays, enhancing formulation efficacy. The textile industry benefits from ethoxylates as crucial components, contributing to improved processes and product quality. Moreover, in pharmaceuticals, ethoxylates find applications in various formulations, aligning with the industry's demand for specialized ingredients and surfactants. This widespread adoption across sectors propels market growth and underscores ethoxylates' indispensable role in diverse business landscapes.
Report Coverage
The report: “Ethoxylates Market– Forecast (2024-2030)”, by IndustryARC, covers an in-depth analysis of the following segments of the Ethoxylates Industry.
By Product: Alcohol, Fatty Amine, Fatty Acid and Others.
By Application: Household & Personal Care, Agrochemicals, Oil & Gas, Pharmaceuticals and Others.
By Geography: North America, South America, Europe, APAC, and RoW
Key Takeaways
- New product developments and increasing investments in research and development of ethoxylates are expected to drive the growth of this market.
- Among application, household & personal care segment is projected to lead the ethoxylates market during the forecast period.
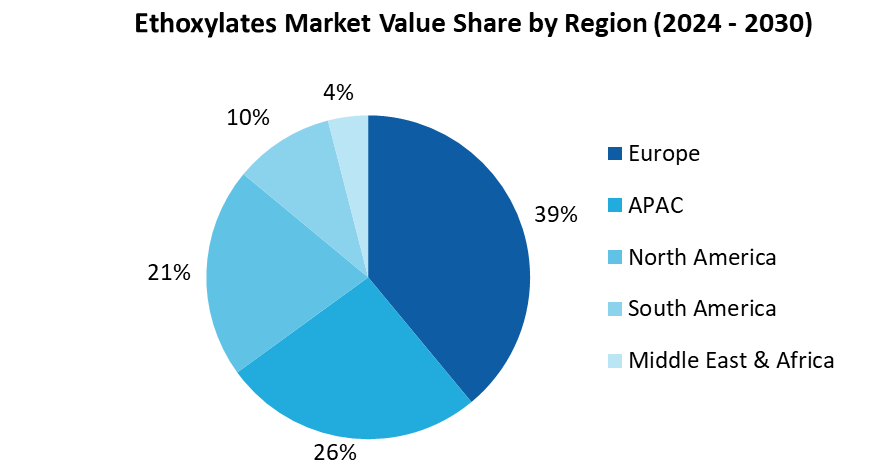
- Europe dominated the ethoxylates market.
Ethoxylates Market- Geography (%) for 2023.
For more details on this report - Request for Sample
By Product - Segment Analysis
Alcohol segment held a significant share in ethoxylates market in 2023. Alcohol ethoxylates are the most widely used type of non-ionic surfactants. Alcohol ethoxylates are composed of an alkyl chain, which is combined with ethylene oxide. These are surface active agents, substances that are used to change the surface tension of water to assist in applications such as cleansing, wetting surfaces, foaming, and emulsifying. Being non-ionic surfactants, alcohol ethoxylates can remove grease effectively, which makes them suitable to be used in laundry products, household cleaners, and hand & dishwashing liquids. Alcohol ethoxylates have many other desirable properties such as moderate foaming ability, superior cleaning of fibers, and high tolerance to water hardness. They are widely used in the manufacture of domestic detergents, household & personal care products, and I&I cleaning products.
By Application - Segment Analysis
Household & Personal Care segment held a significant share in ethoxylates market in 2023 growing fastest during the forecast period. Ethoxylates are widely used in the pharmaceutical industry in ointments, tablets, syrups, and gels as emulsifiers. Growing prevalence of chronic diseases, driven by environmental degradation and negligence towards the health and hygiene has propelled the demand for innovative and effective pharmaceutical formulations. This is expected to drive the ethoxylates demand in the pharmaceutical industry over the forecast period. Moreover, demand for generic drugs is rising among the developing countries that use ethoxylates for the manufacturing process, which is further anticipated to propel its consumption.
Demand across the organic chemicals sector shall register a slump in growth albeit increasing demand for certain chemicals that find end applications in healthcare and food. Furthermore, China, a major supplier of chemicals to the world, registered a considerable decline in manufacturing in the first quarter of 2020, following the trajectory unfolded by COVID-19's escalation to a pandemic. This has led to an imbalance in supply-demand dynamics, forcing manufacturers and customers alike to renegotiate supply agreements.
Geography- Segment Analysis
Europe dominated the ethoxylates market with a share of more than 39% in 2023, followed by Asia Pacific and North America. Improving lifestyle of the people, coupled with heightened awareness regarding personal hygiene, has driven the consumption of the personal care products. Augmented efforts and initiatives undertaken by the national governments as well as the European Commission in reviving the end-use markets for the ethoxylates, including pharmaceuticals and agrochemicals, are expected to propel product demand over the forecast period.
The market growth in Asia Pacific can be attributed to high consumption of ethoxylates owing to rapidly flourish pharmaceutical, personal care, and cleaning industries in developing economies, including China, India, Japan, and South Korea. Moreover, the region is one of the largest producers as well as exporters of palm oil with Indonesia and Malaysia constituting 60 percent of total world exports. Palm oil is one of the major raw materials used for developing fatty alcohols and amines, which are primary raw materials for obtaining ethoxylates.
Drivers – Ethoxylates Market
Increased demand of low-rinse detergents
The demand for low-rinse detergents is increasing significantly, in various applications. According to various studies, the level of foam produced does not correlate with the cleaning power of detergents, but it is proved that low-foaming detergents can be strong cleaners than the high-foaming detergents. The reason behind the increasing popularity of low-rinse detergents is that they do not ionize in solution and thus have no electrical charge, they are resistant to hardness. Companies are focusing on developing low-rinse products such as methyl ester ethoxylates, as these products produce low foam which also helps in reducing water usage. These low-foaming detergents are preferred for front-loading washing machines, automatic dishwashing machines, and rinse aids. Ethoxylates are mainly non-ionic surfactants, so with increasing demand of non-rinse detergents the demand of ethoxylates is also increasing.
Challenges – Ethoxylates Market
Availability of substitutes
With the increasing usage of substitute products in household & personal care products, the demand for ethoxylates will also decrease. Some of the ethoxylates for instance, Nonylphenol are toxic in nature, due to which they are banned in many countries. The major substitutes of ethoxylates are sodium lauryl sulfate, sodium laureth sulfate, and ammonium laurel sulfate. The market share of these substitute products is increasing, which is a barrier to the growth of ethoxylates. Increase in environmental concerns regarding the effects of toxicity coupled with diversification of raw material feedstock by other end-users may hamper market growth.
Market Landscape
Technology launches, acquisitions and R&D activities are key strategies adopted by players in the ethoxylate market. Major players in the ethoxylate market are The Dow Chemical Company, Ineos Group Limited, Huntsman International LLC, Air Products and Chemicals Inc., and Shell Chemicals. Other players include Stepan Company, Clariant AG, India Glycols Limited, Sasol Limited, and BASF SE among others.
Product Launch/ Acquisition
- In May 2022, Shell Plc made a strategic move to boost bio-based alcohol and ethoxylates capacity at its Norco, Louisiana site. This expansion aligns with the market's growing emphasis on sustainable feedstocks, reflecting a proactive approach to meet rising demands for eco-friendly ethoxylates.
- In December 2022, Clariant has invested a significant amount enhance its ethoxylation plant in China. The US$ 83 million expansion, set to conclude by end-2024, aims to meet growing demand from health care, personal care, and industrial applications. This strategic move underscores Clariant's commitment to strengthening its position in the competitive Ethoxylates Market.
For more Chemicals and Materials Market reports, please click here
1. Ethoxylates Market - Overview
1.1. Definitions and Scope
2. Ethoxylates Market - Executive summary
2.1. Market Revenue, Market Size and Key Trends by Company
2.2. Key Trends by type of Application
2.3. Key Trends segmented by Geography
3. Ethoxylates Market
3.1. Comparative analysis
3.1.1. Product Benchmarking - Top 10 companies
3.1.2. Top 5 Financials Analysis
3.1.3. Market Value split by Top 10 companies
3.1.4. Patent Analysis - Top 10 companies
3.1.5. Pricing Analysis
4. Ethoxylates Market – Startup companies Scenario Premium
4.1. Top 10 startup company Analysis by
4.1.1. Investment
4.1.2. Revenue
4.1.3. Market Shares
4.1.4. Market Size and Application Analysis
4.1.5. Venture Capital and Funding Scenario
5. Ethoxylates Market – Industry Market Entry Scenario Premium
5.1. Regulatory Framework Overview
5.2. New Business and Ease of Doing business index
5.3. Case studies of successful ventures
5.4. Customer Analysis – Top 10 companies
6. Ethoxylates Market Forces
6.1. Drivers
6.2. Constraints
6.3. Challenges
6.4. Porters five force model
6.4.1. Bargaining power of suppliers
6.4.2. Bargaining powers of customers
6.4.3. Threat of new entrants
6.4.4. Rivalry among existing players
6.4.5. Threat of substitutes
7. Ethoxylates Market -Strategic analysis
7.1. Value chain analysis
7.2. Opportunities analysis
7.3. Product life cycle
7.4. Suppliers and distributors Market Share
8. Ethoxylates Market – By Type (Market Size -$Million / $Billion)
8.1. Market Size and Market Share Analysis
8.2. Application Revenue and Trend Research
8.3. Product Segment Analysis
8.3.1. Alcohol Ethoxylates (AE)
8.3.2. Fatty Amine Ethoxylates
8.3.3. Fatty Acid Ethoxylates
8.3.4. Methyl Ester Ethoxylates (MEE)
8.3.5. Glyceride Ethoxylates
8.3.6. Other Ethoxylates
9. Ethoxylates Market – By Applications (Market Size -$Million / $Billion)
9.1. Agrochemicals
9.2. Household & Personal Care
9.3. Pharmaceutical
9.4. Oilfield Chemicals
9.5. Other Applications
10. Ethoxylates - By Geography (Market Size -$Million / $Billion)
10.1 North America
10.1.1 USA
10.1.2 Canada
10.1.3 Mexico
10.2 South America
10.2.1 Brazil
10.2.2 Argentina
10.2.3 Colombia
10.2.4 Chile
10.2.5 Rest of South America
10.3 Europe
10.3.1 UK
10.3.2 Germany
10.3.3 France
10.3.4 Italy
10.3.5 Netherlands
10.3.6 Spain
10.3.7 Russia
10.3.8 Belgium
10.3.9 Rest of Europe
10.4 Asia-Pacific
10.4.1 China
10.4.2 Japan
10.4.3 India
10.4.4 South Korea
10.4.5 Australia and New Zeeland
10.4.6 Indonesia
10.4.7 Taiwan
10.4.8 Malaysia
10.4.9 Rest of APAC
10.5 Rest of the World
10.5.1 Middle East
10.5.1.1 Saudi Arabia
10.5.1.2 UAE
10.5.1.3 Israel
10.5.1.4 Rest of the Middle East
10.5.2 Africa
10.5.2.1 South Africa
10.5.2.2 Nigeria
10.5.2.3 Rest of Africa
11. Ethoxylates Market - Entropy
11.1. New product launches
11.2. M&A's, collaborations, JVs and partnerships
12. Ethoxylates Market – Industry / Segment Competition landscape Premium
12.1. Market Share Analysis
12.1.1. Market Share by Country- Top companies
12.1.2. Market Share by Region- Top 10 companies
12.1.3. Market Share by type of Application – Top 10 companies
12.1.4. Market Share by type of Product / Product category- Top 10 companies
12.1.5. Market Share at global level- Top 10 companies
12.1.6. Best Practises for companies
13. Ethoxylates Market – Key Company List by Country Premium
14. Ethoxylates Market Company Analysis
14.1. Market Share, Company Revenue, Products, M&A, Developments
14.2. Shell Chemicals (Subsidiary of Royal Dutch Shell PLC)
14.3. Huntsman International LLC
14.4. The Dow Chemical Company
14.5. Air Products and Chemicals Inc.
14.6. INEOS Group Limited
14.7. Stepan Company
14.8. Clariant AG
14.9. India Glycols Limited
14.10. Sasol Limited
14.11. BASF SE
15. Ethoxylates Market - Appendix
15.1. Abbreviations
15.2. Sources
16. Ethoxylates Market - Methodology
16.1. Research Methodology
16.1.1. Company Expert Interviews
16.1.2. Industry Databases
16.1.3. Associations
16.1.4. Company News
16.1.5. Company Annual Reports
16.1.6. Application Trends
16.1.7. New Products and Product database
16.1.8. Company Transcripts
16.1.9. R&D Trends
16.1.10. Key Opinion Leaders Interviews
16.1.11. Supply and Demand Trends
"*Financials would be provided on a best efforts basis for private companies"
List of Tables:
Table1: Ethoxylates Market Overview 2023-2030
Table2: Ethoxylates Market Leader Analysis 2023-2030 (US$)
Table3: Ethoxylates Market Product Analysis 2023-2030 (US$)
Table4: Ethoxylates Market End User Analysis 2023-2030 (US$)
Table5: Ethoxylates Market Patent Analysis 2013-2023* (US$)
Table6: Ethoxylates Market Financial Analysis 2023-2030 (US$)
Table7: Ethoxylates Market Driver Analysis 2023-2030 (US$)
Table8: Ethoxylates Market Challenges Analysis 2023-2030 (US$)
Table9: Ethoxylates Market Constraint Analysis 2023-2030 (US$)
Table10: Ethoxylates Market Supplier Bargaining Power Analysis 2023-2030 (US$)
Table11: Ethoxylates Market Buyer Bargaining Power Analysis 2023-2030 (US$)
Table12: Ethoxylates Market Threat of Substitutes Analysis 2023-2030 (US$)
Table13: Ethoxylates Market Threat of New Entrants Analysis 2023-2030 (US$)
Table14: Ethoxylates Market Degree of Competition Analysis 2023-2030 (US$)
Table15: Ethoxylates Market Value Chain Analysis 2023-2030 (US$)
Table16: Ethoxylates Market Pricing Analysis 2023-2030 (US$)
Table17: Ethoxylates Market Opportunities Analysis 2023-2030 (US$)
Table18: Ethoxylates Market Product Life Cycle Analysis 2023-2030 (US$)
Table19: Ethoxylates Market Supplier Analysis 2023-2030 (US$)
Table20: Ethoxylates Market Distributor Analysis 2023-2030 (US$)
Table21: Ethoxylates Market Trend Analysis 2023-2030 (US$)
Table22: Ethoxylates Market Size 2023 (US$)
Table23: Ethoxylates Market Forecast Analysis 2023-2030 (US$)
Table24: Ethoxylates Market Sales Forecast Analysis 2023-2030 (Units)
Table25: Ethoxylates Market, Revenue & Volume, By Type, 2023-2030 ($)
Table26: Ethoxylates Market By Type, Revenue & Volume, By Alcohol Ethoxylates (AE), 2023-2030 ($)
Table27: Ethoxylates Market By Type, Revenue & Volume, By Fatty Amine Ethoxylates, 2023-2030 ($)
Table28: Ethoxylates Market By Type, Revenue & Volume, By Fatty Acid Ethoxylates, 2023-2030 ($)
Table29: Ethoxylates Market By Type, Revenue & Volume, By Methyl Ester Ethoxylates (MEE), 2023-2030 ($)
Table30: Ethoxylates Market By Type, Revenue & Volume, By Glyceride Ethoxylates, 2023-2030 ($)
Table31: Ethoxylates Market, Revenue & Volume, By Application, 2023-2030 ($)
Table32: Ethoxylates Market By Application, Revenue & Volume, By Agrochemicals, 2023-2030 ($)
Table33: Ethoxylates Market By Application, Revenue & Volume, By Household & Personal Care, 2023-2030 ($)
Table34: Ethoxylates Market By Application, Revenue & Volume, By Pharmaceutical, 2023-2030 ($)
Table35: Ethoxylates Market By Application, Revenue & Volume, By Oilfield Chemicals, 2023-2030 ($)
Table36: North America Ethoxylates Market, Revenue & Volume, By Type, 2023-2030 ($)
Table37: North America Ethoxylates Market, Revenue & Volume, By Application, 2023-2030 ($)
Table38: South america Ethoxylates Market, Revenue & Volume, By Type, 2023-2030 ($)
Table39: South america Ethoxylates Market, Revenue & Volume, By Application, 2023-2030 ($)
Table40: Europe Ethoxylates Market, Revenue & Volume, By Type, 2023-2030 ($)
Table41: Europe Ethoxylates Market, Revenue & Volume, By Application, 2023-2030 ($)
Table42: APAC Ethoxylates Market, Revenue & Volume, By Type, 2023-2030 ($)
Table43: APAC Ethoxylates Market, Revenue & Volume, By Application, 2023-2030 ($)
Table44: Middle East & Africa Ethoxylates Market, Revenue & Volume, By Type, 2023-2030 ($)
Table45: Middle East & Africa Ethoxylates Market, Revenue & Volume, By Application, 2023-2030 ($)
Table46: Russia Ethoxylates Market, Revenue & Volume, By Type, 2023-2030 ($)
Table47: Russia Ethoxylates Market, Revenue & Volume, By Application, 2023-2030 ($)
Table48: Israel Ethoxylates Market, Revenue & Volume, By Type, 2023-2030 ($)
Table49: Israel Ethoxylates Market, Revenue & Volume, By Application, 2023-2030 ($)
Table50: Top Companies 2023 (US$)Ethoxylates Market, Revenue & Volume
Table51: Product Launch 2023-2030Ethoxylates Market, Revenue & Volume
Table52: Mergers & Acquistions 2023-2030Ethoxylates Market, Revenue & Volume
List of Figures:
Figure 1: Overview of Ethoxylates Market 2023-2030
Figure 2: Market Share Analysis for Ethoxylates Market 2023 (US$)
Figure 3: Product Comparison in Ethoxylates Market 2023-2030 (US$)
Figure 4: End User Profile for Ethoxylates Market 2023-2030 (US$)
Figure 5: Patent Application and Grant in Ethoxylates Market 2013-2023* (US$)
Figure 6: Top 5 Companies Financial Analysis in Ethoxylates Market 2023-2030 (US$)
Figure 7: Market Entry Strategy in Ethoxylates Market 2023-2030
Figure 8: Ecosystem Analysis in Ethoxylates Market 2023
Figure 9: Average Selling Price in Ethoxylates Market 2023-2030
Figure 10: Top Opportunites in Ethoxylates Market 2023-2030
Figure 11: Market Life Cycle Analysis in Ethoxylates Market
Figure 12: GlobalBy TypeEthoxylates Market Revenue, 2023-2030 ($)
Figure 13: GlobalBy ApplicationEthoxylates Market Revenue, 2023-2030 ($)
Figure 14: Global Ethoxylates Market - By Geography
Figure 15: Global Ethoxylates Market Value & Volume, By Geography, 2023-2030 ($)
Figure 16: Global Ethoxylates Market CAGR, By Geography, 2023-2030 (%)
Figure 17: North America Ethoxylates Market Value & Volume, 2023-2030 ($)
Figure 18: US Ethoxylates Market Value & Volume, 2023-2030 ($)
Figure 19: US GDP and Population, 2023-2030 ($)
Figure 20: US GDP – Composition of 2023, By Sector of Origin
Figure 21: US Export and Import Value & Volume, 2023-2030 ($)
Figure 22: Canada Ethoxylates Market Value & Volume, 2023-2030 ($)
Figure 23: Canada GDP and Population, 2023-2030 ($)
Figure 24: Canada GDP – Composition of 2023, By Sector of Origin
Figure 25: Canada Export and Import Value & Volume, 2023-2030 ($)
Figure 26: Mexico Ethoxylates Market Value & Volume, 2023-2030 ($)
Figure 27: Mexico GDP and Population, 2023-2030 ($)
Figure 28: Mexico GDP – Composition of 2023, By Sector of Origin
Figure 29: Mexico Export and Import Value & Volume, 2023-2030 ($)
Figure 30: South America Ethoxylates Market Value & Volume, 2023-2030 ($)
Figure 31: Brazil Ethoxylates Market Value & Volume, 2023-2030 ($)
Figure 32: Brazil GDP and Population, 2023-2030 ($)
Figure 33: Brazil GDP – Composition of 2023, By Sector of Origin
Figure 34: Brazil Export and Import Value & Volume, 2023-2030 ($)
Figure 35: Venezuela Ethoxylates Market Value & Volume, 2023-2030 ($)
Figure 36: Venezuela GDP and Population, 2023-2030 ($)
Figure 37: Venezuela GDP – Composition of 2023, By Sector of Origin
Figure 38: Venezuela Export and Import Value & Volume, 2023-2030 ($)
Figure 39: Argentina Ethoxylates Market Value & Volume, 2023-2030 ($)
Figure 40: Argentina GDP and Population, 2023-2030 ($)
Figure 41: Argentina GDP – Composition of 2023, By Sector of Origin
Figure 42: Argentina Export and Import Value & Volume, 2023-2030 ($)
Figure 43: Ecuador Ethoxylates Market Value & Volume, 2023-2030 ($)
Figure 44: Ecuador GDP and Population, 2023-2030 ($)
Figure 45: Ecuador GDP – Composition of 2023, By Sector of Origin
Figure 46: Ecuador Export and Import Value & Volume, 2023-2030 ($)
Figure 47: Peru Ethoxylates Market Value & Volume, 2023-2030 ($)
Figure 48: Peru GDP and Population, 2023-2030 ($)
Figure 49: Peru GDP – Composition of 2023, By Sector of Origin
Figure 50: Peru Export and Import Value & Volume, 2023-2030 ($)
Figure 51: Colombia Ethoxylates Market Value & Volume, 2023-2030 ($)
Figure 52: Colombia GDP and Population, 2023-2030 ($)
Figure 53: Colombia GDP – Composition of 2023, By Sector of Origin
Figure 54: Colombia Export and Import Value & Volume, 2023-2030 ($)
Figure 55: Costa Rica Ethoxylates Market Value & Volume, 2023-2030 ($)
Figure 56: Costa Rica GDP and Population, 2023-2030 ($)
Figure 57: Costa Rica GDP – Composition of 2023, By Sector of Origin
Figure 58: Costa Rica Export and Import Value & Volume, 2023-2030 ($)
Figure 59: Europe Ethoxylates Market Value & Volume, 2023-2030 ($)
Figure 60: U.K Ethoxylates Market Value & Volume, 2023-2030 ($)
Figure 61: U.K GDP and Population, 2023-2030 ($)
Figure 62: U.K GDP – Composition of 2023, By Sector of Origin
Figure 63: U.K Export and Import Value & Volume, 2023-2030 ($)
Figure 64: Germany Ethoxylates Market Value & Volume, 2023-2030 ($)
Figure 65: Germany GDP and Population, 2023-2030 ($)
Figure 66: Germany GDP – Composition of 2023, By Sector of Origin
Figure 67: Germany Export and Import Value & Volume, 2023-2030 ($)
Figure 68: Italy Ethoxylates Market Value & Volume, 2023-2030 ($)
Figure 69: Italy GDP and Population, 2023-2030 ($)
Figure 70: Italy GDP – Composition of 2023, By Sector of Origin
Figure 71: Italy Export and Import Value & Volume, 2023-2030 ($)
Figure 72: France Ethoxylates Market Value & Volume, 2023-2030 ($)
Figure 73: France GDP and Population, 2023-2030 ($)
Figure 74: France GDP – Composition of 2023, By Sector of Origin
Figure 75: France Export and Import Value & Volume, 2023-2030 ($)
Figure 76: Netherlands Ethoxylates Market Value & Volume, 2023-2030 ($)
Figure 77: Netherlands GDP and Population, 2023-2030 ($)
Figure 78: Netherlands GDP – Composition of 2023, By Sector of Origin
Figure 79: Netherlands Export and Import Value & Volume, 2023-2030 ($)
Figure 80: Belgium Ethoxylates Market Value & Volume, 2023-2030 ($)
Figure 81: Belgium GDP and Population, 2023-2030 ($)
Figure 82: Belgium GDP – Composition of 2023, By Sector of Origin
Figure 83: Belgium Export and Import Value & Volume, 2023-2030 ($)
Figure 84: Spain Ethoxylates Market Value & Volume, 2023-2030 ($)
Figure 85: Spain GDP and Population, 2023-2030 ($)
Figure 86: Spain GDP – Composition of 2023, By Sector of Origin
Figure 87: Spain Export and Import Value & Volume, 2023-2030 ($)
Figure 88: Denmark Ethoxylates Market Value & Volume, 2023-2030 ($)
Figure 89: Denmark GDP and Population, 2023-2030 ($)
Figure 90: Denmark GDP – Composition of 2023, By Sector of Origin
Figure 91: Denmark Export and Import Value & Volume, 2023-2030 ($)
Figure 92: APAC Ethoxylates Market Value & Volume, 2023-2030 ($)
Figure 93: China Ethoxylates Market Value & Volume, 2023-2030
Figure 94: China GDP and Population, 2023-2030 ($)
Figure 95: China GDP – Composition of 2023, By Sector of Origin
Figure 96: China Export and Import Value & Volume, 2023-2030 ($)Ethoxylates Market China Export and Import Value & Volume, 2023-2030 ($)
Figure 97: Australia Ethoxylates Market Value & Volume, 2023-2030 ($)
Figure 98: Australia GDP and Population, 2023-2030 ($)
Figure 99: Australia GDP – Composition of 2023, By Sector of Origin
Figure 100: Australia Export and Import Value & Volume, 2023-2030 ($)
Figure 101: South Korea Ethoxylates Market Value & Volume, 2023-2030 ($)
Figure 102: South Korea GDP and Population, 2023-2030 ($)
Figure 103: South Korea GDP – Composition of 2023, By Sector of Origin
Figure 104: South Korea Export and Import Value & Volume, 2023-2030 ($)
Figure 105: India Ethoxylates Market Value & Volume, 2023-2030 ($)
Figure 106: India GDP and Population, 2023-2030 ($)
Figure 107: India GDP – Composition of 2023, By Sector of Origin
Figure 108: India Export and Import Value & Volume, 2023-2030 ($)
Figure 109: Taiwan Ethoxylates Market Value & Volume, 2023-2030 ($)
Figure 110: Taiwan GDP and Population, 2023-2030 ($)
Figure 111: Taiwan GDP – Composition of 2023, By Sector of Origin
Figure 112: Taiwan Export and Import Value & Volume, 2023-2030 ($)
Figure 113: Malaysia Ethoxylates Market Value & Volume, 2023-2030 ($)
Figure 114: Malaysia GDP and Population, 2023-2030 ($)
Figure 115: Malaysia GDP – Composition of 2023, By Sector of Origin
Figure 116: Malaysia Export and Import Value & Volume, 2023-2030 ($)
Figure 117: Hong Kong Ethoxylates Market Value & Volume, 2023-2030 ($)
Figure 118: Hong Kong GDP and Population, 2023-2030 ($)
Figure 119: Hong Kong GDP – Composition of 2023, By Sector of Origin
Figure 120: Hong Kong Export and Import Value & Volume, 2023-2030 ($)
Figure 121: Middle East & Africa Ethoxylates Market Middle East & Africa 3D Printing Market Value & Volume, 2023-2030 ($)
Figure 122: Russia Ethoxylates Market Value & Volume, 2023-2030 ($)
Figure 123: Russia GDP and Population, 2023-2030 ($)
Figure 124: Russia GDP – Composition of 2023, By Sector of Origin
Figure 125: Russia Export and Import Value & Volume, 2023-2030 ($)
Figure 126: Israel Ethoxylates Market Value & Volume, 2023-2030 ($)
Figure 127: Israel GDP and Population, 2023-2030 ($)
Figure 128: Israel GDP – Composition of 2023, By Sector of Origin
Figure 129: Israel Export and Import Value & Volume, 2023-2030 ($)
Figure 130: Entropy Share, By Strategies, 2023-2030* (%)Ethoxylates Market
Figure 131: Developments, 2023-2030*Ethoxylates Market
Figure 132: Company 1 Ethoxylates Market Net Revenue, By Years, 2023-2030* ($)
Figure 133: Company 1 Ethoxylates Market Net Revenue Share, By Business segments, 2023 (%)
Figure 134: Company 1 Ethoxylates Market Net Sales Share, By Geography, 2023 (%)
Figure 135: Company 2 Ethoxylates Market Net Revenue, By Years, 2023-2030* ($)
Figure 136: Company 2 Ethoxylates Market Net Revenue Share, By Business segments, 2023 (%)
Figure 137: Company 2 Ethoxylates Market Net Sales Share, By Geography, 2023 (%)
Figure 138: Company 3 Ethoxylates Market Net Revenue, By Years, 2023-2030* ($)
Figure 139: Company 3 Ethoxylates Market Net Revenue Share, By Business segments, 2023 (%)
Figure 140: Company 3 Ethoxylates Market Net Sales Share, By Geography, 2023 (%)
Figure 141: Company 4 Ethoxylates Market Net Revenue, By Years, 2023-2030* ($)
Figure 142: Company 4 Ethoxylates Market Net Revenue Share, By Business segments, 2023 (%)
Figure 143: Company 4 Ethoxylates Market Net Sales Share, By Geography, 2023 (%)
Figure 144: Company 5 Ethoxylates Market Net Revenue, By Years, 2023-2030* ($)
Figure 145: Company 5 Ethoxylates Market Net Revenue Share, By Business segments, 2023 (%)
Figure 146: Company 5 Ethoxylates Market Net Sales Share, By Geography, 2023 (%)
Figure 147: Company 6 Ethoxylates Market Net Revenue, By Years, 2023-2030* ($)
Figure 148: Company 6 Ethoxylates Market Net Revenue Share, By Business segments, 2023 (%)
Figure 149: Company 6 Ethoxylates Market Net Sales Share, By Geography, 2023 (%)
Figure 150: Company 7 Ethoxylates Market Net Revenue, By Years, 2023-2030* ($)
Figure 151: Company 7 Ethoxylates Market Net Revenue Share, By Business segments, 2023 (%)
Figure 152: Company 7 Ethoxylates Market Net Sales Share, By Geography, 2023 (%)
Figure 153: Company 8 Ethoxylates Market Net Revenue, By Years, 2023-2030* ($)
Figure 154: Company 8 Ethoxylates Market Net Revenue Share, By Business segments, 2023 (%)
Figure 155: Company 8 Ethoxylates Market Net Sales Share, By Geography, 2023 (%)
Figure 156: Company 9 Ethoxylates Market Net Revenue, By Years, 2023-2030* ($)
Figure 157: Company 9 Ethoxylates Market Net Revenue Share, By Business segments, 2023 (%)
Figure 158: Company 9 Ethoxylates Market Net Sales Share, By Geography, 2023 (%)
Figure 159: Company 10 Ethoxylates Market Net Revenue, By Years, 2023-2030* ($)
Figure 160: Company 10 Ethoxylates Market Net Revenue Share, By Business segments, 2023 (%)
Figure 161: Company 10 Ethoxylates Market Net Sales Share, By Geography, 2023 (%)
Figure 162: Company 11 Ethoxylates Market Net Revenue, By Years, 2023-2030* ($)
Figure 163: Company 11 Ethoxylates Market Net Revenue Share, By Business segments, 2023 (%)
Figure 164: Company 11 Ethoxylates Market Net Sales Share, By Geography, 2023 (%)
Figure 165: Company 12 Ethoxylates Market Net Revenue, By Years, 2023-2030* ($)
Figure 166: Company 12 Ethoxylates Market Net Revenue Share, By Business segments, 2023 (%)
Figure 167: Company 12 Ethoxylates Market Net Sales Share, By Geography, 2023 (%)
Figure 168: Company 13 Ethoxylates Market Net Revenue, By Years, 2023-2030* ($)
Figure 169: Company 13 Ethoxylates Market Net Revenue Share, By Business segments, 2023 (%)
Figure 170: Company 13 Ethoxylates Market Net Sales Share, By Geography, 2023 (%)
Figure 171: Company 14 Ethoxylates Market Net Revenue, By Years, 2023-2030* ($)
Figure 172: Company 14 Ethoxylates Market Net Revenue Share, By Business segments, 2023 (%)
Figure 173: Company 14 Ethoxylates Market Net Sales Share, By Geography, 2023 (%)
Figure 174: Company 15 Ethoxylates Market Net Revenue, By Years, 2023-2030* ($)
Figure 175: Company 15 Ethoxylates Market Net Revenue Share, By Business segments, 2023 (%)
Figure 176: Company 15 Ethoxylates Market Net Sales Share, By Geography, 2023 (%)