 Email
Email Print
Print


Eye Infections Treatment Market - Forecast(2024 - 2030)
Eye Infections Treatment Market Overview
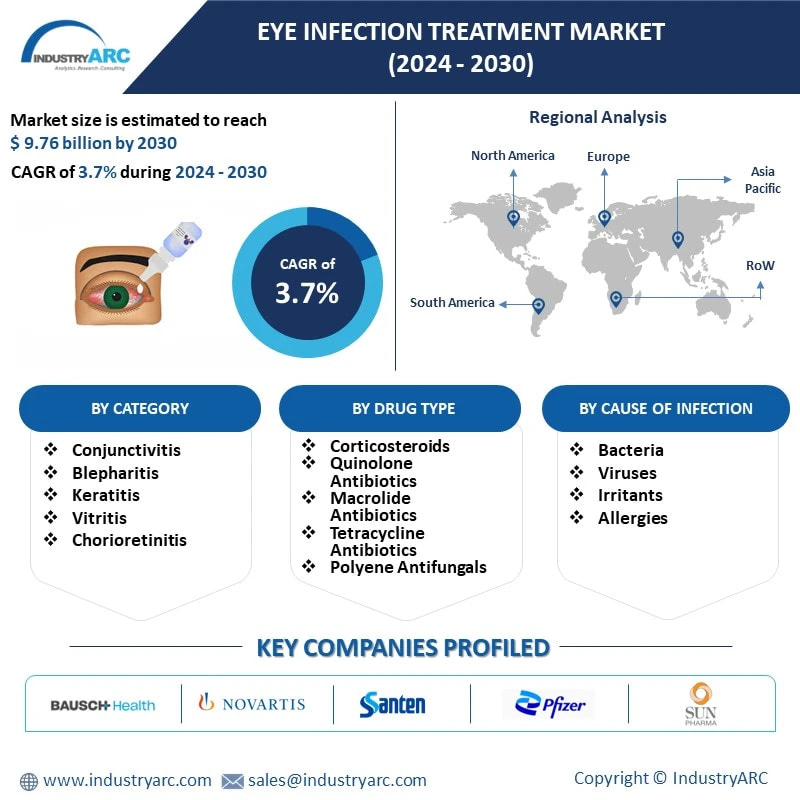
The Eye Infections Treatment market size is estimated to reach US$9.76 billion by 2030 after growing at a CAGR of around 3.7% from 2024 to 2030. The Eye Infections Treatment market encompasses a broad spectrum of pharmaceuticals, devices, and procedures aimed at addressing various ocular infections, ranging from conjunctivitis to more severe conditions like keratitis. This market is driven by factors such as the increasing incidence of eye infections globally, growing awareness about eye health, and advancements in medical technology. One significant trend within the Eye Infections Treatment market is the rising adoption of innovative drug delivery systems. Traditional eye drops and ointments are being supplemented and sometimes replaced by sustained-release implants, punctal plugs, and contact lenses embedded with medication. These advanced delivery systems offer benefits such as prolonged drug release, enhanced patient compliance, and improved efficacy, thus revolutionizing the treatment landscape for eye infections. Another noteworthy trend is the growing emphasis on personalized medicine and targeted therapies. With advancements in genetic testing and molecular diagnostics, healthcare providers can now identify specific pathogens causing eye infections and tailor treatment regimens accordingly. This approach not only ensures more effective outcomes but also helps minimize the risk of antimicrobial resistance by avoiding unnecessary broad-spectrum antibiotic use. As a result, the Eye Infections Treatment market is witnessing significant growth driven by technological advancements and a growing focus on personalized medicine. As the prevalence of eye infections continues to rise, stakeholders are increasingly investing in research and development to bring innovative therapies to market, ultimately improving patient outcomes and quality of life. These are the factors that drive the demand for eye infection treatments in the forecast year.
Market Snapshot:
Report Coverage
The “Eye Infections Treatment Market Report – Forecast (2024 – 2030)”, by IndustryARC, covers an in-depth analysis of the following segments of the Eye Infections Treatment industry.
By Category: Conjunctivitis, Blepharitis, Keratitis, Vitritis, Chorioretinitis and Neuroretinitis
By Cause of Infection: Bacteria, Viruses, Irritants and Allergies
By Drug Type: Corticosteroids, Quinolone Antibiotics, Macrolide Antibiotics, Tetracycline Antibiotics, Polyene Antifungals, Aminoglycoside Antibiotic / Polypeptide Antibiotic / Corticosteroid Combinations, Aminoglycoside Antibiotics, Sulfa Antibiotics and Others
By Distribution Channels: Hospital Pharmacies, Retail Pharmacies, Online Pharmacies, Drug Stores
By Geography - North America, Europe, Asia-Pacific, South America, Rest of the World
Key Takeaways
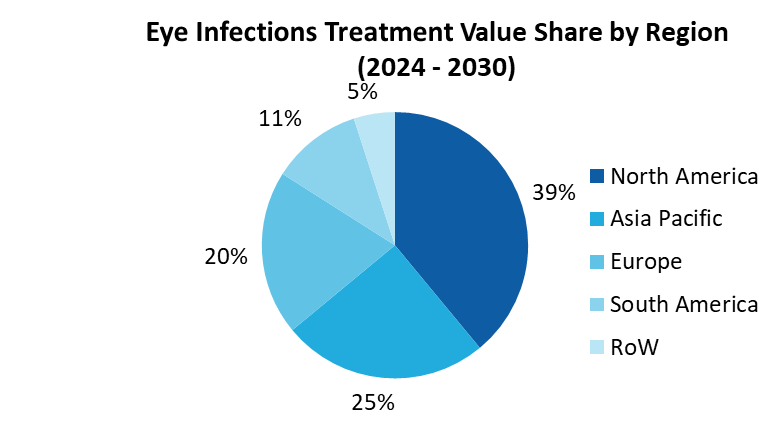
● North America held the largest share of the Eye Infections Treatment market share of 39% in 2023.
● The field of ophthalmology has seen continuous advancements in treatment options. Innovations in drug delivery systems, surgical techniques, and pharmaceutical formulations have played a significant role in improving the efficacy and convenience of eye infection treatments.
● The aging population is more susceptible to eye infections due to weakened immune systems and age-related ocular changes. This demographic shift contributes to the increasing demand for eye infection treatments.
For More Details on This Report - Request for Sample
Eye Infections Treatment Market Segment Analysis – By Category
The Conjunctivitis segment held a significant share of the Eye Infections Treatment market in 2023. The demand for treatments for conjunctivitis, a common eye infection, continues to rise due to factors such as increasing environmental pollution and allergens, as well as contagious outbreaks. For instance, according to the National Center for Biotechnology Information (NCBI) in 2023, Viral conjunctivitis, a prevalent cause of red-eye, affects people of all ages and backgrounds. It constitutes 75% of infectious cases, emphasizing its widespread occurrence in diverse populations. Pharmaceutical companies continue to innovate and develop targeted therapies, including antibiotics, antivirals, and anti-inflammatory drugs, to address varying causes and severities of conjunctivitis, meeting the demand for improved patient outcomes.
Eye Infections Treatment Market Segment Analysis – By Distribution Channels
The retail pharmacies sector held a significant share of the Eye Infections Treatment market in 2023. Retail pharmacies are experiencing a notable surge in demand for products related to the Eye Infections Treatment Market. With an increasing number of individuals seeking remedies for eye infections, retail pharmacies are witnessing heightened interest in specialized medications, eye drops, and ointments tailored for various ocular conditions. This trend underscores the significance of accessible and effective treatments for eye ailments in the retail sector.
Eye Infections Treatment Market Segment Analysis – By Geography
North America held the largest share of the Eye Infections Treatment market in 2023, with a share of over 39%. Eye infections are a common problem, affecting millions of people in North America each year. The most common types of eye infections include conjunctivitis, keratitis, and endophthalmitis. The prevalence of eye infections is expected to increase in the coming years due to several factors, including the growing use of contact lenses, the increasing number of people with chronic conditions such as diabetes, and the aging population. As per the National Institutes of Health (NIH), in 2022, Allergic conjunctivitis, common among the population, is a frequent concern for eye specialists, impacting up to 40% of individuals. Ophthalmologists often address this prevalent ocular condition. This indicates a growing market for effective and targeted solutions for managing various eye infections.
Eye Infections Treatment Market Drivers
The demand for eye infection treatment is driven by factors such as the launch of new drugs, changing population demographics, and the rising prevalence of eye infections due to ocular surgical procedures. For instance, As of June 2022, the WHO reports that 125 million individuals reside in trachoma-endemic regions, facing the risk of trachoma-induced blindness. This increasing incidence of eye infections emphasizes the necessity for accessible and innovative solutions, driving the demand for eye infection treatment worldwide. Additionally, the global eye care market has been growing steadily, driven by an aging population, increasing prevalence of eye diseases.
Prevalence of Contact Lens-Related Infections
The escalating prevalence of contact lens-related infections underscores the imperative for efficacious treatments in addressing the growing demand for eye infection remedies. As the popularity of contact lenses rises, so does the frequency of associated eye infections, necessitating prompt and effective solutions. The demand for eye infection treatments is driven by factors such as increased contact lens usage and the desire for swift, reliable remedies. This surge in demand emphasizes the critical need for advanced therapeutic interventions, promoting eye health and providing relief for individuals grappling with contact lens-related infections.
Eye Infections Treatment Market Challenge
High Cost of Treatment
The Eye Infections Treatment market faces challenges due to the exorbitant costs associated with medications, diagnostic tests, and specialized care. This financial burden creates disparities in access to essential treatments, hindering patient care. Affordability issues prevent some individuals from seeking timely medical attention, exacerbating the impact of eye infections. Addressing the cost barrier is crucial for ensuring equitable access to necessary healthcare services within the Eye Infections Treatment market.
Eye Infections Treatment Industry Outlook
The companies to develop a strong regional presence and strengthen their market position, continuously engage in mergers and acquisitions. In the Eye Infections Treatment market report, the Eye Infections Treatment top 10 companies are: Bausch Health Companies Inc., Novartis International AG, Santen Pharmaceutical Co., Ltd.,Pfizer, Sun Eye Care Pharmaceuticals Pvt. Ltd., Ocular Therapeutix, Johnson & Johnson Consumer Inc., GlaxoSmithKline Pharmaceuticals Ltd, Alcon Inc., AbbVie Inc, among others.
Recent Developments
● In March 2022 Bausch + Lomb and Clearside Biomedical have launched XIPERE® (Triamcinolone Acetonide Injectable Suspension) in the U.S. for treating macular edema linked with uveitis. This therapy, administered through suprachoroidal use, is the sole FDA-approved treatment for this type of eye inflammation.
● In April 2022 Sandoz introduces generic brimonidine tartrate/timolol maleate eyedrops in the US, enhancing its ophthalmic offerings for ocular hypertension patients, reaffirming its commitment to providing affordable and accessible healthcare solutions.
For More For Lifesciences and Healthcare Market Reports, Please Click Here
1.Eye Infections Treatment Market - Overview
1.1 Definitions and Scope
2. Eye Infections Treatment Market - Executive Summary
2.1 Key Trends by Category
2.2 Key Trends by Cause of Infection
2.3 Key Trends by Drug Type
2.4 Key Trends by Distribution Channels
2.5 Key Trends by Geography
3. Eye Infections Treatment Market - Comparative Analysis
3.1 Company Benchmarking
3.2 Global Financial Analysis
3.3 Market Share Analysis
3.4 Patent Analysis
3.5 Pricing Analysis
4. Eye Infections Treatment Market - Start-up Companies Scenario
4.1 Key Start-up Company Analysis by
4.1.1 Investment
4.1.2 Revenue
4.1.3 Venture Capital and Funding Scenario
5. Eye Infections Treatment Market – Market Entry Scenario Premium
5.1 Regulatory Framework Overview
5.2 New Business and Ease of Doing Business Index
5.3 Case Studies of Successful Ventures
6. Eye Infections Treatment Market - Forces
6.1 Market Drivers
6.2 Market Constraints/Challenges
6.3 Porter’s Five Force Model
6.3.1 Bargaining power of suppliers
6.3.2 Bargaining powers of customers
6.3.3 Threat of new entrants
6.3.4 Rivalry among existing players
6.3.5 Threat of substitutes
7. Eye Infections Treatment Market – Strategic Analysis
7.1 Value Chain Analysis
7.2 Opportunities Analysis
7.3 Market Life Cycle
8. Eye Infections Treatment Market – By Category (Market Size – US$ Million/ Billion)
8.1 Conjunctivitis
8.2 Blepharitis
8.3 Keratitis
8.4 Vitritis
8.5 Chorioretinitis
8.6 Neuroretinitis
9. Eye Infections Treatment Market – By Cause of Infection (Market Size – US$ Million/ Billion)
9.1 Bacteria
9.2 Viruses
9.3 Irritants
9.4 Allergies
10. Eye Infections Treatment Market – By Drug Type (Market Size – US$ Million/ Billion)
10.1 Corticosteroids
10.2 Quinolone Antibiotics
10.3 Macrolide Antibiotics
10.4 Tetracycline Antibiotics
10.5 Polyene Antifungals
10.6 Aminoglycoside Antibiotic / Polypeptide Antibiotic / Corticosteroid Combinations
10.7 Aminoglycoside Antibiotics
10.8 Sulfa Antibiotics
10.9 Others
11. Eye Infections Treatment Market – By Distribution Channels (Market Size - US$ Million/Billion)
11.1 Hospital Pharmacies
11.2 Retail Pharmacies
11.3 Online Pharmacies
11.4 Drug Stores
11.5 Others
12. Eye Infections Treatment Market – by Geography (Market Size - $Million/$Billion)
12.1 North America
12.1.1 U.S.
12.1.2 Canada
12.1.3 Mexico
12.2 Europe
12.2.1 U.K.
12.2.2 Germany
12.2.3 France
12.2.4 Italy
12.2.5 Netherlands
12.2.6 Spain
12.2.7 Rest of Europe
12.3 Asia-Pacific
12.3.1 China
12.3.2 Japan
12.3.3 India
12.3.4 South Korea
12.3.5 Australia & New Zealand
12.3.6 Rest of Asia-Pacific
12.4 South America
12.4.1 Brazil
12.4.2 Argentina
12.4.3 Chile
12.4.4 Colombia
12.4.5 Rest of South America
12.5 Rest of The World
12.5.1 Middle East
12.5.2 Africa
13. Eye Infections Treatment Market - Entropy
14. Eye Infections Treatment Market – Industry/Segment Competition Landscape
14.1 Market Share Analysis
14.1.1 Global Market Share – Key Companies
14.1.2 Market Share by Region – Key Companies
14.1.3 Market Share by Countries – Key Companies
14.2 Competition Matrix
14.3 Best Practices for Companies
15. Eye Infections Treatment Market – Key Company List by Country Premium
16. Eye Infections Treatment Market - Company Analysis
16.1 Bausch Health Companies Inc.
16.2 Novartis International AG
16.3 Santen Pharmaceutical Co., Ltd.
16.4 Pfizer
16.5 Sun Eye Care Pharmaceuticals Pvt. Ltd.
16.6 Ocular Therapeutix
16.7 Johnson & Johnson Consumer Inc.
16.8 GlaxoSmithKline Pharmaceuticals Ltd
16.9 Alcon Inc.
16.10 AbbVie Inc
* "Financials would be provided to private companies on best-efforts basis."
Connect with our experts to get customized reports that best suit your requirements. Our reports include global-level data, niche markets and competitive landscape
List of Tables:
Table 1: Eye Infections Treatment Market Overview 2021-2026
Table 2: Eye Infections Treatment Market Leader Analysis 2018-2019 (US$)
Table 3: Eye Infections Treatment Market Product Analysis 2018-2019 (US$)
Table 4: Eye Infections Treatment Market End User Analysis 2018-2019 (US$)
Table 5: Eye Infections Treatment Market Patent Analysis 2013-2018* (US$)
Table 6: Eye Infections Treatment Market Financial Analysis 2018-2019 (US$)
Table 7: Eye Infections Treatment Market Driver Analysis 2018-2019 (US$)
Table 8: Eye Infections Treatment Market Challenges Analysis 2018-2019 (US$)
Table 9: Eye Infections Treatment Market Constraint Analysis 2018-2019 (US$)
Table 10: Eye Infections Treatment Market Supplier Bargaining Power Analysis 2018-2019 (US$)
Table 11: Eye Infections Treatment Market Buyer Bargaining Power Analysis 2018-2019 (US$)
Table 12: Eye Infections Treatment Market Threat of Substitutes Analysis 2018-2019 (US$)
Table 13: Eye Infections Treatment Market Threat of New Entrants Analysis 2018-2019 (US$)
Table 14: Eye Infections Treatment Market Degree of Competition Analysis 2018-2019 (US$)
Table 15: Eye Infections Treatment Market Value Chain Analysis 2018-2019 (US$)
Table 16: Eye Infections Treatment Market Pricing Analysis 2021-2026 (US$)
Table 17: Eye Infections Treatment Market Opportunities Analysis 2021-2026 (US$)
Table 18: Eye Infections Treatment Market Product Life Cycle Analysis 2021-2026 (US$)
Table 19: Eye Infections Treatment Market Supplier Analysis 2018-2019 (US$)
Table 20: Eye Infections Treatment Market Distributor Analysis 2018-2019 (US$)
Table 21: Eye Infections Treatment Market Trend Analysis 2018-2019 (US$)
Table 22: Eye Infections Treatment Market Size 2018 (US$)
Table 23: Eye Infections Treatment Market Forecast Analysis 2021-2026 (US$)
Table 24: Eye Infections Treatment Market Sales Forecast Analysis 2021-2026 (Units)
Table 25: Eye Infections Treatment Market, Revenue & Volume, By Category, 2021-2026 ($)
Table 26: Eye Infections Treatment Market By Category, Revenue & Volume, By Conjunctivitis, 2021-2026 ($)
Table 27: Eye Infections Treatment Market By Category, Revenue & Volume, By Blepharitis, 2021-2026 ($)
Table 28: Eye Infections Treatment Market By Category, Revenue & Volume, By Keratitis, 2021-2026 ($)
Table 29: Eye Infections Treatment Market By Category, Revenue & Volume, By Vitritis, 2021-2026 ($)
Table 30: Eye Infections Treatment Market By Category, Revenue & Volume, By Chorioretinitis, 2021-2026 ($)
Table 31: Eye Infections Treatment Market, Revenue & Volume, By Cause of Infection, 2021-2026 ($)
Table 32: Eye Infections Treatment Market By Cause of Infection, Revenue & Volume, By Bacteria, 2021-2026 ($)
Table 33: Eye Infections Treatment Market By Cause of Infection, Revenue & Volume, By Viruses, 2021-2026 ($)
Table 34: Eye Infections Treatment Market By Cause of Infection, Revenue & Volume, By Irritants, 2021-2026 ($)
Table 35: Eye Infections Treatment Market By Cause of Infection, Revenue & Volume, By Allergies, 2021-2026 ($)
Table 36: Eye Infections Treatment Market, Revenue & Volume, By Drug Type, 2021-2026 ($)
Table 37: Eye Infections Treatment Market By Drug Type, Revenue & Volume, By Corticosteroids, 2021-2026 ($)
Table 38: Eye Infections Treatment Market By Drug Type, Revenue & Volume, By Quinolone Antibiotics, 2021-2026 ($)
Table 39: Eye Infections Treatment Market By Drug Type, Revenue & Volume, By Macrolide Antibiotics, 2021-2026 ($)
Table 40: Eye Infections Treatment Market By Drug Type, Revenue & Volume, By Tetracycline Antibiotics, 2021-2026 ($)
Table 41: Eye Infections Treatment Market By Drug Type, Revenue & Volume, By Polyene Antifungals, 2021-2026 ($)
Table 42: North America Eye Infections Treatment Market, Revenue & Volume, By Category, 2021-2026 ($)
Table 43: North America Eye Infections Treatment Market, Revenue & Volume, By Cause of Infection, 2021-2026 ($)
Table 44: North America Eye Infections Treatment Market, Revenue & Volume, By Drug Type, 2021-2026 ($)
Table 45: South america Eye Infections Treatment Market, Revenue & Volume, By Category, 2021-2026 ($)
Table 46: South america Eye Infections Treatment Market, Revenue & Volume, By Cause of Infection, 2021-2026 ($)
Table 47: South america Eye Infections Treatment Market, Revenue & Volume, By Drug Type, 2021-2026 ($)
Table 48: Europe Eye Infections Treatment Market, Revenue & Volume, By Category, 2021-2026 ($)
Table 49: Europe Eye Infections Treatment Market, Revenue & Volume, By Cause of Infection, 2021-2026 ($)
Table 50: Europe Eye Infections Treatment Market, Revenue & Volume, By Drug Type, 2021-2026 ($)
Table 51: APAC Eye Infections Treatment Market, Revenue & Volume, By Category, 2021-2026 ($)
Table 52: APAC Eye Infections Treatment Market, Revenue & Volume, By Cause of Infection, 2021-2026 ($)
Table 53: APAC Eye Infections Treatment Market, Revenue & Volume, By Drug Type, 2021-2026 ($)
Table 54: Middle East & Africa Eye Infections Treatment Market, Revenue & Volume, By Category, 2021-2026 ($)
Table 55: Middle East & Africa Eye Infections Treatment Market, Revenue & Volume, By Cause of Infection, 2021-2026 ($)
Table 56: Middle East & Africa Eye Infections Treatment Market, Revenue & Volume, By Drug Type, 2021-2026 ($)
Table 57: Russia Eye Infections Treatment Market, Revenue & Volume, By Category, 2021-2026 ($)
Table 58: Russia Eye Infections Treatment Market, Revenue & Volume, By Cause of Infection, 2021-2026 ($)
Table 59: Russia Eye Infections Treatment Market, Revenue & Volume, By Drug Type, 2021-2026 ($)
Table 60: Israel Eye Infections Treatment Market, Revenue & Volume, By Category, 2021-2026 ($)
Table 61: Israel Eye Infections Treatment Market, Revenue & Volume, By Cause of Infection, 2021-2026 ($)
Table 62: Israel Eye Infections Treatment Market, Revenue & Volume, By Drug Type, 2021-2026 ($)
Table 63: Top Companies 2018 (US$)Eye Infections Treatment Market, Revenue & Volume
Table 64: Product Launch 2018-2019Eye Infections Treatment Market, Revenue & Volume
Table 65: Mergers & Acquistions 2018-2019Eye Infections Treatment Market, Revenue & Volume
List of Figures:
Figure 1: Overview of Eye Infections Treatment Market 2021-2026
Figure 2: Market Share Analysis for Eye Infections Treatment Market 2018 (US$)
Figure 3: Product Comparison in Eye Infections Treatment Market 2018-2019 (US$)
Figure 4: End User Profile for Eye Infections Treatment Market 2018-2019 (US$)
Figure 5: Patent Application and Grant in Eye Infections Treatment Market 2013-2018* (US$)
Figure 6: Top 5 Companies Financial Analysis in Eye Infections Treatment Market 2018-2019 (US$)
Figure 7: Market Entry Strategy in Eye Infections Treatment Market 2018-2019
Figure 8: Ecosystem Analysis in Eye Infections Treatment Market 2018
Figure 9: Average Selling Price in Eye Infections Treatment Market 2021-2026
Figure 10: Top Opportunites in Eye Infections Treatment Market 2018-2019
Figure 11: Market Life Cycle Analysis in Eye Infections Treatment Market
Figure 12: GlobalBy Category Eye Infections Treatment Market Revenue, 2021-2026 ($)
Figure 13: GlobalBy Cause of Infection Eye Infections Treatment Market Revenue, 2021-2026 ($)
Figure 14: GlobalBy Drug Type Eye Infections Treatment Market Revenue, 2021-2026 ($)
Figure 15: Global Eye Infections Treatment Market - By Geography
Figure 16: Global Eye Infections Treatment Market Value & Volume, By Geography, 2021-2026 ($)
Figure 17: Global Eye Infections Treatment Market CAGR, By Geography, 2021-2026 (%)
Figure 18: North America Eye Infections Treatment Market Value & Volume, 2021-2026 ($)
Figure 19: US Eye Infections Treatment Market Value & Volume, 2021-2026 ($)
Figure 20: US GDP and Population, 2018-2019 ($)
Figure 21: US GDP – Composition of 2018, By Sector of Origin
Figure 22: US Export and Import Value & Volume, 2018-2019 ($)
Figure 23: Canada Eye Infections Treatment Market Value & Volume, 2021-2026 ($)
Figure 24: Canada GDP and Population, 2018-2019 ($)
Figure 25: Canada GDP – Composition of 2018, By Sector of Origin
Figure 26: Canada Export and Import Value & Volume, 2018-2019 ($)
Figure 27: Mexico Eye Infections Treatment Market Value & Volume, 2021-2026 ($)
Figure 28: Mexico GDP and Population, 2018-2019 ($)
Figure 29: Mexico GDP – Composition of 2018, By Sector of Origin
Figure 30: Mexico Export and Import Value & Volume, 2018-2019 ($)
Figure 31: South America Eye Infections Treatment Market Value & Volume, 2021-2026 ($)
Figure 32: Brazil Eye Infections Treatment Market Value & Volume, 2021-2026 ($)
Figure 33: Brazil GDP and Population, 2018-2019 ($)
Figure 34: Brazil GDP – Composition of 2018, By Sector of Origin
Figure 35: Brazil Export and Import Value & Volume, 2018-2019 ($)
Figure 36: Venezuela Eye Infections Treatment Market Value & Volume, 2021-2026 ($)
Figure 37: Venezuela GDP and Population, 2018-2019 ($)
Figure 38: Venezuela GDP – Composition of 2018, By Sector of Origin
Figure 39: Venezuela Export and Import Value & Volume, 2018-2019 ($)
Figure 40: Argentina Eye Infections Treatment Market Value & Volume, 2021-2026 ($)
Figure 41: Argentina GDP and Population, 2018-2019 ($)
Figure 42: Argentina GDP – Composition of 2018, By Sector of Origin
Figure 43: Argentina Export and Import Value & Volume, 2018-2019 ($)
Figure 44: Ecuador Eye Infections Treatment Market Value & Volume, 2021-2026 ($)
Figure 45: Ecuador GDP and Population, 2018-2019 ($)
Figure 46: Ecuador GDP – Composition of 2018, By Sector of Origin
Figure 47: Ecuador Export and Import Value & Volume, 2018-2019 ($)
Figure 48: Peru Eye Infections Treatment Market Value & Volume, 2021-2026 ($)
Figure 49: Peru GDP and Population, 2018-2019 ($)
Figure 50: Peru GDP – Composition of 2018, By Sector of Origin
Figure 51: Peru Export and Import Value & Volume, 2018-2019 ($)
Figure 52: Colombia Eye Infections Treatment Market Value & Volume, 2021-2026 ($)
Figure 53: Colombia GDP and Population, 2018-2019 ($)
Figure 54: Colombia GDP – Composition of 2018, By Sector of Origin
Figure 55: Colombia Export and Import Value & Volume, 2018-2019 ($)
Figure 56: Costa Rica Eye Infections Treatment Market Value & Volume, 2021-2026 ($)
Figure 57: Costa Rica GDP and Population, 2018-2019 ($)
Figure 58: Costa Rica GDP – Composition of 2018, By Sector of Origin
Figure 59: Costa Rica Export and Import Value & Volume, 2018-2019 ($)
Figure 60: Europe Eye Infections Treatment Market Value & Volume, 2021-2026 ($)
Figure 61: U.K Eye Infections Treatment Market Value & Volume, 2021-2026 ($)
Figure 62: U.K GDP and Population, 2018-2019 ($)
Figure 63: U.K GDP – Composition of 2018, By Sector of Origin
Figure 64: U.K Export and Import Value & Volume, 2018-2019 ($)
Figure 65: Germany Eye Infections Treatment Market Value & Volume, 2021-2026 ($)
Figure 66: Germany GDP and Population, 2018-2019 ($)
Figure 67: Germany GDP – Composition of 2018, By Sector of Origin
Figure 68: Germany Export and Import Value & Volume, 2018-2019 ($)
Figure 69: Italy Eye Infections Treatment Market Value & Volume, 2021-2026 ($)
Figure 70: Italy GDP and Population, 2018-2019 ($)
Figure 71: Italy GDP – Composition of 2018, By Sector of Origin
Figure 72: Italy Export and Import Value & Volume, 2018-2019 ($)
Figure 73: France Eye Infections Treatment Market Value & Volume, 2021-2026 ($)
Figure 74: France GDP and Population, 2018-2019 ($)
Figure 75: France GDP – Composition of 2018, By Sector of Origin
Figure 76: France Export and Import Value & Volume, 2018-2019 ($)
Figure 77: Netherlands Eye Infections Treatment Market Value & Volume, 2021-2026 ($)
Figure 78: Netherlands GDP and Population, 2018-2019 ($)
Figure 79: Netherlands GDP – Composition of 2018, By Sector of Origin
Figure 80: Netherlands Export and Import Value & Volume, 2018-2019 ($)
Figure 81: Belgium Eye Infections Treatment Market Value & Volume, 2021-2026 ($)
Figure 82: Belgium GDP and Population, 2018-2019 ($)
Figure 83: Belgium GDP – Composition of 2018, By Sector of Origin
Figure 84: Belgium Export and Import Value & Volume, 2018-2019 ($)
Figure 85: Spain Eye Infections Treatment Market Value & Volume, 2021-2026 ($)
Figure 86: Spain GDP and Population, 2018-2019 ($)
Figure 87: Spain GDP – Composition of 2018, By Sector of Origin
Figure 88: Spain Export and Import Value & Volume, 2018-2019 ($)
Figure 89: Denmark Eye Infections Treatment Market Value & Volume, 2021-2026 ($)
Figure 90: Denmark GDP and Population, 2018-2019 ($)
Figure 91: Denmark GDP – Composition of 2018, By Sector of Origin
Figure 92: Denmark Export and Import Value & Volume, 2018-2019 ($)
Figure 93: APAC Eye Infections Treatment Market Value & Volume, 2021-2026 ($)
Figure 94: China Eye Infections Treatment Market Value & Volume, 2021-2026
Figure 95: China GDP and Population, 2018-2019 ($)
Figure 96: China GDP – Composition of 2018, By Sector of Origin
Figure 97: China Export and Import Value & Volume, 2018-2019 ($)Eye Infections Treatment Market China Export and Import Value & Volume, 2018-2019 ($)
Figure 98: Australia Eye Infections Treatment Market Value & Volume, 2021-2026 ($)
Figure 99: Australia GDP and Population, 2018-2019 ($)
Figure 100: Australia GDP – Composition of 2018, By Sector of Origin
Figure 101: Australia Export and Import Value & Volume, 2018-2019 ($)
Figure 102: South Korea Eye Infections Treatment Market Value & Volume, 2021-2026 ($)
Figure 103: South Korea GDP and Population, 2018-2019 ($)
Figure 104: South Korea GDP – Composition of 2018, By Sector of Origin
Figure 105: South Korea Export and Import Value & Volume, 2018-2019 ($)
Figure 106: India Eye Infections Treatment Market Value & Volume, 2021-2026 ($)
Figure 107: India GDP and Population, 2018-2019 ($)
Figure 108: India GDP – Composition of 2018, By Sector of Origin
Figure 109: India Export and Import Value & Volume, 2018-2019 ($)
Figure 110: Taiwan Eye Infections Treatment Market Value & Volume, 2021-2026 ($)
Figure 111: Taiwan GDP and Population, 2018-2019 ($)
Figure 112: Taiwan GDP – Composition of 2018, By Sector of Origin
Figure 113: Taiwan Export and Import Value & Volume, 2018-2019 ($)
Figure 114: Malaysia Eye Infections Treatment Market Value & Volume, 2021-2026 ($)
Figure 115: Malaysia GDP and Population, 2018-2019 ($)
Figure 116: Malaysia GDP – Composition of 2018, By Sector of Origin
Figure 117: Malaysia Export and Import Value & Volume, 2018-2019 ($)
Figure 118: Hong Kong Eye Infections Treatment Market Value & Volume, 2021-2026 ($)
Figure 119: Hong Kong GDP and Population, 2018-2019 ($)
Figure 120: Hong Kong GDP – Composition of 2018, By Sector of Origin
Figure 121: Hong Kong Export and Import Value & Volume, 2018-2019 ($)
Figure 122: Middle East & Africa Eye Infections Treatment Market Middle East & Africa 3D Printing Market Value & Volume, 2021-2026 ($)
Figure 123: Russia Eye Infections Treatment Market Value & Volume, 2021-2026 ($)
Figure 124: Russia GDP and Population, 2018-2019 ($)
Figure 125: Russia GDP – Composition of 2018, By Sector of Origin
Figure 126: Russia Export and Import Value & Volume, 2018-2019 ($)
Figure 127: Israel Eye Infections Treatment Market Value & Volume, 2021-2026 ($)
Figure 128: Israel GDP and Population, 2018-2019 ($)
Figure 129: Israel GDP – Composition of 2018, By Sector of Origin
Figure 130: Israel Export and Import Value & Volume, 2018-2019 ($)
Figure 131: Entropy Share, By Strategies, 2018-2019* (%)Eye Infections Treatment Market
Figure 132: Developments, 2018-2019*Eye Infections Treatment Market
Figure 133: Company 1 Eye Infections Treatment Market Net Revenue, By Years, 2018-2019* ($)
Figure 134: Company 1 Eye Infections Treatment Market Net Revenue Share, By Business segments, 2018 (%)
Figure 135: Company 1 Eye Infections Treatment Market Net Sales Share, By Geography, 2018 (%)
Figure 136: Company 2 Eye Infections Treatment Market Net Revenue, By Years, 2018-2019* ($)
Figure 137: Company 2 Eye Infections Treatment Market Net Revenue Share, By Business segments, 2018 (%)
Figure 138: Company 2 Eye Infections Treatment Market Net Sales Share, By Geography, 2018 (%)
Figure 139: Company 3 Eye Infections Treatment Market Net Revenue, By Years, 2018-2019* ($)
Figure 140: Company 3 Eye Infections Treatment Market Net Revenue Share, By Business segments, 2018 (%)
Figure 141: Company 3 Eye Infections Treatment Market Net Sales Share, By Geography, 2018 (%)
Figure 142: Company 4 Eye Infections Treatment Market Net Revenue, By Years, 2018-2019* ($)
Figure 143: Company 4 Eye Infections Treatment Market Net Revenue Share, By Business segments, 2018 (%)
Figure 144: Company 4 Eye Infections Treatment Market Net Sales Share, By Geography, 2018 (%)
Figure 145: Company 5 Eye Infections Treatment Market Net Revenue, By Years, 2018-2019* ($)
Figure 146: Company 5 Eye Infections Treatment Market Net Revenue Share, By Business segments, 2018 (%)
Figure 147: Company 5 Eye Infections Treatment Market Net Sales Share, By Geography, 2018 (%)
Figure 148: Company 6 Eye Infections Treatment Market Net Revenue, By Years, 2018-2019* ($)
Figure 149: Company 6 Eye Infections Treatment Market Net Revenue Share, By Business segments, 2018 (%)
Figure 150: Company 6 Eye Infections Treatment Market Net Sales Share, By Geography, 2018 (%)
Figure 151: Company 7 Eye Infections Treatment Market Net Revenue, By Years, 2018-2019* ($)
Figure 152: Company 7 Eye Infections Treatment Market Net Revenue Share, By Business segments, 2018 (%)
Figure 153: Company 7 Eye Infections Treatment Market Net Sales Share, By Geography, 2018 (%)
Figure 154: Company 8 Eye Infections Treatment Market Net Revenue, By Years, 2018-2019* ($)
Figure 155: Company 8 Eye Infections Treatment Market Net Revenue Share, By Business segments, 2018 (%)
Figure 156: Company 8 Eye Infections Treatment Market Net Sales Share, By Geography, 2018 (%)
Figure 157: Company 9 Eye Infections Treatment Market Net Revenue, By Years, 2018-2019* ($)
Figure 158: Company 9 Eye Infections Treatment Market Net Revenue Share, By Business segments, 2018 (%)
Figure 159: Company 9 Eye Infections Treatment Market Net Sales Share, By Geography, 2018 (%)
Figure 160: Company 10 Eye Infections Treatment Market Net Revenue, By Years, 2018-2019* ($)
Figure 161: Company 10 Eye Infections Treatment Market Net Revenue Share, By Business segments, 2018 (%)
Figure 162: Company 10 Eye Infections Treatment Market Net Sales Share, By Geography, 2018 (%)
Figure 163: Company 11 Eye Infections Treatment Market Net Revenue, By Years, 2018-2019* ($)
Figure 164: Company 11 Eye Infections Treatment Market Net Revenue Share, By Business segments, 2018 (%)
Figure 165: Company 11 Eye Infections Treatment Market Net Sales Share, By Geography, 2018 (%)
Figure 166: Company 12 Eye Infections Treatment Market Net Revenue, By Years, 2018-2019* ($)
Figure 167: Company 12 Eye Infections Treatment Market Net Revenue Share, By Business segments, 2018 (%)
Figure 168: Company 12 Eye Infections Treatment Market Net Sales Share, By Geography, 2018 (%)
Figure 169: Company 13 Eye Infections Treatment Market Net Revenue, By Years, 2018-2019* ($)
Figure 170: Company 13 Eye Infections Treatment Market Net Revenue Share, By Business segments, 2018 (%)
Figure 171: Company 13 Eye Infections Treatment Market Net Sales Share, By Geography, 2018 (%)
Figure 172: Company 14 Eye Infections Treatment Market Net Revenue, By Years, 2018-2019* ($)
Figure 173: Company 14 Eye Infections Treatment Market Net Revenue Share, By Business segments, 2018 (%)
Figure 174: Company 14 Eye Infections Treatment Market Net Sales Share, By Geography, 2018 (%)
Figure 175: Company 15 Eye Infections Treatment Market Net Revenue, By Years, 2018-2019* ($)
Figure 176: Company 15 Eye Infections Treatment Market Net Revenue Share, By Business segments, 2018 (%)
Figure 177: Company 15 Eye Infections Treatment Market Net Sales Share, By Geography, 2018 (%)