 Email
Email Print
Print


Histone Deacetylase Inhibitors Market - Forecast(2024 - 2030)
Histone deacetylase inhibitors are a class of compounds that interfere with the function of histone deacetylase. They are the enzymes which remove acetyl groups from an N-acetyl lysine amino acid present on a histone, thus wrapping the DNA tightly by the histones.
Globally, an increase in the number of cancer patients across the globe and the need to improve effectiveness of new therapies are the prime growth drivers of histone deacetylase inhibitors market. Additionally, increased R&D activities being carried out for the treatment of cancers & other diseases and increase in collaborations and investments in the HDAC manufacturing are proving to be the major opportunities for the growth of this market. However, reimbursement and uncertainty issues in regards to HDAC inhibitors are the key restraints for the histone deacetylase inhibitors market.
This report identifies the global Histone Deacetylase Inhibitors Market size in for the year 2014-2016, and forecast of the same for year 2021. It also highlights the potential growth opportunities in the coming years, while also reviewing the market drivers, restraints, growth indicators, challenges, market dynamics, competitive landscape, and other key aspects with respect to Histone Deacetylase Inhibitors Market.
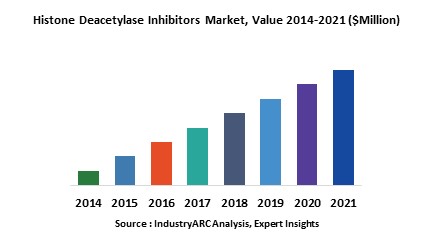
Geographically, Asia-Pacific dominates the Histone Deacetylase Inhibitors Market, and is projected to have the fastest growth. North America, Europe and Rest of the World (RoW) follow Asia-Pacific in terms of market volume. Oncology is expected to be the fastest growing application segment in the global histone deacetylase inhibitors market.
Globally, an increase in the number of cancer patients across the globe and the need to improve effectiveness of new therapies are the prime growth drivers of histone deacetylase inhibitors market. Additionally, increased R&D activities being carried out for the treatment of cancers & other diseases and increase in collaborations and investments in the HDAC manufacturing are proving to be the major opportunities for the growth of this market. However, reimbursement and uncertainty issues in regards to HDAC inhibitors are the key restraints for the histone deacetylase inhibitors market.
This report identifies the global Histone Deacetylase Inhibitors Market size in for the year 2014-2016, and forecast of the same for year 2021. It also highlights the potential growth opportunities in the coming years, while also reviewing the market drivers, restraints, growth indicators, challenges, market dynamics, competitive landscape, and other key aspects with respect to Histone Deacetylase Inhibitors Market.
Geographically, Asia-Pacific dominates the Histone Deacetylase Inhibitors Market, and is projected to have the fastest growth. North America, Europe and Rest of the World (RoW) follow Asia-Pacific in terms of market volume. Oncology is expected to be the fastest growing application segment in the global histone deacetylase inhibitors market.
This report segments Histone Deacetylase Inhibitors market on the By Application, By Class and By Geography as follows:
This report identifies all the major companies operating in the Histone Deacetylase Inhibitors market. Some of the major companies’ profiles in detail are as follows:
- Histone Deacetylase Inhibitors Market, By Class: Class I HDAC, Class II HDAC, Class III HDAC and Others
- Histone Deacetylase Inhibitors Market, By Application: Neurology, Oncology and Others
- This is report has been further segmented into major regions, which includes detailed analysis of each region such as: North America, Europe, Asia-Pacific (APAC), and Rest of the World (RoW) covering all the major country level markets in each of the region. The major countries considered under the Asia-Pacific region are India, China, South Korea and Japan. The major countries considered under the European region are Germany, U.K., France, Italy, Spain and Russia. The major countries considered under the North American region are United States, Canada and Mexico.
This report identifies all the major companies operating in the Histone Deacetylase Inhibitors market. Some of the major companies’ profiles in detail are as follows:
- Celgene Corporation
- Novartis International AG
- AstraZeneca PLC
- Acetylon Pharmaceuticals
- Envivo Pharmaceuticals
1. Histone Deacetylase Inhibitors Market - Overview
1.1. Definitions and Scope
2. Histone Deacetylase Inhibitors Market - Executive summary
2.1. Market Revenue, Market Size and Key Trends by Company
2.2. Key Trends by type of Application
2.3. Key Trends segmented by Geography
3. Histone Deacetylase Inhibitors Market
3.1. Comparative analysis
3.1.1. Product Benchmarking - Top 10 companies
3.1.2. Top 5 Financials Analysis
3.1.3. Market Value split by Top 10 companies
3.1.4. Patent Analysis - Top 10 companies
3.1.5. Pricing Analysis
4. Histone Deacetylase Inhibitors Market – Startup companies Scenario Premium
4.1. Top 10 startup company Analysis by
4.1.1. Investment
4.1.2. Revenue
4.1.3. Market Shares
4.1.4. Market Size and Application Analysis
4.1.5. Venture Capital and Funding Scenario
5. Histone Deacetylase Inhibitors Market – Industry Market Entry Scenario Premium
5.1. Regulatory Framework Overview
5.2. New Business and Ease of Doing business index
5.3. Case studies of successful ventures
5.4. Customer Analysis – Top 10 companies
6. Histone Deacetylase Inhibitors Market Forces
6.1. Drivers
6.2. Constraints
6.3. Challenges
6.4. Porters five force model
6.4.1. Bargaining power of suppliers
6.4.2. Bargaining powers of customers
6.4.3. Threat of new entrants
6.4.4. Rivalry among existing players
6.4.5. Threat of substitutes
7. Histone Deacetylase Inhibitors Market -Strategic analysis
7.1. Value chain analysis
7.2. Opportunities analysis
7.3. Product life cycle
7.4. Suppliers and distributors Market Share
8. Histone Deacetylase Inhibitors Market – By Class (Market Size -$Million / $Billion)
8.1. Market Size and Market Share Analysis
8.2. Application Revenue and Trend Research
8.3. Product Segment Analysis
8.3.1. Class I HDAC
8.3.2. Class II HDAC
8.3.3. Class III HDAC and
8.3.4. Others
9. Histone Deacetylase Inhibitors Market – By Application (Market Size -$Million / $Billion)
9.1. Oncology
9.2. Neurology and
9.3. Others
10. Histone Deacetylase Inhibitors - By Geography (Market Size -$Million / $Billion)
10.1. Histone Deacetylase Inhibitors Market - North America Segment Research
10.2. North America Market Research (Million / $Billion)
10.2.1. Segment type Size and Market Size Analysis
10.2.2. Revenue and Trends
10.2.3. Application Revenue and Trends by type of Application
10.2.4. Company Revenue and Product Analysis
10.2.5. North America Product type and Application Market Size
10.2.5.1. U.S.
10.2.5.2. Canada
10.2.5.3. Mexico
10.2.5.4. Rest of North America
10.3. Histone Deacetylase Inhibitors - South America Segment Research
10.4. South America Market Research (Market Size -$Million / $Billion)
10.4.1. Segment type Size and Market Size Analysis
10.4.2. Revenue and Trends
10.4.3. Application Revenue and Trends by type of Application
10.4.4. Company Revenue and Product Analysis
10.4.5. South America Product type and Application Market Size
10.4.5.1. Brazil
10.4.5.2. Venezuela
10.4.5.3. Argentina
10.4.5.4. Ecuador
10.4.5.5. Peru
10.4.5.6. Colombia
10.4.5.7. Costa Rica
10.4.5.8. Rest of South America
10.5. Histone Deacetylase Inhibitors - Europe Segment Research
10.6. Europe Market Research (Market Size -$Million / $Billion)
10.6.1. Segment type Size and Market Size Analysis
10.6.2. Revenue and Trends
10.6.3. Application Revenue and Trends by type of Application
10.6.4. Company Revenue and Product Analysis
10.6.5. Europe Segment Product type and Application Market Size
10.6.5.1. U.K
10.6.5.2. Germany
10.6.5.3. Italy
10.6.5.4. France
10.6.5.5. Netherlands
10.6.5.6. Belgium
10.6.5.7. Spain
10.6.5.8. Denmark
10.6.5.9. Rest of Europe
10.7. Histone Deacetylase Inhibitors – APAC Segment Research
10.8. APAC Market Research (Market Size -$Million / $Billion)
10.8.1. Segment type Size and Market Size Analysis
10.8.2. Revenue and Trends
10.8.3. Application Revenue and Trends by type of Application
10.8.4. Company Revenue and Product Analysis
10.8.5. APAC Segment – Product type and Application Market Size
10.8.5.1. China
10.8.5.2. Australia
10.8.5.3. Japan
10.8.5.4. South Korea
10.8.5.5. India
10.8.5.6. Taiwan
10.8.5.7. Malaysia
11. Histone Deacetylase Inhibitors Market - Entropy
11.1. New product launches
11.2. M&A's, collaborations, JVs and partnerships
12. Histone Deacetylase Inhibitors Market – Industry / Segment Competition landscape Premium
12.1. Market Share Analysis
12.1.1. Market Share by Country- Top companies
12.1.2. Market Share by Region- Top 10 companies
12.1.3. Market Share by type of Application – Top 10 companies
12.1.4. Market Share by type of Product / Product category- Top 10 companies
12.1.5. Market Share at global level- Top 10 companies
12.1.6. Best Practises for companies
13. Histone Deacetylase Inhibitors Market – Key Company List by Country Premium
14. Histone Deacetylase Inhibitors Market Company Analysis
14.1. Market Share, Company Revenue, Products, M&A, Developments
14.2. Merck & Co., Inc.
14.3. Celgene Corporation
14.4. Novartis International AG
14.5. Celleron Therapeutics
14.6. Envivo Pharmaceuticals
14.7. AstraZeneca PLC
14.8. Acetylon Pharmaceuticals
14.9. Pfizer
14.10. Eisai Pharmaceuticals
14.11. Cellceutix Corporation
14.12. Company 11
14.13. Company 12
14.14. Company 13 and more
"*Financials would be provided on a best efforts basis for private companies"
15. Histone Deacetylase Inhibitors Market -Appendix
15.1. Abbreviations
15.2. Sources
16. Histone Deacetylase Inhibitors Market -Methodology Premium
16.1. Research Methodology
16.1.1. Company Expert Interviews
16.1.2. Industry Databases
16.1.3. Associations
16.1.4. Company News
16.1.5. Company Annual Reports
16.1.6. Application Trends
16.1.7. New Products and Product database
16.1.8. Company Transcripts
16.1.9. R&D Trends
16.1.10. Key Opinion Leaders Interviews
16.1.11. Supply and Demand Trends
List of Tables:
Table1: Histone Deacetylase Inhibitors Market Overview 2023-2030
Table2: Histone Deacetylase Inhibitors Market Leader Analysis 2023-2030 (US$)
Table3: Histone Deacetylase Inhibitors Market Product Analysis 2023-2030 (US$)
Table4: Histone Deacetylase Inhibitors Market End User Analysis 2023-2030 (US$)
Table5: Histone Deacetylase Inhibitors Market Patent Analysis 2013-2023* (US$)
Table6: Histone Deacetylase Inhibitors Market Financial Analysis 2023-2030 (US$)
Table7: Histone Deacetylase Inhibitors Market Driver Analysis 2023-2030 (US$)
Table8: Histone Deacetylase Inhibitors Market Challenges Analysis 2023-2030 (US$)
Table9: Histone Deacetylase Inhibitors Market Constraint Analysis 2023-2030 (US$)
Table10: Histone Deacetylase Inhibitors Market Supplier Bargaining Power Analysis 2023-2030 (US$)
Table11: Histone Deacetylase Inhibitors Market Buyer Bargaining Power Analysis 2023-2030 (US$)
Table12: Histone Deacetylase Inhibitors Market Threat of Substitutes Analysis 2023-2030 (US$)
Table13: Histone Deacetylase Inhibitors Market Threat of New Entrants Analysis 2023-2030 (US$)
Table14: Histone Deacetylase Inhibitors Market Degree of Competition Analysis 2023-2030 (US$)
Table15: Histone Deacetylase Inhibitors Market Value Chain Analysis 2023-2030 (US$)
Table16: Histone Deacetylase Inhibitors Market Pricing Analysis 2023-2030 (US$)
Table17: Histone Deacetylase Inhibitors Market Opportunities Analysis 2023-2030 (US$)
Table18: Histone Deacetylase Inhibitors Market Product Life Cycle Analysis 2023-2030 (US$)
Table19: Histone Deacetylase Inhibitors Market Supplier Analysis 2023-2030 (US$)
Table20: Histone Deacetylase Inhibitors Market Distributor Analysis 2023-2030 (US$)
Table21: Histone Deacetylase Inhibitors Market Trend Analysis 2023-2030 (US$)
Table22: Histone Deacetylase Inhibitors Market Size 2023 (US$)
Table23: Histone Deacetylase Inhibitors Market Forecast Analysis 2023-2030 (US$)
Table24: Histone Deacetylase Inhibitors Market Sales Forecast Analysis 2023-2030 (Units)
Table25: Histone Deacetylase Inhibitors Market, Revenue & Volume, By Application, 2023-2030 ($)
Table26: Histone Deacetylase Inhibitors Market By Application, Revenue & Volume, Oncology, 2023-2030 ($)
Table27: Histone Deacetylase Inhibitors Market By Application, Revenue & Volume, Neurology, 2023-2030 ($)
Table28: Histone Deacetylase Inhibitors Market By Application, Revenue & Volume, By Application 3, 2023-2030 ($)
Table29: Histone Deacetylase Inhibitors Market By Application, Revenue & Volume, By Application 4, 2023-2030 ($)
Table30: Histone Deacetylase Inhibitors Market By Application, Revenue & Volume, By Application 5, 2023-2030 ($)
Table31: North America Histone Deacetylase Inhibitors Market, Revenue & Volume, By Application, 2023-2030 ($)
Table32: South america Histone Deacetylase Inhibitors Market, Revenue & Volume, By Application, 2023-2030 ($)
Table33: Europe Histone Deacetylase Inhibitors Market, Revenue & Volume, By Application, 2023-2030 ($)
Table34: APAC Histone Deacetylase Inhibitors Market, Revenue & Volume, By Application, 2023-2030 ($)
Table35: Middle East & Africa Histone Deacetylase Inhibitors Market, Revenue & Volume, By Application, 2023-2030 ($)
Table36: Russia Histone Deacetylase Inhibitors Market, Revenue & Volume, By Application, 2023-2030 ($)
Table37: Israel Histone Deacetylase Inhibitors Market, Revenue & Volume, By Application, 2023-2030 ($)
Table38: Top Companies 2023 (US$)Histone Deacetylase Inhibitors Market, Revenue & Volume
Table39: Product Launch 2023-2030Histone Deacetylase Inhibitors Market, Revenue & Volume
Table40: Mergers & Acquistions 2023-2030Histone Deacetylase Inhibitors Market, Revenue & Volume
List of Figures:
Figure 1: Overview of Histone Deacetylase Inhibitors Market 2023-2030
Figure 2: Market Share Analysis for Histone Deacetylase Inhibitors Market 2023 (US$)
Figure 3: Product Comparison in Histone Deacetylase Inhibitors Market 2023-2030 (US$)
Figure 4: End User Profile for Histone Deacetylase Inhibitors Market 2023-2030 (US$)
Figure 5: Patent Application and Grant in Histone Deacetylase Inhibitors Market 2013-2023* (US$)
Figure 6: Top 5 Companies Financial Analysis in Histone Deacetylase Inhibitors Market 2023-2030 (US$)
Figure 7: Market Entry Strategy in Histone Deacetylase Inhibitors Market 2023-2030
Figure 8: Ecosystem Analysis in Histone Deacetylase Inhibitors Market 2023
Figure 9: Average Selling Price in Histone Deacetylase Inhibitors Market 2023-2030
Figure 10: Top Opportunites in Histone Deacetylase Inhibitors Market 2023-2030
Figure 11: Market Life Cycle Analysis in Histone Deacetylase Inhibitors Market
Figure 12: GlobalBy ApplicationHistone Deacetylase Inhibitors Market Revenue, 2023-2030 ($)
Figure 13: Global Histone Deacetylase Inhibitors Market - By Geography
Figure 14: Global Histone Deacetylase Inhibitors Market Value & Volume, By Geography, 2023-2030 ($)
Figure 15: Global Histone Deacetylase Inhibitors Market CAGR, By Geography, 2023-2030 (%)
Figure 16: North America Histone Deacetylase Inhibitors Market Value & Volume, 2023-2030 ($)
Figure 17: US Histone Deacetylase Inhibitors Market Value & Volume, 2023-2030 ($)
Figure 18: US GDP and Population, 2023-2030 ($)
Figure 19: US GDP – Composition of 2023, By Sector of Origin
Figure 20: US Export and Import Value & Volume, 2023-2030 ($)
Figure 21: Canada Histone Deacetylase Inhibitors Market Value & Volume, 2023-2030 ($)
Figure 22: Canada GDP and Population, 2023-2030 ($)
Figure 23: Canada GDP – Composition of 2023, By Sector of Origin
Figure 24: Canada Export and Import Value & Volume, 2023-2030 ($)
Figure 25: Mexico Histone Deacetylase Inhibitors Market Value & Volume, 2023-2030 ($)
Figure 26: Mexico GDP and Population, 2023-2030 ($)
Figure 27: Mexico GDP – Composition of 2023, By Sector of Origin
Figure 28: Mexico Export and Import Value & Volume, 2023-2030 ($)
Figure 29: South America Histone Deacetylase Inhibitors Market Value & Volume, 2023-2030 ($)
Figure 30: Brazil Histone Deacetylase Inhibitors Market Value & Volume, 2023-2030 ($)
Figure 31: Brazil GDP and Population, 2023-2030 ($)
Figure 32: Brazil GDP – Composition of 2023, By Sector of Origin
Figure 33: Brazil Export and Import Value & Volume, 2023-2030 ($)
Figure 34: Venezuela Histone Deacetylase Inhibitors Market Value & Volume, 2023-2030 ($)
Figure 35: Venezuela GDP and Population, 2023-2030 ($)
Figure 36: Venezuela GDP – Composition of 2023, By Sector of Origin
Figure 37: Venezuela Export and Import Value & Volume, 2023-2030 ($)
Figure 38: Argentina Histone Deacetylase Inhibitors Market Value & Volume, 2023-2030 ($)
Figure 39: Argentina GDP and Population, 2023-2030 ($)
Figure 40: Argentina GDP – Composition of 2023, By Sector of Origin
Figure 41: Argentina Export and Import Value & Volume, 2023-2030 ($)
Figure 42: Ecuador Histone Deacetylase Inhibitors Market Value & Volume, 2023-2030 ($)
Figure 43: Ecuador GDP and Population, 2023-2030 ($)
Figure 44: Ecuador GDP – Composition of 2023, By Sector of Origin
Figure 45: Ecuador Export and Import Value & Volume, 2023-2030 ($)
Figure 46: Peru Histone Deacetylase Inhibitors Market Value & Volume, 2023-2030 ($)
Figure 47: Peru GDP and Population, 2023-2030 ($)
Figure 48: Peru GDP – Composition of 2023, By Sector of Origin
Figure 49: Peru Export and Import Value & Volume, 2023-2030 ($)
Figure 50: Colombia Histone Deacetylase Inhibitors Market Value & Volume, 2023-2030 ($)
Figure 51: Colombia GDP and Population, 2023-2030 ($)
Figure 52: Colombia GDP – Composition of 2023, By Sector of Origin
Figure 53: Colombia Export and Import Value & Volume, 2023-2030 ($)
Figure 54: Costa Rica Histone Deacetylase Inhibitors Market Value & Volume, 2023-2030 ($)
Figure 55: Costa Rica GDP and Population, 2023-2030 ($)
Figure 56: Costa Rica GDP – Composition of 2023, By Sector of Origin
Figure 57: Costa Rica Export and Import Value & Volume, 2023-2030 ($)
Figure 58: Europe Histone Deacetylase Inhibitors Market Value & Volume, 2023-2030 ($)
Figure 59: U.K Histone Deacetylase Inhibitors Market Value & Volume, 2023-2030 ($)
Figure 60: U.K GDP and Population, 2023-2030 ($)
Figure 61: U.K GDP – Composition of 2023, By Sector of Origin
Figure 62: U.K Export and Import Value & Volume, 2023-2030 ($)
Figure 63: Germany Histone Deacetylase Inhibitors Market Value & Volume, 2023-2030 ($)
Figure 64: Germany GDP and Population, 2023-2030 ($)
Figure 65: Germany GDP – Composition of 2023, By Sector of Origin
Figure 66: Germany Export and Import Value & Volume, 2023-2030 ($)
Figure 67: Italy Histone Deacetylase Inhibitors Market Value & Volume, 2023-2030 ($)
Figure 68: Italy GDP and Population, 2023-2030 ($)
Figure 69: Italy GDP – Composition of 2023, By Sector of Origin
Figure 70: Italy Export and Import Value & Volume, 2023-2030 ($)
Figure 71: France Histone Deacetylase Inhibitors Market Value & Volume, 2023-2030 ($)
Figure 72: France GDP and Population, 2023-2030 ($)
Figure 73: France GDP – Composition of 2023, By Sector of Origin
Figure 74: France Export and Import Value & Volume, 2023-2030 ($)
Figure 75: Netherlands Histone Deacetylase Inhibitors Market Value & Volume, 2023-2030 ($)
Figure 76: Netherlands GDP and Population, 2023-2030 ($)
Figure 77: Netherlands GDP – Composition of 2023, By Sector of Origin
Figure 78: Netherlands Export and Import Value & Volume, 2023-2030 ($)
Figure 79: Belgium Histone Deacetylase Inhibitors Market Value & Volume, 2023-2030 ($)
Figure 80: Belgium GDP and Population, 2023-2030 ($)
Figure 81: Belgium GDP – Composition of 2023, By Sector of Origin
Figure 82: Belgium Export and Import Value & Volume, 2023-2030 ($)
Figure 83: Spain Histone Deacetylase Inhibitors Market Value & Volume, 2023-2030 ($)
Figure 84: Spain GDP and Population, 2023-2030 ($)
Figure 85: Spain GDP – Composition of 2023, By Sector of Origin
Figure 86: Spain Export and Import Value & Volume, 2023-2030 ($)
Figure 87: Denmark Histone Deacetylase Inhibitors Market Value & Volume, 2023-2030 ($)
Figure 88: Denmark GDP and Population, 2023-2030 ($)
Figure 89: Denmark GDP – Composition of 2023, By Sector of Origin
Figure 90: Denmark Export and Import Value & Volume, 2023-2030 ($)
Figure 91: APAC Histone Deacetylase Inhibitors Market Value & Volume, 2023-2030 ($)
Figure 92: China Histone Deacetylase Inhibitors Market Value & Volume, 2023-2030
Figure 93: China GDP and Population, 2023-2030 ($)
Figure 94: China GDP – Composition of 2023, By Sector of Origin
Figure 95: China Export and Import Value & Volume, 2023-2030 ($)Histone Deacetylase Inhibitors Market China Export and Import Value & Volume, 2023-2030 ($)
Figure 96: Australia Histone Deacetylase Inhibitors Market Value & Volume, 2023-2030 ($)
Figure 97: Australia GDP and Population, 2023-2030 ($)
Figure 98: Australia GDP – Composition of 2023, By Sector of Origin
Figure 99: Australia Export and Import Value & Volume, 2023-2030 ($)
Figure 100: South Korea Histone Deacetylase Inhibitors Market Value & Volume, 2023-2030 ($)
Figure 101: South Korea GDP and Population, 2023-2030 ($)
Figure 102: South Korea GDP – Composition of 2023, By Sector of Origin
Figure 103: South Korea Export and Import Value & Volume, 2023-2030 ($)
Figure 104: India Histone Deacetylase Inhibitors Market Value & Volume, 2023-2030 ($)
Figure 105: India GDP and Population, 2023-2030 ($)
Figure 106: India GDP – Composition of 2023, By Sector of Origin
Figure 107: India Export and Import Value & Volume, 2023-2030 ($)
Figure 108: Taiwan Histone Deacetylase Inhibitors Market Value & Volume, 2023-2030 ($)
Figure 109: Taiwan GDP and Population, 2023-2030 ($)
Figure 110: Taiwan GDP – Composition of 2023, By Sector of Origin
Figure 111: Taiwan Export and Import Value & Volume, 2023-2030 ($)
Figure 112: Malaysia Histone Deacetylase Inhibitors Market Value & Volume, 2023-2030 ($)
Figure 113: Malaysia GDP and Population, 2023-2030 ($)
Figure 114: Malaysia GDP – Composition of 2023, By Sector of Origin
Figure 115: Malaysia Export and Import Value & Volume, 2023-2030 ($)
Figure 116: Hong Kong Histone Deacetylase Inhibitors Market Value & Volume, 2023-2030 ($)
Figure 117: Hong Kong GDP and Population, 2023-2030 ($)
Figure 118: Hong Kong GDP – Composition of 2023, By Sector of Origin
Figure 119: Hong Kong Export and Import Value & Volume, 2023-2030 ($)
Figure 120: Middle East & Africa Histone Deacetylase Inhibitors Market Middle East & Africa 3D Printing Market Value & Volume, 2023-2030 ($)
Figure 121: Russia Histone Deacetylase Inhibitors Market Value & Volume, 2023-2030 ($)
Figure 122: Russia GDP and Population, 2023-2030 ($)
Figure 123: Russia GDP – Composition of 2023, By Sector of Origin
Figure 124: Russia Export and Import Value & Volume, 2023-2030 ($)
Figure 125: Israel Histone Deacetylase Inhibitors Market Value & Volume, 2023-2030 ($)
Figure 126: Israel GDP and Population, 2023-2030 ($)
Figure 127: Israel GDP – Composition of 2023, By Sector of Origin
Figure 128: Israel Export and Import Value & Volume, 2023-2030 ($)
Figure 129: Entropy Share, By Strategies, 2023-2030* (%)Histone Deacetylase Inhibitors Market
Figure 130: Developments, 2023-2030*Histone Deacetylase Inhibitors Market
Figure 131: Company 1 Histone Deacetylase Inhibitors Market Net Revenue, By Years, 2023-2030* ($)
Figure 132: Company 1 Histone Deacetylase Inhibitors Market Net Revenue Share, By Business segments, 2023 (%)
Figure 133: Company 1 Histone Deacetylase Inhibitors Market Net Sales Share, By Geography, 2023 (%)
Figure 134: Company 2 Histone Deacetylase Inhibitors Market Net Revenue, By Years, 2023-2030* ($)
Figure 135: Company 2 Histone Deacetylase Inhibitors Market Net Revenue Share, By Business segments, 2023 (%)
Figure 136: Company 2 Histone Deacetylase Inhibitors Market Net Sales Share, By Geography, 2023 (%)
Figure 137: Company 3 Histone Deacetylase Inhibitors Market Net Revenue, By Years, 2023-2030* ($)
Figure 138: Company 3 Histone Deacetylase Inhibitors Market Net Revenue Share, By Business segments, 2023 (%)
Figure 139: Company 3 Histone Deacetylase Inhibitors Market Net Sales Share, By Geography, 2023 (%)
Figure 140: Company 4 Histone Deacetylase Inhibitors Market Net Revenue, By Years, 2023-2030* ($)
Figure 141: Company 4 Histone Deacetylase Inhibitors Market Net Revenue Share, By Business segments, 2023 (%)
Figure 142: Company 4 Histone Deacetylase Inhibitors Market Net Sales Share, By Geography, 2023 (%)
Figure 143: Company 5 Histone Deacetylase Inhibitors Market Net Revenue, By Years, 2023-2030* ($)
Figure 144: Company 5 Histone Deacetylase Inhibitors Market Net Revenue Share, By Business segments, 2023 (%)
Figure 145: Company 5 Histone Deacetylase Inhibitors Market Net Sales Share, By Geography, 2023 (%)
Figure 146: Company 6 Histone Deacetylase Inhibitors Market Net Revenue, By Years, 2023-2030* ($)
Figure 147: Company 6 Histone Deacetylase Inhibitors Market Net Revenue Share, By Business segments, 2023 (%)
Figure 148: Company 6 Histone Deacetylase Inhibitors Market Net Sales Share, By Geography, 2023 (%)
Figure 149: Company 7 Histone Deacetylase Inhibitors Market Net Revenue, By Years, 2023-2030* ($)
Figure 150: Company 7 Histone Deacetylase Inhibitors Market Net Revenue Share, By Business segments, 2023 (%)
Figure 151: Company 7 Histone Deacetylase Inhibitors Market Net Sales Share, By Geography, 2023 (%)
Figure 152: Company 8 Histone Deacetylase Inhibitors Market Net Revenue, By Years, 2023-2030* ($)
Figure 153: Company 8 Histone Deacetylase Inhibitors Market Net Revenue Share, By Business segments, 2023 (%)
Figure 154: Company 8 Histone Deacetylase Inhibitors Market Net Sales Share, By Geography, 2023 (%)
Figure 155: Company 9 Histone Deacetylase Inhibitors Market Net Revenue, By Years, 2023-2030* ($)
Figure 156: Company 9 Histone Deacetylase Inhibitors Market Net Revenue Share, By Business segments, 2023 (%)
Figure 157: Company 9 Histone Deacetylase Inhibitors Market Net Sales Share, By Geography, 2023 (%)
Figure 158: Company 10 Histone Deacetylase Inhibitors Market Net Revenue, By Years, 2023-2030* ($)
Figure 159: Company 10 Histone Deacetylase Inhibitors Market Net Revenue Share, By Business segments, 2023 (%)
Figure 160: Company 10 Histone Deacetylase Inhibitors Market Net Sales Share, By Geography, 2023 (%)
Figure 161: Company 11 Histone Deacetylase Inhibitors Market Net Revenue, By Years, 2023-2030* ($)
Figure 162: Company 11 Histone Deacetylase Inhibitors Market Net Revenue Share, By Business segments, 2023 (%)
Figure 163: Company 11 Histone Deacetylase Inhibitors Market Net Sales Share, By Geography, 2023 (%)
Figure 164: Company 12 Histone Deacetylase Inhibitors Market Net Revenue, By Years, 2023-2030* ($)
Figure 165: Company 12 Histone Deacetylase Inhibitors Market Net Revenue Share, By Business segments, 2023 (%)
Figure 166: Company 12 Histone Deacetylase Inhibitors Market Net Sales Share, By Geography, 2023 (%)
Figure 167: Company 13 Histone Deacetylase Inhibitors Market Net Revenue, By Years, 2023-2030* ($)
Figure 168: Company 13 Histone Deacetylase Inhibitors Market Net Revenue Share, By Business segments, 2023 (%)
Figure 169: Company 13 Histone Deacetylase Inhibitors Market Net Sales Share, By Geography, 2023 (%)
Figure 170: Company 14 Histone Deacetylase Inhibitors Market Net Revenue, By Years, 2023-2030* ($)
Figure 171: Company 14 Histone Deacetylase Inhibitors Market Net Revenue Share, By Business segments, 2023 (%)
Figure 172: Company 14 Histone Deacetylase Inhibitors Market Net Sales Share, By Geography, 2023 (%)
Figure 173: Company 15 Histone Deacetylase Inhibitors Market Net Revenue, By Years, 2023-2030* ($)
Figure 174: Company 15 Histone Deacetylase Inhibitors Market Net Revenue Share, By Business segments, 2023 (%)
Figure 175: Company 15 Histone Deacetylase Inhibitors Market Net Sales Share, By Geography, 2023 (%)