 Email
Email Print
Print


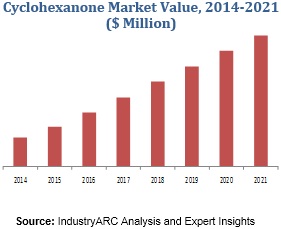
Cyclohexanone is the organic compound, produced by the oxidation of cyclohexane in air, typically using cobalt catalysts. It can also be produced by the partial hydrogenation of phenol. It is colourless oil with an odour indicative of peardrop as well as acetone. Majority of Cyclohexanone is used for production of precursors to Nylon 6,6 and Nylon 6. Almost half of the Cyclohexanone produced around the world is converted to adipic acid and the remaining half is converted to cyclohexanone oxime. Globally, development of advance and more efficient technology, rise in the demand for nylon fibre, and increasing production of caprolactam are the prime growth drivers of global cyclohexanone market. In addition, increase in adoption of nylon fibre for newer applications, and emerging economies such as China, India and others, will create new opportunities for global cyclohexanone market. However, higher cost of investment, and growing competition from other fibres are the key restraints for global cyclohexanone market.
This report identifies the global cyclohexanone market size in for the year 2014-2016, and forecast of the same for year 2021. It also highlights the potential growth opportunities in the coming years, while also reviewing the market drivers, restraints, growth indicators, challenges, market dynamics, competitive landscape, and other key aspects with respect to global cyclohexanone market.
Geographically Europe dominated global cyclohexanone market, and Asia Pacific is projected to have fastest growth, owing to rapidly increasing nylon industry in developing nation such as China, and India in this region. Among all the end-users, nylon industry has the highest market share in global cyclohexanone market.
This report segments global cyclohexanone market on the basis of production base, end-user, and regional market as follows:
- Cyclohexanone Market, By Production Base: Cyclohexane, and Phenol
- The report has focused study on cyclohexanone market by basis of end-user such as: Paints and Dyes, Fertilizers, Nylon Industry, Pharmaceuticals, Films, Soaps, and Others
- This is report has been further segmented into major regions, which includes detailed analysis of each region such as: North America, Europe, Asia-Pacific (APAC), and Rest of the World (RoW) covering all the major country level markets in each of the region
Sample Companies Profiled in this Report are:
- DuPont de Nemours
- Asahi Kasei
- Formosa Plastic Group
- Lipeng Corporation Ltd.
- Rhodia S.A.
- 10+
1. Cyclohexanone Market Overview
1.1. By Production Base
1.2. By End Use
1.3. Market Overview (Drivers, Challenges, And Trends Analysis)
2. Cyclohexanone Market Executive Summary
3. Cyclohexanone Market Landscape
3.1. Market Share Analysis
3.2. Competitor Analysis
3.3. Patent Analysis
3.4. Financial Analysis
4. Cyclohexanone Market Entry Scenario Premium
4.1. Regulatory Framework
4.2. Ease of Doing Business Rank Analysis
5. Cyclohexanone Market Forces
5.1. Drivers - impact analysis
5.2. Constraints & challenges - impact analysis
5.3. Opportunity analysis
6. Cyclohexanone Market – Strategic Analysis
6.1. Value Chain Analysis
6.2. Pricing Analysis
7. Cyclohexanone Market – By Type
7.1. Cyclohexane
7.2. Phenol
8. Cyclohexanone Market – By End Users
8.1. Paints and dyes
8.2. Fertilizers
8.3. Nylon industry
8.4. Pharmaceuticals
8.5. Films
8.6. Soaps
8.7. Others
9. Cyclohexanone Market – By Geography
9.1. North America
9.1.1. US
9.1.2. Canada
9.1.3. Mexico
9.2. South America
9.2.1. Brazil
9.2.2. Argentina
9.2.3. Ecuador
9.2.4. Peru
9.2.5. Colombia
9.2.6. Costa rica
9.2.7. Rest of South America
9.3. Europe
9.3.1. U.K.
9.3.2. Germany
9.3.3. Italy
9.3.4. France
9.3.5. Belgium
9.3.6. Nethrlands
9.3.7. Spain
9.3.8. Russia
9.3.9. Rest of Europe
9.4. Asia-Pacific
9.4.1. China
9.4.2. Australia
9.4.3. Japan
9.4.4. South korea
9.4.5. India
9.4.6. Taiwan
9.4.7. Rest of APAC
9.4.8. Middle east
9.4.9. Africa
10. Cyclohexanone Market – Company Profiles
10.1. DOWDUPONT INC.
10.1.1. Business Overview
10.1.2. Product Portfolio
10.1.3. Financials
10.2. EXXONMOBIL CORPORATION
10.2.1. Business Overview
10.2.2. Product Portfolio
10.2.3. Financials
10.3. CHINA PETROLEUM & CHEMICAL CORPORATION (SINOPEC)
10.3.1. Business Overview
10.3.2. Product Portfolio
10.3.3. Financials
10.4. BASF SE
10.4.1. Business Overview
10.4.2. Product Portfolio
10.4.3. Financials
10.5. QINGDAO HISEA CHEM CO. LTD
10.5.1. Business Overview
10.5.2. Product Portfolio
10.5.3. Financials
10.6. GROUPA AZOTY
10.6.1. Business Overview
10.6.2. Product Portfolio
10.6.3. Financials
10.7. UBE INDUSTRIES,LTD.
10.7.1. Business Overview
10.7.2. Product Portfolio
10.7.3. Financials
10.8. VERSALIS SPA (ENI)
10.8.1. Business Overview
10.8.2. Product Portfolio
10.8.3. Financials
10.9. DOMO CAPROLEUNA GMBH
10.9.1. Business Overview
10.9.2. Product Portfolio
10.9.3. Financials
10.10. FIBRANT B.V.
10.10.1. Business Overview
10.10.2. Product Portfolio
10.10.3. Financials
List of Tables
Table 1 Key Companies By Region/Industry
Table 2 Cyclohexanone Market Competitor Analysis
Table 3 Major Government Regulations
Table 4 North America: Ease of Doing Business Ranking by Countries
Table 5 South America: Ease of Doing Business Ranking by Countries
Table 6 Europe: Ease of Doing Business Ranking by Countries
Table 7 APAC: Ease of Doing Business Ranking by Countries
Table 8 Middle East: Ease of Doing Business Ranking by Countries
Table 9 Africa: Ease of Doing Business Ranking by Countries
Table 10 Global Cyclohexanone Market Revenue, By End-Use, 2023-2024 ($M)
Table 11 Global Soap Exports, By Country 2023 ($M)
List of Figure
Figure1 Global Cyclohexanone Market, Revenue and Volume (2023–2024), ($M, KT)
Figure2 Global Cyclohexanone Market, Revenue Share, By Production Base (2023) (%)
Figure3 Global Cyclohexanone Market, Revenue Share, By End Use (2023) (%)
Figure4 Drivers’ Impact Analysis
Figure5 Challenges’ Impact Analysis
Figure6 Trends’ Impact Analysis
Figure7 Global Cyclohexanone Market Volume (2023–2024), (KT)
Figure8 Global Cyclohexanone Market, Volume Share (KT), By Production Base (2023) (%)
Figure9 Global Cyclohexanone Market, Volume Share (KT), By Production Base (2024) (%)
Figure10 Global Cyclohexanone Market Revenue (2023–2024), ($Mn)
Figure11 Cyclohexanone Market, Revenue ($Mn), By Geography
Figure12 Polyamide Sales in Europe
Figure13 Cyclohexanone Market, Revenue ($Mn), By Production Base
Figure14 Global Plastic Production
Figure15 Cyclohexanone Market, Revenue ($Mn), By End Use
Figure16 Consumer Electronics Revenue Growth in China
Figure17 Market Concentration Analysis
Figure18 Cyclohexanone Market Share Analysis, By Company 2023 (%)
Figure19 Cyclohexanone Published Patents, 2014–2023
Figure20 Cyclohexanone Published Patents Share, By Countries, 2014–2023 (%)
Figure21 BASF
Figure22 DowDupont
Figure23 ExxonMobil Corporation
Figure24 Earnings Per Share (EPS) Cyclohexanone Market, By Company
Figure25 Cyclohexanone Market – Drivers by Impact
Figure26 Textile Export Market Share, By Country (%), 2023
Figure27 Cyclohexanone Market – Challenges by Impact
Figure28 Crude oil Import Prices, 2015–2023, ($/barrel)
Figure29 Global Smart Textile Market Value, 2016–2023 ($bn)
Figure30 Porter’s Five Forces Analysis: Cyclohexanone Market
Figure31 Cyclohexanone Market, Pricing Analysis, By Production Base, 2023–2024
Figure32 Price by Region, 2023
Figure33 Cyclohexanone Market Revenue Share, By Type, 2023 (%)
Figure34 Cyclohexanone Market Volume Share, By Type, 2023 (%)
Figure35 Cyclohexanone Market Growth Rate- By Type, 2023-2024 (%)
Figure36 Cyclohexanone Market Volume by Cyclohexane, 2023-2024 (KT)
Figure37 Cyclohexanone Market Revenue, by Cyclohexane, 2023-2024 ($M)
Figure38 Global Caprolactam Consumption Volume, 2023 (%)
Figure39 Cyclohexanone Market Volume by Phenol, 2023-2024 (KT)
Figure40 Cyclohexanone Market Revenue, by Phenol, 2023-2024 ($M)
Figure41 Phenol Production Capacity, By Region, 2023 (%)
Figure42 Cyclohexanone Market Growth Rate- By End User Industry, 2023-2030 (%)
Figure43 Paints and Dyes: Cyclohexanone Market Volume by End User, 2023-2024 (KT)
Figure44 Global Paints and Coatings Market Volume, 2023-2020 (Million Tons)
Figure45 Paints and Dyes: Cyclohexanone Market Revenue, by Type, 2023-2024 ($M)
Figure46 Fertilizers: Cyclohexanone Market Volume by End User, 2023-2024 (KT)
Figure47 Fertilizers: Cyclohexanone Market Revenue, by End User, 2023-2024 ($M)
Figure48 Regional and Sub Regional Share of World Increase in Fertilizer Consumption, 2014-2023, (%)
Figure49 Global Fertilizer Production, By Region, 2014-2023 (‘000 Tons)
Figure50 Global Fertilizer Production, By Type, 2014-2023 (%)
Figure51 Nylon: Cyclohexanone Market Volume by End User, 2023-2024 (KT)
Figure52 Nylon: Cyclohexanone Market Revenue, by End User, 2023-2024 ($M)
Figure53 Regional Caprolactam Production, 2007 vs 2023 (Metric Tons)
Figure54 Global Nylon Production and Demand, By Region, 2023 (%)
Figure55 Pharmaceuticals: Cyclohexanone Market Volume by End User, 2023-2024 (KT)
Figure56 Pharmaceuticals: Cyclohexanone Market Revenue, by End User, 2023-2024 ($M)
Figure57 Global Pharmaceuticals Sales, By Region, 2023, (%)
Figure58 Films: Cyclohexanone Market Volume by End User, 2023-2024 (KT)
Figure59 Films: Cyclohexanone Market Revenue, by End User, 2023-2024 ($M)
Figure60 Soaps: Cyclohexanone Market Volume by End User, 2023-2024 (KT)
Figure61 Soaps: Cyclohexanone Market Revenue, by End User, 2023-2024 ($M)
Figure62 Others: Cyclohexanone Market Volume by End User, 2023-2024 (KT)
Figure63 Others: Cyclohexanone Market Revenue, by End User, 2023-2024 ($M)
Figure64 Consumption of Cyclohexanone by Geography, 2023 and 2024 (KT)
Figure65 Consumption CAGR (%), 2023-2030
Figure66 North America Cyclohexanone Market Revenue Share (%)
Figure67 North America Cyclohexanone Market Revenue Share , By Type (%)
Figure68 North America Cyclohexanone Market CAGR by Country (%)
Figure69 North America Cyclohexanone Market Revenue Share (%)
Figure70 US: Cyclohexanone Market Volume, 2023-2024 (KT)
Figure71 US: Cyclohexanone Market Revenue, 2023-2024 ($M)
Figure72 Canada: Cyclohexanone Market Volume, 2023-2024 (KT)
Figure73 Canada : Cyclohexanone Market Revenue, 2023-2024 ($M)
Figure74 Canada Non-residential Building Construction Investment, By Building Type, 2016 vs 2023 ($BN)
Figure75 Canada : Largest field crops, 1981 & 2023, (‘000 Acres)
Figure76 Mexico: Cyclohexanone Market Volume, 2023-2024 (KT)
Figure77 Mexico: Cyclohexanone Market Revenue, 2023-2024 ($M)
Figure78 Mexico : 2023 Agricultural Land (Million Hectares)
Figure79 Mexico Construction Output, Aug-2016 – July 2023 (%)
Figure80 South America Cyclohexanone Market Revenue Share and CAGR by Country (%)
Figure81 Crude Oil Production, 2023
Figure82 Cyclohexanone Market Volume, Brazil, 2023-2024 (KT)
Figure83 Cyclohexanone Market Revenue, Brazil, 2023-2024 ($Mn)
Figure84 Crude Oil Production, Brazil, 2013-2023
Figure85 Cyclohexanone Market Volume, Argentina, 2023-2024 (KT)
Figure86 Cyclohexanone Market Revenue, Argentina, 2023-2024 ($Mn)
Figure87 Production of Cars and Commercial Vehicle, 2014-2023
Figure88 Cyclohexanone Market Volume, Ecuador, 2023-2024 (KT)
Figure89 Cyclohexanone Market Revenue, Ecuador, 2023-2024 ($Mn)
Figure90 Crude Oil Production, Ecuador, 2013-2023
Figure91 Cyclohexanone Market Volume, Peru, 2023-2024 (KT)
Figure92 Cyclohexanone Market Revenue, Peru, 2023-2024 ($Mn)
Figure93 Crude Oil Production, Peru, 2013-2023
Figure94 Cyclohexanone Market Volume, Colombia, 2023-2024 (KT)
Figure95 Cyclohexanone Market Revenue, Colombia, 2023-2024 ($Mn)
Figure96 Crude Oil Production, Colombia, 2013-2023
Figure97 Cyclohexanone Market Volume, Costa Rica, 2023-2024 (KT)
Figure98 Cyclohexanone Market Revenue, Costa Rica, 2023-2024 ($Mn)
Figure99 Cyclohexanone Market Volume, Rest of South America, 2023-2024 (KT)
Figure100 Cyclohexanone Market Revenue, Rest of South America, 2023-2024 ($Mn)
Figure101 Sales of Apparel, Value 2012-2016
Figure102 Europe Cyclohexanone Market Revenue Share and CAGR by Country (%)
Figure103 Top Europe Appeal Retail Markets, % value in 2023
Figure104 Cyclohexanone Market Volume by U.K., 2023-2024 (KT)
Figure105 Cyclohexanone Market Revenue, by U.K., 2023-2024 ($Mn)
Figure106 Cyclohexanone Market Volume, Germany, 2023-2024 (KT)
Figure107 Production of Cars and Commercial Vehicle, 2014-2023
Figure108 Cyclohexanone Market Revenue, Germany, 2023-2024 ($Mn)
Figure109 Cyclohexanone Market Volume, Italy, 2023-2024 (KT)
Figure110 Cyclohexanone Market Revenue, Italy, 2023-2024 ($Mn)
Figure111 Production of Cars and Commercial Vehicle, 2014-2023
Figure112 Cyclohexanone Market Volume, France, 2023-2024 (KT)
Figure113 Production of Cars and Commercial Vehicle, 2014-2023
Figure114 Cyclohexanone Market Revenue, France, 2023-2024 ($Mn)
Figure115 Cyclohexanone Market Volume, Belgium, 2023-2024 (KT)
Figure116 Cyclohexanone Maarket Revenue, Belgium, 2023-2024 ($Mn)
Figure117 Cyclohexanone Market Volume, Netherlands, 2023-2024 (KT)
Figure118 Cyclohexanone Market Revenue, Netherlands, 2023-2024 ($Mn)
Figure119 Rail Freight Transport, 2013-2023
Figure120 Cyclohexanone Market Volume, Spain, 2023-2024 (KT)
Figure121 Cyclohexanone Market Revenue, Spain, 2023-2024 ($Mn)
Figure122 Sold Production of Textile Machine Manufacturing component, 2012 - 2016
Figure123 Cyclohexanone Market Volume, Russia, 2023-2024 (KT)
Figure124 Russia’s Oil Production, 2016 - 2023
Figure125 Cyclohexanone Market Revenue, Russia, 2023-2024 ($Mn)
Figure126 Cyclohexanone Market Volume, Rest of Europe, 2023-2024 (KT)
Figure127 Cyclohexanone Market Revenue, Rest of Europe, 2023-2024 ($Mn)
Figure128 Polyamide Consumption in Eastern Europe, By End User 2016
Figure129 Cyclohexanone Market Revenue Share and CAGR, By Country (%)
Figure130 Passenger Car Production in Selected Countries, Asia, 2023 (Units)
Figure131 Cyclohexanone Market Revenue Share and CAGR, By Segment (%)
Figure132 Cyclohexanone Market Revenue, By Production Base, 2023-2024 ($Mn)
Figure133 Cyclohexanone Market Volume, By Production Base, 2023-2024 (KT)
Figure134 Nylon 66 Chip Capacity Distribution, 2023 (%)
Figure135 Cyclohexanone Market Revenue, By Production Base, 2023-2024 ($Mn)
Figure136 Cyclohexanone Market Volume, By Production Base, 2023-2024 (KT)
Figure137 Cyclohexanone Market Revenue, By Production Base, 2023-2024 ($Mn)
Figure138 Cyclohexanone Market Volume, By Production Base, 2023-2024 (KT)
Figure139 Number of Vehicle Production in Japan, 2016-2023 (Thousands)
Figure140 Cyclohexanone Market Revenue, By Production Base, 2023-2024 ($Mn)
Figure141 Cyclohexanone Market Volume, By Production Base, 2023-2024 (KT)
Figure142 South Korea Textile Export, 2015-2023 ($M)
Figure143 Cyclohexanone Market Revenue, By Production Base, 2023-2024 ($Mn)
Figure144 Cyclohexanone Market Volume, By Production Base, 2023-2024 (KT)
Figure145 Indian Nylon Industrial Yarn, By Production (000’MT), 2014-2016
Figure146 Cyclohexanone Market Revenue, By Production Base, 2023-2024 ($Mn)
Figure147 Taiwan Fabric and Yarn Export, 2023 (%)
Figure148 Cyclohexanone Market Volume, By Production Base, 2023-2024 (KT)
Figure149 Cyclohexanone Market Volume, Middle East, 2023-2024 (KT)
Figure150 Cyclohexanone Market Revenue, Middle East, 2023-2024 ($Mn)
Figure151 Crude Oil Production, Saudi Arabia, 2013-2023
Figure152 Cyclohexanone Market Volume, Africa, 2023-2024 (KT)
Figure153 Production of Passenger and Commercial Vehicle, South Africa, 2014-2023
Figure154 Cyclohexanone Market Revenue, Africa, 2023-2024 ($Mn)