 Email
Email Print
Print


Deicing Fluid Market- By Product Type , By Fluid Type , By End-Use Industry, By Geography - Global Opportunity Analysis & Industry Forecast, 2024-2030
Deicing Fluid Market Overview
Deicing Fluid Market size is forecast to reach US$ 2.8 billion by 2030, after growing at a CAGR of 5.2% during 2024-2030. Deicing fluid is the procedure of removing ice, snow from a surface and lower the freezing point of water. Ethylene Glycol and Propylene Glycol are major compounds used for ant freezing substances and is commonly used as an aircraft deicer and as an automotive antifreeze solution. The cold climatic region has a higher demand for deicing fluid. It is widely used in aviation, transportation, and other facility management in cold region across the globe. The rate of increase in accidents and associated problems due to the accumulation of snow on aircraft are driving the market for deicing fluid in the forecasted period. According to Bureau of Labor Statistics On average, there are over 6 million passenger car accidents in the U.S. every year. As of December 2022, there are over 284 million vehicles operating on roads throughout the U.S. In 2023, there will be a projected 243.4 million licensed drivers on U.S. roadways. This is up from 238.6 million in 2022. The fluctuation in climatic changes is also increasing the snowfall in cold countries which is further driving the demand for the deicing fluid market. The growing tourism activities in cold regions is one of the major factors driving the market for deicing fluid.
Ongoing research and development endeavors focus on refining deicing fluid technology for heightened efficacy. These innovations prioritize augmenting fluid performance to prevent ice buildup on surfaces more effectively. The goal is to bolster safety and reliability by ensuring superior protection against ice accumulation. This commitment to advancing deicing solutions aims to deliver enhanced operational efficiency, particularly crucial in challenging weather conditions within various industries.
The aviation sector is witnessing a notable growth in demand for deicing fluids. Airports, aiming for heightened operational efficiency during challenging weather scenarios, have spurred the necessity for efficient deicing solutions. Ensuring safe take-offs and landings is paramount, driving the increased reliance on effective deicing fluids. This surge in demand reflects the industry's commitment to maintaining safety standards in adverse weather conditions, prioritizing secure flight operations.
Deicing Fluid Market COVID-19 Impact
The COVID-19 pandemic is impacted different industries; one of the few industries that were largely hit to some extent was the aviation industry. The global lockdown and social distancing policy has impacted world scheduled passenger traffic. According to ICAO, there was a 50% of seat reduction, 2,699 million passenger’s reduction (60%), and has loss of US$ 371 billion of gross passenger operating revenues of the airline as compared to 2019. Also, due to supply chain disruptions such as raw material delays or non-arrival, disrupted financial flows, and rising absenteeism among production line staff resulting in lower demand and consumption deicing fluids market in 2020.
Deicing Fluid Market Report Coverage
The report: “Deicing Fluid Market – Forecast (2024-2030)”, by IndustryARC, covers an in-depth analysis of the following segments of the Deicing Fluid Market.
By Product Type: Propylene Glycol, Ethylene Glycol, Road Salt (Sodium Chloride, Calcium Chloride, Magnesium Chloride, Potassium Chloride), Brine, Others
By Fluid Type: Type I, Type II, Type III, Type IV
By End-Use Industry: Transportation: Aerospace (Commercial, Military, and Others), Marine, Rail; Facility Management: Roads, Streets, Highway, Others; Industrial: Design & Equipment, Barge, Oil sands, Toiling, Dock, Others
By Geography: North America (USA, Canada, and Mexico), Europe (UK, Germany, France, Italy, Netherlands, Spain, Russia, Belgium, and Rest of Europe), Asia-Pacific (China, Japan, India, South Korea, Australia, and New Zealand, Indonesia, Taiwan, Malaysia, and Rest of APAC), South America (Brazil, Argentina, Colombia, Chile, and Rest of South America), Rest of the World (Middle East, and Africa)
Key Takeaways
- North America dominates the deicing fluid market, owing to the increasing demand for the Aerospace industry in the region. According to Aerospace Industrial Association, in 2022, the Aerospace & Defense industry generated $952 billion in combined sales in 2022, a 6.7 percent increase from the prior year.
- Ethylene Glycol and Propylene Glycol-based Deicing Fluid are increasingly being replaced to mechanical methods of scrapping, heating because of higher specific strength and corrosion Inhibitors.
- There has been an increase in accidents and snow deposition in most of the cold climate region such as delay in flight operations and facing difficulty in taking offs are consecutively driving the market growth.
- The major opportunity for this market is high research spending and growing awareness in society. Furthermore, it is also an opportunity for this market to develop advanced tools for the development of the deicing product.
Deicing Fluid Market Segment Analysis – By Product Type
The propylene glycol segment held the largest share of 37% in the deicing fluid market in 2023. It acts as a base fluid for aircraft deicing composition and a coolant in the food industry. Propylene Glycol is better than ethylene glycol due to its lower toxicity. It is a widely used segment for deicing the product which has been freeze due to cold climatic conditions. Special combinations of low foaming surfactant and dye package, excellent surface wetting and spray characteristics, bio-degradable, triazole free, compatible with any application equipment are driving the propylene glycol segment. Propylene Glycol is used in aerospace, and commercial applications for the deicing runway, equipment, pilot tube, static pressure ports, and others to increase the performance of aircraft engines.
Deicing Fluid Market Segment Analysis – By Fluid Type
The Type I segment accounted for approximately 33% of the market share in 2023 and are estimated to grow at a significant CAGR during the forecast period. They provide weather protection solutions to the aviation, rail, and facility management industries and contain corrosion inhibition package. The fluid clears the way for Runway & Aircraft, Track & platform to work faster and provides long-lasting facility driving the market during the forecast period. According to International Energy Association, Global demand for transport is growing fast. Passenger and freight activity will more than double by 2050. Most conventional rail networks are located in North America, Europe, China, Russia, India, and Japan. These regions make up about 90% of global passenger movements on conventional rail with India leading at 39%, followed by China at 27%, Japan at 11% and the European Union at 9%.
Deicing Fluid Market Segment Analysis – By End-Use Industry
The aerospace segment held the largest share in the deicing fluid market in 2023 and is growing at a CAGR of 12.8% during 2024-2030. Deicing Fluids are used because of their beneficial properties for components that are subjected to low temperature in the aerospace and defense sector. Deicing Fluids are used in aircraft components to provide durability and protect the aircraft against freezing due to its film-forming properties. Commercial airports and military airbases require the premium quality of storm water run-off and high-performance deicing products to manage facilities in airports. In the forecast period, the worldwide aerospace and defense sector is expected to show strong growth. For instance, according to Aerospace Industries Association, the global aerospace and defense industry generated $952 billion in combined sales in 2022, a 6.7 percent increase from the prior year. As a result, the growing focus across cold climatic regions on the aerospace and defense industries is projected to fuel the growth of the global deicing fluid market over the forecast market.
Deicing Fluid Market Segment Analysis – By Geography
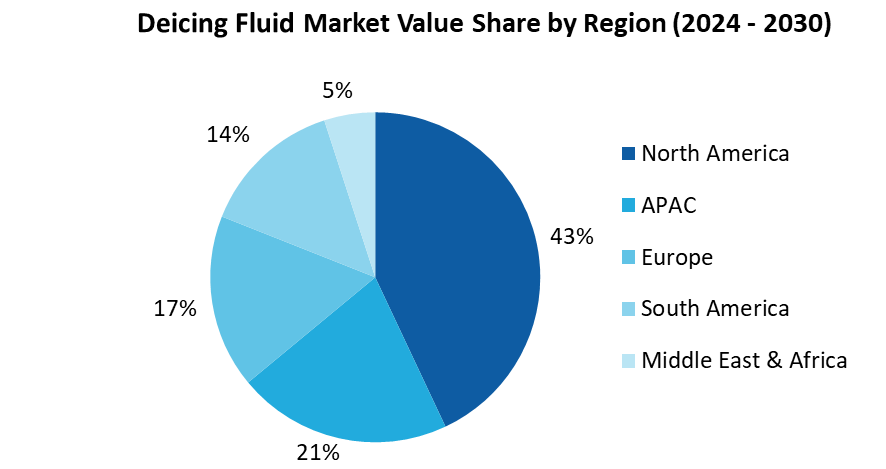
North America region accounted for approximately 43% of the market share in 2023 and is estimated to grow at a significant CAGR during the forecast period. The increasing population and per capita income are boosting the aerospace industry in the region. According to The White House The over 2.3 million passengers on 50,000 flights that move daily through the National Airspace System (NAS) could increase by 50% by 2027. Thus, with the flourishing aerospace industry, there will be an upsurge in the demand for aircraft maintenance, which is anticipated to drive the Deicing Fluid market in the North American region. Moreover, the ecological imbalances lead to winter precipitation and extremely cold climatic conditions are growing demand for deicing products for the removal of snow and ice.
For more details on this report - Request for Sample
Deicing Fluid Market Drivers
Increasing demand in Industrial Sector
Deicing fluid is a material used widely to prevent ice formation by decreasing the freezing point of water and helps in cleansing. The deicing products consist of road salts which are widely used in industries for deicing design & equipment, barge, oil sands, toiling, dock, and others. According to the oil sand community Alliance, Production from the 33 operational oil sands properties reached 3.296 million barrels per day (mmbd) and is anticipated to increase by more than 11% overall. Increased indigenous participation in the oil sand supply chain continues to create economic opportunity and jobs fueling the market during the forecast period.
Flourishing Aviation Sector
Deicing fluids are widely used in the Aviation segment owing to increased demand for Propylene Glycol in aircraft, clearing runway to decrease accident rate. The increased cargo carriage through airways, deicing product awareness, and expansion of the aviation industry are raising demand for deicing fluid in the forecasted period. According to International Air Transportation Association, Asia-Pacific airlines saw their air cargo volumes increase by 2.7% in 2023 compared to the 2022. Therefore, the growing demand for deicing fluids due to problems that comes from bad weather is rising demand during the forecast period.
Deicing Fluid Market Challenges
Growing Environment concern due to Deicing Fluid
Environmental concern has always been a major challenge in the deicing fluid market. The increasing demand for eco-friendly products is restraining the growth deicing fluid market. Ethylene or propylene glycol are highly bio-degradable but the degradation process requires large amounts of oxygen that affect the aquatic organisms. Furthermore, several deicing fluids that cause rusting and surface degradation are taken as major restrain for the growth of the market. The availability of other substitutes as mechanical methods of scrapping, heating has also restrained deicing fluid market growth.
Deicing Fluid Market Landscape
Technology launches, acquisitions, and R&D activities are key strategies adopted by players in the Deicing Fluid market. Deicing Fluid market top companies are:
- Clariant International Ltd.
- The Dow Chemical Company
- Kilfrost
- Proviron Holding NV
- Cryotech Deicing Technology
- LNT Solutions
- Vestergaard Company
- ADDCON GmbH
- Cre Chem Qingdao Limited
- Inland Technologies
Acquisitions/Technology Launches
In October 2023, CAV Systems has Launched New De-Icing Fluid – TKS 406 BIO, which is bio-degradable and non-corrosive, the fluid is designed for use in CAV’s TKS inflight anti-ice and de-ice protection system.
For more Chemicals and Materials Market reports, please click here
1.1 Definitions and Scope
2. Deicing Fluid Market - Executive Summary
2.1 Key Trends by Product Type
2.2 Key Trends by Fluid Type
2.3 Key Trends by End Use Industry
2.4 Key Trends by Geography
3. Deicing Fluid Market – Comparative analysis
3.1 Market Share Analysis- Major Companies
3.2 Product Benchmarking- Major Companies
3.3 Top 5 Financials Analysis
3.4 Patent Analysis- Major Companies
3.5 Pricing Analysis (ASPs will be provided)
4. Deicing Fluid Market - Startup companies Scenario Premium
4.1 Major startup company analysis:
4.1.1 Investment
4.1.2 Revenue
4.1.3 Product portfolio
4.1.4 Venture Capital and Funding Scenario
5. Deicing Fluid Market – Industry Market Entry Scenario Premium
5.1 Regulatory Framework Overview
5.2 New Business and Ease of Doing Business Index
5.3 Successful Venture Profiles
5.4 Customer Analysis – Major companies
6. Deicing Fluid Market - Market Forces
6.1 Market Drivers
6.2 Market Constraints
6.3 Porters Five Force Model
6.3.1 Bargaining Power of Suppliers
6.3.2 Bargaining Powers of Buyers
6.3.3 Threat of New Entrants
6.3.4 Competitive Rivalry
6.3.5 Threat of Substitutes
7. Deicing Fluid Market – Strategic Analysis
7.1 Value/Supply Chain Analysis
7.2 Opportunity Analysis
7.3 Product/Market Life Cycle
7.4 Distributor Analysis – Major Companies
8. Deicing Fluid Market – By Product Type (Market Size -$Million/Billion)
8.1 Propylene Glycol
8.2 Ethylene Glycol
8.3 Road Salt
8.3.1 Sodium Chloride
8.3.2 Calcium Chloride
8.3.3 Magnesium Chloride
8.3.4 Potassium Chloride
8.4 Brine
8.5 Others
9. Deicing Fluid Market – By Fluid Type (Market Size -$Million/Billion)
9.1 Type I
9.2 Type II
9.3 Type III
9.4 Type IV
10. Deicing Fluid Market – By End Use Industry (Market Size -$Million/Billion)
10.1 Transportation
10.1.1 Aerospace
10.1.2 Marine
10.1.3 Railways
10.2 Facility Management
10.2.1 Roads
10.2.2 Streets
10.2.3 Highway
10.2.4 Others
10.3 Industrial
10.3.1 Design & Equipment
10.3.2 Barge
10.3.3 Oil sands
10.3.4 Toiling
10.3.5 Dock
10.4 Others
11. Deicing Fluid Market - By Geography (Market Size -$Million/Billion)
11.1 North America
11.1.1 USA
11.1.2 Canada
11.1.3 Mexico
11.2 South America
11.2.1 Brazil
11.2.2 Argentina
11.2.3 Colombia
11.2.4 Chile
11.2.5 Rest of South America
11.3 Europe
11.3.1 UK
11.3.2 Germany
11.3.3 France
11.3.4 Italy
11.3.5 Netherlands
11.3.6 Spain
11.3.7 Russia
11.3.8 Belgium
11.3.9 Rest of Europe
11.4 Asia-Pacific
11.4.1 China
11.4.2 Japan
11.4.3 India
11.4.4 South Korea
11.4.5 Australia and New Zeeland
11.4.6 Indonesia
11.4.7 Taiwan
11.4.8 Malaysia
11.4.9 Rest of APAC
11.5 Rest of the World
11.5.1 Middle East
11.5.1.1 Saudi Arabia
11.5.1.2 UAE
11.5.1.3 Israel
11.5.1.4 Rest of the Middle East
11.5.2 Africa
11.5.2.1 South Africa
11.5.2.2 Nigeria
11.5.2.3 Rest of Africa
12. Deicing Fluid Market – Entropy
12.1 New Product Launches
12.2 M&As, Collaborations, JVs and Partnerships
13. Deicing Fluid Market – Industry/Segment Competition Landscape
13.1 Company Benchmarking Matrix – Major Companies
13.2 Market Share at Global Level - Major companies
13.3 Market Share by Key Region - Major companies
13.4 Market Share by Key Country - Major companies
13.5 Market Share by Key Application - Major companies
13.6 Market Share by Key Product Type/Product category - Major companies
14. Deicing Fluid Market – Key Company List by Country Premium
15. Deicing Fluid Market Company Analysis - Business Overview, Product Portfolio, Financials, and Developments
15.1 Clariant International Ltd.
15.2 The Dow Chemical Company
15.3 Kilfrost
15.4 Proviron Holding NV
15.5 Cryotech Deicing Technology
15.6 LNT Solutions
15.7 Vestergaard Company
15.8 ADDCON GmbH
15.9 Cre Chem Qingdao Limited
15.10 Inland Technologies
"*Financials would be provided on a best efforts basis for private companies
List of Tables:
Table 1: Deicing Fluid Market Overview 2023-2030
Table 2: Deicing Fluid Market Leader Analysis 2023-2030 (US$)
Table 3: Deicing Fluid Market Product Analysis 2023-2030 (US$)
Table 4: Deicing Fluid Market End User Analysis 2023-2030 (US$)
Table 5: Deicing Fluid Market Patent Analysis 2013-2023* (US$)
Table 6: Deicing Fluid Market Financial Analysis 2023-2030 (US$)
Table 7: Deicing Fluid Market Driver Analysis 2023-2030 (US$)
Table 8: Deicing Fluid Market Challenges Analysis 2023-2030 (US$)
Table 9: Deicing Fluid Market Constraint Analysis 2023-2030 (US$)
Table 10: Deicing Fluid Market Supplier Bargaining Power Analysis 2023-2030 (US$)
Table 11: Deicing Fluid Market Buyer Bargaining Power Analysis 2023-2030 (US$)
Table 12: Deicing Fluid Market Threat of Substitutes Analysis 2023-2030 (US$)
Table 13: Deicing Fluid Market Threat of New Entrants Analysis 2023-2030 (US$)
Table 14: Deicing Fluid Market Degree of Competition Analysis 2023-2030 (US$)
Table 15: Deicing Fluid Market Value Chain Analysis 2023-2030 (US$)
Table 16: Deicing Fluid Market Pricing Analysis 2023-2030 (US$)
Table 17: Deicing Fluid Market Opportunities Analysis 2023-2030 (US$)
Table 18: Deicing Fluid Market Product Life Cycle Analysis 2023-2030 (US$)
Table 19: Deicing Fluid Market Supplier Analysis 2023-2030 (US$)
Table 20: Deicing Fluid Market Distributor Analysis 2023-2030 (US$)
Table 21: Deicing Fluid Market Trend Analysis 2023-2030 (US$)
Table 22: Deicing Fluid Market Size 2023 (US$)
Table 23: Deicing Fluid Market Forecast Analysis 2023-2030 (US$)
Table 24: Deicing Fluid Market Sales Forecast Analysis 2023-2030 (Units)
Table 25: Deicing Fluid Market, Revenue & Volume, By Type, 2023-2030 ($)
Table 26: Deicing Fluid Market By Type, Revenue & Volume, By Type I, 2023-2030 ($)
Table 27: Deicing Fluid Market By Type, Revenue & Volume, By Type II, 2023-2030 ($)
Table 28: Deicing Fluid Market By Type, Revenue & Volume, By Type III, 2023-2030 ($)
Table 29: Deicing Fluid Market By Type, Revenue & Volume, By Type IV, 2023-2030 ($)
Table 30: Deicing Fluid Market, Revenue & Volume, By End Use, 2023-2030 ($)
Table 31: Deicing Fluid Market By End Use, Revenue & Volume, By Automotive, 2023-2030 ($)
Table 32: Deicing Fluid Market By End Use, Revenue & Volume, By Transportation, 2023-2030 ($)
Table 33: Deicing Fluid Market By End Use, Revenue & Volume, By Aviation, 2023-2030 ($)
Table 34: Deicing Fluid Market By End Use, Revenue & Volume, By Industrial, 2023-2030 ($)
Table 35: North America Deicing Fluid Market, Revenue & Volume, By Type, 2023-2030 ($)
Table 36: North America Deicing Fluid Market, Revenue & Volume, By End Use, 2023-2030 ($)
Table 37: South america Deicing Fluid Market, Revenue & Volume, By Type, 2023-2030 ($)
Table 38: South america Deicing Fluid Market, Revenue & Volume, By End Use, 2023-2030 ($)
Table 39: Europe Deicing Fluid Market, Revenue & Volume, By Type, 2023-2030 ($)
Table 40: Europe Deicing Fluid Market, Revenue & Volume, By End Use, 2023-2030 ($)
Table 41: APAC Deicing Fluid Market, Revenue & Volume, By Type, 2023-2030 ($)
Table 42: APAC Deicing Fluid Market, Revenue & Volume, By End Use, 2023-2030 ($)
Table 43: Middle East & Africa Deicing Fluid Market, Revenue & Volume, By Type, 2023-2030 ($)
Table 44: Middle East & Africa Deicing Fluid Market, Revenue & Volume, By End Use, 2023-2030 ($)
Table 45: Russia Deicing Fluid Market, Revenue & Volume, By Type, 2023-2030 ($)
Table 46: Russia Deicing Fluid Market, Revenue & Volume, By End Use, 2023-2030 ($)
Table 47: Israel Deicing Fluid Market, Revenue & Volume, By Type, 2023-2030 ($)
Table 48: Israel Deicing Fluid Market, Revenue & Volume, By End Use, 2023-2030 ($)
Table 49: Top Companies 2023 (US$)Deicing Fluid Market, Revenue & Volume
Table 50: Product Launch 2023-2030Deicing Fluid Market, Revenue & Volume
Table 51: Mergers & Acquistions 2023-2030Deicing Fluid Market, Revenue & Volume
List of Figures:
Figure 1: Overview of Deicing Fluid Market 2023-2030
Figure 2: Market Share Analysis for Deicing Fluid Market 2023 (US$)
Figure 3: Product Comparison in Deicing Fluid Market 2023-2030 (US$)
Figure 4: End User Profile for Deicing Fluid Market 2023-2030 (US$)
Figure 5: Patent Application and Grant in Deicing Fluid Market 2013-2023* (US$)
Figure 6: Top 5 Companies Financial Analysis in Deicing Fluid Market 2023-2030 (US$)
Figure 7: Market Entry Strategy in Deicing Fluid Market 2023-2030
Figure 8: Ecosystem Analysis in Deicing Fluid Market 2023
Figure 9: Average Selling Price in Deicing Fluid Market 2023-2030
Figure 10: Top Opportunites in Deicing Fluid Market 2023-2030
Figure 11: Market Life Cycle Analysis in Deicing Fluid Market
Figure 12: GlobalBy TypeDeicing Fluid Market Revenue, 2023-2030 ($)
Figure 13: GlobalBy End UseDeicing Fluid Market Revenue, 2023-2030 ($)
Figure 14: Global Deicing Fluid Market - By Geography
Figure 15: Global Deicing Fluid Market Value & Volume, By Geography, 2023-2030 ($)
Figure 16: Global Deicing Fluid Market CAGR, By Geography, 2023-2030 (%)
Figure 17: North America Deicing Fluid Market Value & Volume, 2023-2030 ($)
Figure 18: US Deicing Fluid Market Value & Volume, 2023-2030 ($)
Figure 19: US GDP and Population, 2023-2030 ($)
Figure 20: US GDP – Composition of 2023, By Sector of Origin
Figure 21: US Export and Import Value & Volume, 2023-2030 ($)
Figure 22: Canada Deicing Fluid Market Value & Volume, 2023-2030 ($)
Figure 23: Canada GDP and Population, 2023-2030 ($)
Figure 24: Canada GDP – Composition of 2023, By Sector of Origin
Figure 25: Canada Export and Import Value & Volume, 2023-2030 ($)
Figure 26: Mexico Deicing Fluid Market Value & Volume, 2023-2030 ($)
Figure 27: Mexico GDP and Population, 2023-2030 ($)
Figure 28: Mexico GDP – Composition of 2023, By Sector of Origin
Figure 29: Mexico Export and Import Value & Volume, 2023-2030 ($)
Figure 30: South America Deicing Fluid Market Value & Volume, 2023-2030 ($)
Figure 31: Brazil Deicing Fluid Market Value & Volume, 2023-2030 ($)
Figure 32: Brazil GDP and Population, 2023-2030 ($)
Figure 33: Brazil GDP – Composition of 2023, By Sector of Origin
Figure 34: Brazil Export and Import Value & Volume, 2023-2030 ($)
Figure 35: Venezuela Deicing Fluid Market Value & Volume, 2023-2030 ($)
Figure 36: Venezuela GDP and Population, 2023-2030 ($)
Figure 37: Venezuela GDP – Composition of 2023, By Sector of Origin
Figure 38: Venezuela Export and Import Value & Volume, 2023-2030 ($)
Figure 39: Argentina Deicing Fluid Market Value & Volume, 2023-2030 ($)
Figure 40: Argentina GDP and Population, 2023-2030 ($)
Figure 41: Argentina GDP – Composition of 2023, By Sector of Origin
Figure 42: Argentina Export and Import Value & Volume, 2023-2030 ($)
Figure 43: Ecuador Deicing Fluid Market Value & Volume, 2023-2030 ($)
Figure 44: Ecuador GDP and Population, 2023-2030 ($)
Figure 45: Ecuador GDP – Composition of 2023, By Sector of Origin
Figure 46: Ecuador Export and Import Value & Volume, 2023-2030 ($)
Figure 47: Peru Deicing Fluid Market Value & Volume, 2023-2030 ($)
Figure 48: Peru GDP and Population, 2023-2030 ($)
Figure 49: Peru GDP – Composition of 2023, By Sector of Origin
Figure 50: Peru Export and Import Value & Volume, 2023-2030 ($)
Figure 51: Colombia Deicing Fluid Market Value & Volume, 2023-2030 ($)
Figure 52: Colombia GDP and Population, 2023-2030 ($)
Figure 53: Colombia GDP – Composition of 2023, By Sector of Origin
Figure 54: Colombia Export and Import Value & Volume, 2023-2030 ($)
Figure 55: Costa Rica Deicing Fluid Market Value & Volume, 2023-2030 ($)
Figure 56: Costa Rica GDP and Population, 2023-2030 ($)
Figure 57: Costa Rica GDP – Composition of 2023, By Sector of Origin
Figure 58: Costa Rica Export and Import Value & Volume, 2023-2030 ($)
Figure 59: Europe Deicing Fluid Market Value & Volume, 2023-2030 ($)
Figure 60: U.K Deicing Fluid Market Value & Volume, 2023-2030 ($)
Figure 61: U.K GDP and Population, 2023-2030 ($)
Figure 62: U.K GDP – Composition of 2023, By Sector of Origin
Figure 63: U.K Export and Import Value & Volume, 2023-2030 ($)
Figure 64: Germany Deicing Fluid Market Value & Volume, 2023-2030 ($)
Figure 65: Germany GDP and Population, 2023-2030 ($)
Figure 66: Germany GDP – Composition of 2023, By Sector of Origin
Figure 67: Germany Export and Import Value & Volume, 2023-2030 ($)
Figure 68: Italy Deicing Fluid Market Value & Volume, 2023-2030 ($)
Figure 69: Italy GDP and Population, 2023-2030 ($)
Figure 70: Italy GDP – Composition of 2023, By Sector of Origin
Figure 71: Italy Export and Import Value & Volume, 2023-2030 ($)
Figure 72: France Deicing Fluid Market Value & Volume, 2023-2030 ($)
Figure 73: France GDP and Population, 2023-2030 ($)
Figure 74: France GDP – Composition of 2023, By Sector of Origin
Figure 75: France Export and Import Value & Volume, 2023-2030 ($)
Figure 76: Netherlands Deicing Fluid Market Value & Volume, 2023-2030 ($)
Figure 77: Netherlands GDP and Population, 2023-2030 ($)
Figure 78: Netherlands GDP – Composition of 2023, By Sector of Origin
Figure 79: Netherlands Export and Import Value & Volume, 2023-2030 ($)
Figure 80: Belgium Deicing Fluid Market Value & Volume, 2023-2030 ($)
Figure 81: Belgium GDP and Population, 2023-2030 ($)
Figure 82: Belgium GDP – Composition of 2023, By Sector of Origin
Figure 83: Belgium Export and Import Value & Volume, 2023-2030 ($)
Figure 84: Spain Deicing Fluid Market Value & Volume, 2023-2030 ($)
Figure 85: Spain GDP and Population, 2023-2030 ($)
Figure 86: Spain GDP – Composition of 2023, By Sector of Origin
Figure 87: Spain Export and Import Value & Volume, 2023-2030 ($)
Figure 88: Denmark Deicing Fluid Market Value & Volume, 2023-2030 ($)
Figure 89: Denmark GDP and Population, 2023-2030 ($)
Figure 90: Denmark GDP – Composition of 2023, By Sector of Origin
Figure 91: Denmark Export and Import Value & Volume, 2023-2030 ($)
Figure 92: APAC Deicing Fluid Market Value & Volume, 2023-2030 ($)
Figure 93: China Deicing Fluid Market Value & Volume, 2023-2030
Figure 94: China GDP and Population, 2023-2030 ($)
Figure 95: China GDP – Composition of 2023, By Sector of Origin
Figure 96: China Export and Import Value & Volume, 2023-2030 ($)Deicing Fluid Market China Export and Import Value & Volume, 2023-2030 ($)
Figure 97: Australia Deicing Fluid Market Value & Volume, 2023-2030 ($)
Figure 98: Australia GDP and Population, 2023-2030 ($)
Figure 99: Australia GDP – Composition of 2023, By Sector of Origin
Figure 100: Australia Export and Import Value & Volume, 2023-2030 ($)
Figure 101: South Korea Deicing Fluid Market Value & Volume, 2023-2030 ($)
Figure 102: South Korea GDP and Population, 2023-2030 ($)
Figure 103: South Korea GDP – Composition of 2023, By Sector of Origin
Figure 104: South Korea Export and Import Value & Volume, 2023-2030 ($)
Figure 105: India Deicing Fluid Market Value & Volume, 2023-2030 ($)
Figure 106: India GDP and Population, 2023-2030 ($)
Figure 107: India GDP – Composition of 2023, By Sector of Origin
Figure 108: India Export and Import Value & Volume, 2023-2030 ($)
Figure 109: Taiwan Deicing Fluid Market Value & Volume, 2023-2030 ($)
Figure 110: Taiwan GDP and Population, 2023-2030 ($)
Figure 111: Taiwan GDP – Composition of 2023, By Sector of Origin
Figure 112: Taiwan Export and Import Value & Volume, 2023-2030 ($)
Figure 113: Malaysia Deicing Fluid Market Value & Volume, 2023-2030 ($)
Figure 114: Malaysia GDP and Population, 2023-2030 ($)
Figure 115: Malaysia GDP – Composition of 2023, By Sector of Origin
Figure 116: Malaysia Export and Import Value & Volume, 2023-2030 ($)
Figure 117: Hong Kong Deicing Fluid Market Value & Volume, 2023-2030 ($)
Figure 118: Hong Kong GDP and Population, 2023-2030 ($)
Figure 119: Hong Kong GDP – Composition of 2023, By Sector of Origin
Figure 120: Hong Kong Export and Import Value & Volume, 2023-2030 ($)
Figure 121: Middle East & Africa Deicing Fluid Market Middle East & Africa 3D Printing Market Value & Volume, 2023-2030 ($)
Figure 122: Russia Deicing Fluid Market Value & Volume, 2023-2030 ($)
Figure 123: Russia GDP and Population, 2023-2030 ($)
Figure 124: Russia GDP – Composition of 2023, By Sector of Origin
Figure 125: Russia Export and Import Value & Volume, 2023-2030 ($)
Figure 126: Israel Deicing Fluid Market Value & Volume, 2023-2030 ($)
Figure 127: Israel GDP and Population, 2023-2030 ($)
Figure 128: Israel GDP – Composition of 2023, By Sector of Origin
Figure 129: Israel Export and Import Value & Volume, 2023-2030 ($)
Figure 130: Entropy Share, By Strategies, 2023-2030* (%)Deicing Fluid Market
Figure 131: Developments, 2023-2030*Deicing Fluid Market
Figure 132: Company 1 Deicing Fluid Market Net Revenue, By Years, 2023-2030* ($)
Figure 133: Company 1 Deicing Fluid Market Net Revenue Share, By Business segments, 2023 (%)
Figure 134: Company 1 Deicing Fluid Market Net Sales Share, By Geography, 2023 (%)
Figure 135: Company 2 Deicing Fluid Market Net Revenue, By Years, 2023-2030* ($)
Figure 136: Company 2 Deicing Fluid Market Net Revenue Share, By Business segments, 2023 (%)
Figure 137: Company 2 Deicing Fluid Market Net Sales Share, By Geography, 2023 (%)
Figure 138: Company 3 Deicing Fluid Market Net Revenue, By Years, 2023-2030* ($)
Figure 139: Company 3 Deicing Fluid Market Net Revenue Share, By Business segments, 2023 (%)
Figure 140: Company 3 Deicing Fluid Market Net Sales Share, By Geography, 2023 (%)
Figure 141: Company 4 Deicing Fluid Market Net Revenue, By Years, 2023-2030* ($)
Figure 142: Company 4 Deicing Fluid Market Net Revenue Share, By Business segments, 2023 (%)
Figure 143: Company 4 Deicing Fluid Market Net Sales Share, By Geography, 2023 (%)
Figure 144: Company 5 Deicing Fluid Market Net Revenue, By Years, 2023-2030* ($)
Figure 145: Company 5 Deicing Fluid Market Net Revenue Share, By Business segments, 2023 (%)
Figure 146: Company 5 Deicing Fluid Market Net Sales Share, By Geography, 2023 (%)
Figure 147: Company 6 Deicing Fluid Market Net Revenue, By Years, 2023-2030* ($)
Figure 148: Company 6 Deicing Fluid Market Net Revenue Share, By Business segments, 2023 (%)
Figure 149: Company 6 Deicing Fluid Market Net Sales Share, By Geography, 2023 (%)
Figure 150: Company 7 Deicing Fluid Market Net Revenue, By Years, 2023-2030* ($)
Figure 151: Company 7 Deicing Fluid Market Net Revenue Share, By Business segments, 2023 (%)
Figure 152: Company 7 Deicing Fluid Market Net Sales Share, By Geography, 2023 (%)
Figure 153: Company 8 Deicing Fluid Market Net Revenue, By Years, 2023-2030* ($)
Figure 154: Company 8 Deicing Fluid Market Net Revenue Share, By Business segments, 2023 (%)
Figure 155: Company 8 Deicing Fluid Market Net Sales Share, By Geography, 2023 (%)
Figure 156: Company 9 Deicing Fluid Market Net Revenue, By Years, 2023-2030* ($)
Figure 157: Company 9 Deicing Fluid Market Net Revenue Share, By Business segments, 2023 (%)
Figure 158: Company 9 Deicing Fluid Market Net Sales Share, By Geography, 2023 (%)
Figure 159: Company 10 Deicing Fluid Market Net Revenue, By Years, 2023-2030* ($)
Figure 160: Company 10 Deicing Fluid Market Net Revenue Share, By Business segments, 2023 (%)
Figure 161: Company 10 Deicing Fluid Market Net Sales Share, By Geography, 2023 (%)
Figure 162: Company 11 Deicing Fluid Market Net Revenue, By Years, 2023-2030* ($)
Figure 163: Company 11 Deicing Fluid Market Net Revenue Share, By Business segments, 2023 (%)
Figure 164: Company 11 Deicing Fluid Market Net Sales Share, By Geography, 2023 (%)
Figure 165: Company 12 Deicing Fluid Market Net Revenue, By Years, 2023-2030* ($)
Figure 166: Company 12 Deicing Fluid Market Net Revenue Share, By Business segments, 2023 (%)
Figure 167: Company 12 Deicing Fluid Market Net Sales Share, By Geography, 2023 (%)
Figure 168: Company 13 Deicing Fluid Market Net Revenue, By Years, 2023-2030* ($)
Figure 169: Company 13 Deicing Fluid Market Net Revenue Share, By Business segments, 2023 (%)
Figure 170: Company 13 Deicing Fluid Market Net Sales Share, By Geography, 2023 (%)
Figure 171: Company 14 Deicing Fluid Market Net Revenue, By Years, 2023-2030* ($)
Figure 172: Company 14 Deicing Fluid Market Net Revenue Share, By Business segments, 2023 (%)
Figure 173: Company 14 Deicing Fluid Market Net Sales Share, By Geography, 2023 (%)
Figure 174: Company 15 Deicing Fluid Market Net Revenue, By Years, 2023-2030* ($)
Figure 175: Company 15 Deicing Fluid Market Net Revenue Share, By Business segments, 2023 (%)
Figure 176: Company 15 Deicing Fluid Market Net Sales Share, By Geography, 2023 (%)