 Email
Email Print
Print


Deep Brain Stimulator Market - Forecast(2024 - 2030)
Deep Brain Stimulator is a battery-operated medical device called neurostimulator, used in neosurgical procedure which helps to treat a variety of disabling neurological symptoms. Globally, development of technologically advanced product including electric current fractionated implantable pulse generator (IPG), rise in the incidence of Parkinson’s disease, growing R&D pertaining to deep brain stimulators are the prime growth drivers of global deep brain stimulator market. In addition, increase in adoption of deep brain stimulator and emerging economies such as China, India and others, will create new opportunities for global deep brain stimulator market. However, higher cost of research and development, risk of allergic reaction to the DMS parts in case of DMS placement, increased risk of infection are the key restraints for global deep brain stimulator market.
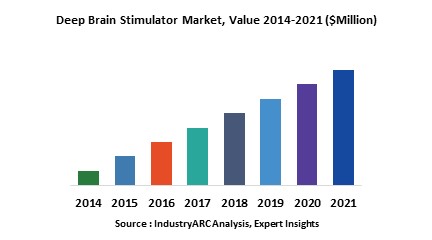
This report identifies the global deep brain stimulator market size in for the year 2014-2016, and forecast of the same for year 2021. It also highlights the potential growth opportunities in the coming years, while also reviewing the market drivers, restraints, growth indicators, challenges, market dynamics, competitive landscape, and other key aspects with respect to global deep brain stimulator market.
Geographically North America dominated global deep brain stimulator market due to reimbursement policies and sophisticated healthcare infrastructure. Asia Pacific is projected to have fastest growth, owing to rapidly increasing aging population, growing disposable income & healthcare expenditure, rise in awareness levels and modernizing healthcare infrastructure in developing nations such as China and India in this region. Among all the end-users, hospitals has the highest market share in global deep brain stimulator market.
This report segments global deep brain stimulator market on the basis of type, application, end-user, and regional market as follows:
Sample Companies Profiled in this Report are:
This report identifies the global deep brain stimulator market size in for the year 2014-2016, and forecast of the same for year 2021. It also highlights the potential growth opportunities in the coming years, while also reviewing the market drivers, restraints, growth indicators, challenges, market dynamics, competitive landscape, and other key aspects with respect to global deep brain stimulator market.
Geographically North America dominated global deep brain stimulator market due to reimbursement policies and sophisticated healthcare infrastructure. Asia Pacific is projected to have fastest growth, owing to rapidly increasing aging population, growing disposable income & healthcare expenditure, rise in awareness levels and modernizing healthcare infrastructure in developing nations such as China and India in this region. Among all the end-users, hospitals has the highest market share in global deep brain stimulator market.
This report segments global deep brain stimulator market on the basis of type, application, end-user, and regional market as follows:
- Deep Brain Stimulator Market, By Type: Single Channel Deep Brain Stimulator, and Dual Channel Deep Brain Stimulator
- Deep Brain Stimulator Market, By Application: Pain Management, Epilepsy, Essential Tremor, Obsessive Compulsive Disorder, Depression, Dystonia, and Parkinsons Disease
- The report has focused study on deep brain stimulator market by basis of end-user such as: Hospitals, Ambulatory Surgical Centers, and Neurological Clinics
- This is report has been further segmented into major regions, which includes detailed analysis of each region such as: North America, Europe, Asia-Pacific (APAC), and Rest of the World (RoW) covering all the major country level markets in each of the region
Sample Companies Profiled in this Report are:
- St. Jude Medical
- Functional Neuromodulation
- Medtronic INC.
- Aleva Neurotherapeutics SA
- 10+
1. Deep Brain Stimulator Market – Market Overview
2. Executive Summary
3. Market Landscape
3.1. Market Share Analysis
3.2. Comparative Analysis
3.3. Product Benchmarking
3.4. End User Profiling
3.5. Top 5 Financials Analysis
4. Deep Brain Stimulator Market– Market Forces
4.1. Drivers
4.1.1. Development of technologically advanced product including electric current fractionated implantable pulse generator (IPG)
4.1.2. Rise in the incidence of Parkinson’s disease
4.1.3. Growing R&D pertaining to deep brain stimulators
4.2. Restraints
4.2.1. Higher cost of research and development
4.2.2. Risk of allergic reaction to the DMS parts in case of DMS placement
4.2.3. Increased risk of infection
4.3. Opportunities
4.3.1. Emerging economies
4.3.2. Increase in adoption of deep brain stimulator
4.4. Challenges
4.5. Porter’s Five Forces Analysis
4.5.1. Bargaining Power of Suppliers
4.5.2. Bargaining Power of Buyers
4.5.3. Threat of New Entrants
4.5.4. Threat of Substitutes
4.5.5. Degree of Competition
5. Deep Brain Stimulator Market, By Type
5.1. Single Channel Deep Brain Stimulator
5.2. Dual Channel Deep Brain Stimulator
6. Deep Brain Stimulator Market, By Application
6.1. Pain Management
6.2. Epilepsy
6.3. Essential Tremor
6.4. Obsessive Compulsive Disorder
6.5. Depression
6.6. Dystonia
6.7. Parkinsons Disease
7. Deep Brain Stimulator Market, By End-User
7.1. Hospitals
7.2. Ambulatory Surgical Centers
7.3. Neurological Clinics
8. Deep Brain Stimulator Market, By Geography
8.1. Europe
8.1.1. Germany
8.1.2. France
8.1.3. Italy
8.1.4. Spain
8.1.5. Russia
8.1.6. U.K.
8.1.7. Rest of Europe
8.2. Asia Pacific
8.2.1. China
8.2.2. India
8.2.3. Japan
8.2.4. South Korea
8.2.5. Rest of Asia-Pacific
8.3. North America
8.3.1. U.S.
8.3.2. Canada
8.3.3. Mexico
8.4. Rest of the World (RoW)
8.4.1. Brazil
8.4.2. Rest of RoW
9. Deep Brain Stimulator – Market Entropy
9.1. Expansion
9.2. Technological Developments
9.3. Merger & Acquisitions, and Joint Ventures
9.4. Supply- Contract
10. Company Profiles (By- Introduction, Financials, Key Insights, Key Strategy, Product Portfolio, SWOT Analysis)
10.1. St. Jude Medical
10.2. Boston scientific
10.3. Functional Neuromodulation
10.4. Medtronic INC.
10.5. Aleva Neurotherapeutics SA
10.6. Cyberonics
10.7. ElectroCore Medical
10.8. EnteroMedics
10.9. Medtronic
10.10. NEUROMetrix
*More than 10 Companies are profiled in this Research Report, Complete List available on Request*
"*Financials would be provided on a best efforts basis for private companies"
11. Appendix
11.1. Abbreviations
11.2. Sources
11.3. Research Methodology
11.4. Expert Insights
List of Tables
Table 1: Deep Brain Stimulator Market Overview 2023-2030
Table 2: Deep Brain Stimulator Market Leader Analysis 2023-2030 (US$)
Table 3: Deep Brain Stimulator MarketProduct Analysis 2023-2030 (US$)
Table 4: Deep Brain Stimulator MarketEnd User Analysis 2023-2030 (US$)
Table 5: Deep Brain Stimulator MarketPatent Analysis 2013-2023* (US$)
Table 6: Deep Brain Stimulator MarketFinancial Analysis 2023-2030 (US$)
Table 7: Deep Brain Stimulator Market Driver Analysis 2023-2030 (US$)
Table 8: Deep Brain Stimulator MarketChallenges Analysis 2023-2030 (US$)
Table 9: Deep Brain Stimulator MarketConstraint Analysis 2023-2030 (US$)
Table 10: Deep Brain Stimulator Market Supplier Bargaining Power Analysis 2023-2030 (US$)
Table 11: Deep Brain Stimulator Market Buyer Bargaining Power Analysis 2023-2030 (US$)
Table 12: Deep Brain Stimulator Market Threat of Substitutes Analysis 2023-2030 (US$)
Table 13: Deep Brain Stimulator Market Threat of New Entrants Analysis 2023-2030 (US$)
Table 14: Deep Brain Stimulator Market Degree of Competition Analysis 2023-2030 (US$)
Table 15: Deep Brain Stimulator MarketValue Chain Analysis 2023-2030 (US$)
Table 16: Deep Brain Stimulator MarketPricing Analysis 2023-2030 (US$)
Table 17: Deep Brain Stimulator MarketOpportunities Analysis 2023-2030 (US$)
Table 18: Deep Brain Stimulator MarketProduct Life Cycle Analysis 2023-2030 (US$)
Table 19: Deep Brain Stimulator MarketSupplier Analysis 2023-2030 (US$)
Table 20: Deep Brain Stimulator MarketDistributor Analysis 2023-2030 (US$)
Table 21: Deep Brain Stimulator Market Trend Analysis 2023-2030 (US$)
Table 22: Deep Brain Stimulator Market Size 2023 (US$)
Table 23: Deep Brain Stimulator Market Forecast Analysis 2023-2030 (US$)
Table 24: Deep Brain Stimulator Market Sales Forecast Analysis 2023-2030 (Units)
Table 25: Deep Brain Stimulator Market, Revenue & Volume,By Type, 2023-2030 ($)
Table 26: Deep Brain Stimulator MarketBy Type, Revenue & Volume,By Single Channel Deep Brain Stimulator, 2023-2030 ($)
Table 27: Deep Brain Stimulator MarketBy Type, Revenue & Volume,By Dual Channel Deep Brain Stimulator, 2023-2030 ($)
Table 28: Deep Brain Stimulator Market, Revenue & Volume,By Application, 2023-2030 ($)
Table 29: Deep Brain Stimulator MarketBy Application, Revenue & Volume,By Pain Management, 2023-2030 ($)
Table 30: Deep Brain Stimulator MarketBy Application, Revenue & Volume,By Epilepsy, 2023-2030 ($)
Table 31: Deep Brain Stimulator MarketBy Application, Revenue & Volume,By Essential Tremor, 2023-2030 ($)
Table 32: Deep Brain Stimulator MarketBy Application, Revenue & Volume,By Obsessive Compulsive Disorder, 2023-2030 ($)
Table 33: Deep Brain Stimulator MarketBy Application, Revenue & Volume,By Depression, 2023-2030 ($)
Table 34: Deep Brain Stimulator Market, Revenue & Volume,By End-User, 2023-2030 ($)
Table 35: Deep Brain Stimulator MarketBy End-User, Revenue & Volume,By Hospitals, 2023-2030 ($)
Table 36: Deep Brain Stimulator MarketBy End-User, Revenue & Volume,By Ambulatory Surgical Centers, 2023-2030 ($)
Table 37: Deep Brain Stimulator MarketBy End-User, Revenue & Volume,By Neurological Clinics, 2023-2030 ($)
Table 38: North America Deep Brain Stimulator Market, Revenue & Volume,By Type, 2023-2030 ($)
Table 39: North America Deep Brain Stimulator Market, Revenue & Volume,By Application, 2023-2030 ($)
Table 40: North America Deep Brain Stimulator Market, Revenue & Volume,By End-User, 2023-2030 ($)
Table 41: South america Deep Brain Stimulator Market, Revenue & Volume,By Type, 2023-2030 ($)
Table 42: South america Deep Brain Stimulator Market, Revenue & Volume,By Application, 2023-2030 ($)
Table 43: South america Deep Brain Stimulator Market, Revenue & Volume,By End-User, 2023-2030 ($)
Table 44: Europe Deep Brain Stimulator Market, Revenue & Volume,By Type, 2023-2030 ($)
Table 45: Europe Deep Brain Stimulator Market, Revenue & Volume,By Application, 2023-2030 ($)
Table 46: Europe Deep Brain Stimulator Market, Revenue & Volume,By End-User, 2023-2030 ($)
Table 47: APAC Deep Brain Stimulator Market, Revenue & Volume,By Type, 2023-2030 ($)
Table 48: APAC Deep Brain Stimulator Market, Revenue & Volume,By Application, 2023-2030 ($)
Table 49: APAC Deep Brain Stimulator Market, Revenue & Volume,By End-User, 2023-2030 ($)
Table 50: Middle East & Africa Deep Brain Stimulator Market, Revenue & Volume,By Type, 2023-2030 ($)
Table 51: Middle East & Africa Deep Brain Stimulator Market, Revenue & Volume,By Application, 2023-2030 ($)
Table 52: Middle East & Africa Deep Brain Stimulator Market, Revenue & Volume,By End-User, 2023-2030 ($)
Table 53: Russia Deep Brain Stimulator Market, Revenue & Volume,By Type, 2023-2030 ($)
Table 54: Russia Deep Brain Stimulator Market, Revenue & Volume,By Application, 2023-2030 ($)
Table 55: Russia Deep Brain Stimulator Market, Revenue & Volume,By End-User, 2023-2030 ($)
Table 56: Israel Deep Brain Stimulator Market, Revenue & Volume,By Type, 2023-2030 ($)
Table 57: Israel Deep Brain Stimulator Market, Revenue & Volume,By Application, 2023-2030 ($)
Table 58: Israel Deep Brain Stimulator Market, Revenue & Volume,By End-User, 2023-2030 ($)
Table 59: Top Companies 2023 (US$)Deep Brain Stimulator Market, Revenue & Volume,,
Table 60: Product Launch 2023-2030Deep Brain Stimulator Market, Revenue & Volume,,
Table 61: Mergers & Acquistions 2023-2030Deep Brain Stimulator Market, Revenue & Volume,,
List of Figures
Figure 1: Overview of Deep Brain Stimulator Market 2023-2030
Figure 2: Market Share Analysis for Deep Brain Stimulator Market 2023 (US$)
Figure 3: Product Comparison in Deep Brain Stimulator Market 2023-2030 (US$)
Figure 4: End User Profile for Deep Brain Stimulator Market 2023-2030 (US$)
Figure 5: Patent Application and Grant in Deep Brain Stimulator Market 2013-2023* (US$)
Figure 6: Top 5 Companies Financial Analysis in Deep Brain Stimulator Market 2023-2030 (US$)
Figure 7: Market Entry Strategy in Deep Brain Stimulator Market 2023-2030
Figure 8: Ecosystem Analysis in Deep Brain Stimulator Market2023
Figure 9: Average Selling Price in Deep Brain Stimulator Market 2023-2030
Figure 10: Top Opportunites in Deep Brain Stimulator Market 2023-2030
Figure 11: Market Life Cycle Analysis in Deep Brain Stimulator Market
Figure 12: GlobalBy TypeDeep Brain Stimulator Market Revenue, 2023-2030 ($)
Figure 13: GlobalBy ApplicationDeep Brain Stimulator Market Revenue, 2023-2030 ($)
Figure 14: GlobalBy End-UserDeep Brain Stimulator Market Revenue, 2023-2030 ($)
Figure 15: Global Deep Brain Stimulator Market - By Geography
Figure 16: Global Deep Brain Stimulator Market Value & Volume, By Geography, 2023-2030 ($)
Figure 17: Global Deep Brain Stimulator Market CAGR, By Geography, 2023-2030 (%)
Figure 18: North America Deep Brain Stimulator Market Value & Volume, 2023-2030 ($)
Figure 19: US Deep Brain Stimulator Market Value & Volume, 2023-2030 ($)
Figure 20: US GDP and Population, 2023-2030 ($)
Figure 21: US GDP – Composition of 2023, By Sector of Origin
Figure 22: US Export and Import Value & Volume, 2023-2030 ($)
Figure 23: Canada Deep Brain Stimulator Market Value & Volume, 2023-2030 ($)
Figure 24: Canada GDP and Population, 2023-2030 ($)
Figure 25: Canada GDP – Composition of 2023, By Sector of Origin
Figure 26: Canada Export and Import Value & Volume, 2023-2030 ($)
Figure 27: Mexico Deep Brain Stimulator Market Value & Volume, 2023-2030 ($)
Figure 28: Mexico GDP and Population, 2023-2030 ($)
Figure 29: Mexico GDP – Composition of 2023, By Sector of Origin
Figure 30: Mexico Export and Import Value & Volume, 2023-2030 ($)
Figure 31: South America Deep Brain Stimulator MarketSouth America 3D Printing Market Value & Volume, 2023-2030 ($)
Figure 32: Brazil Deep Brain Stimulator Market Value & Volume, 2023-2030 ($)
Figure 33: Brazil GDP and Population, 2023-2030 ($)
Figure 34: Brazil GDP – Composition of 2023, By Sector of Origin
Figure 35: Brazil Export and Import Value & Volume, 2023-2030 ($)
Figure 36: Venezuela Deep Brain Stimulator Market Value & Volume, 2023-2030 ($)
Figure 37: Venezuela GDP and Population, 2023-2030 ($)
Figure 38: Venezuela GDP – Composition of 2023, By Sector of Origin
Figure 39: Venezuela Export and Import Value & Volume, 2023-2030 ($)
Figure 40: Argentina Deep Brain Stimulator Market Value & Volume, 2023-2030 ($)
Figure 41: Argentina GDP and Population, 2023-2030 ($)
Figure 42: Argentina GDP – Composition of 2023, By Sector of Origin
Figure 43: Argentina Export and Import Value & Volume, 2023-2030 ($)
Figure 44: Ecuador Deep Brain Stimulator Market Value & Volume, 2023-2030 ($)
Figure 45: Ecuador GDP and Population, 2023-2030 ($)
Figure 46: Ecuador GDP – Composition of 2023, By Sector of Origin
Figure 47: Ecuador Export and Import Value & Volume, 2023-2030 ($)
Figure 48: Peru Deep Brain Stimulator Market Value & Volume, 2023-2030 ($)
Figure 49: Peru GDP and Population, 2023-2030 ($)
Figure 50: Peru GDP – Composition of 2023, By Sector of Origin
Figure 51: Peru Export and Import Value & Volume, 2023-2030 ($)
Figure 52: Colombia Deep Brain Stimulator Market Value & Volume, 2023-2030 ($)
Figure 53: Colombia GDP and Population, 2023-2030 ($)
Figure 54: Colombia GDP – Composition of 2023, By Sector of Origin
Figure 55: Colombia Export and Import Value & Volume, 2023-2030 ($)
Figure 56: Costa Rica Deep Brain Stimulator MarketCosta Rica 3D Printing Market Value & Volume, 2023-2030 ($)
Figure 57: Costa Rica GDP and Population, 2023-2030 ($)
Figure 58: Costa Rica GDP – Composition of 2023, By Sector of Origin
Figure 59: Costa Rica Export and Import Value & Volume, 2023-2030 ($)
Figure 60: Europe Deep Brain Stimulator Market Value & Volume, 2023-2030 ($)
Figure 61: U.K Deep Brain Stimulator Market Value & Volume, 2023-2030 ($)
Figure 62: U.K GDP and Population, 2023-2030 ($)
Figure 63: U.K GDP – Composition of 2023, By Sector of Origin
Figure 64: U.K Export and Import Value & Volume, 2023-2030 ($)
Figure 65: Germany Deep Brain Stimulator Market Value & Volume, 2023-2030 ($)
Figure 66: Germany GDP and Population, 2023-2030 ($)
Figure 67: Germany GDP – Composition of 2023, By Sector of Origin
Figure 68: Germany Export and Import Value & Volume, 2023-2030 ($)
Figure 69: Italy Deep Brain Stimulator Market Value & Volume, 2023-2030 ($)
Figure 70: Italy GDP and Population, 2023-2030 ($)
Figure 71: Italy GDP – Composition of 2023, By Sector of Origin
Figure 72: Italy Export and Import Value & Volume, 2023-2030 ($)
Figure 73: France Deep Brain Stimulator Market Value & Volume, 2023-2030 ($)
Figure 74: France GDP and Population, 2023-2030 ($)
Figure 75: France GDP – Composition of 2023, By Sector of Origin
Figure 76: France Export and Import Value & Volume, 2023-2030 ($)
Figure 77: Netherlands Deep Brain Stimulator Market Value & Volume, 2023-2030 ($)
Figure 78: Netherlands GDP and Population, 2023-2030 ($)
Figure 79: Netherlands GDP – Composition of 2023, By Sector of Origin
Figure 80: Netherlands Export and Import Value & Volume, 2023-2030 ($)
Figure 81: Belgium Deep Brain Stimulator Market Value & Volume, 2023-2030 ($)
Figure 82: Belgium GDP and Population, 2023-2030 ($)
Figure 83: Belgium GDP – Composition of 2023, By Sector of Origin
Figure 84: Belgium Export and Import Value & Volume, 2023-2030 ($)
Figure 85: Spain Deep Brain Stimulator Market Value & Volume, 2023-2030 ($)
Figure 86: Spain GDP and Population, 2023-2030 ($)
Figure 87: Spain GDP – Composition of 2023, By Sector of Origin
Figure 88: Spain Export and Import Value & Volume, 2023-2030 ($)
Figure 89: Denmark Deep Brain Stimulator Market Value & Volume, 2023-2030 ($)
Figure 90: Denmark GDP and Population, 2023-2030 ($)
Figure 91: Denmark GDP – Composition of 2023, By Sector of Origin
Figure 92: Denmark Export and Import Value & Volume, 2023-2030 ($)
Figure 93: APAC Deep Brain Stimulator Market Value & Volume, 2023-2030 ($)
Figure 94: China Deep Brain Stimulator MarketValue & Volume, 2023-2030
Figure 95: China GDP and Population, 2023-2030 ($)
Figure 96: China GDP – Composition of 2023, By Sector of Origin
Figure 97: China Export and Import Value & Volume, 2023-2030 ($)Deep Brain Stimulator MarketChina Export and Import Value & Volume, 2023-2030 ($)
Figure 98: Australia Deep Brain Stimulator Market Value & Volume, 2023-2030 ($)
Figure 99: Australia GDP and Population, 2023-2030 ($)
Figure 100: Australia GDP – Composition of 2023, By Sector of Origin
Figure 101: Australia Export and Import Value & Volume, 2023-2030 ($)
Figure 102: South Korea Deep Brain Stimulator Market Value & Volume, 2023-2030 ($)
Figure 103: South Korea GDP and Population, 2023-2030 ($)
Figure 104: South Korea GDP – Composition of 2023, By Sector of Origin
Figure 105: South Korea Export and Import Value & Volume, 2023-2030 ($)
Figure 106: India Deep Brain Stimulator Market Value & Volume, 2023-2030 ($)
Figure 107: India GDP and Population, 2023-2030 ($)
Figure 108: India GDP – Composition of 2023, By Sector of Origin
Figure 109: India Export and Import Value & Volume, 2023-2030 ($)
Figure 110: Taiwan Deep Brain Stimulator MarketTaiwan 3D Printing Market Value & Volume, 2023-2030 ($)
Figure 111: Taiwan GDP and Population, 2023-2030 ($)
Figure 112: Taiwan GDP – Composition of 2023, By Sector of Origin
Figure 113: Taiwan Export and Import Value & Volume, 2023-2030 ($)
Figure 114: Malaysia Deep Brain Stimulator MarketMalaysia 3D Printing Market Value & Volume, 2023-2030 ($)
Figure 115: Malaysia GDP and Population, 2023-2030 ($)
Figure 116: Malaysia GDP – Composition of 2023, By Sector of Origin
Figure 117: Malaysia Export and Import Value & Volume, 2023-2030 ($)
Figure 118: Hong Kong Deep Brain Stimulator MarketHong Kong 3D Printing Market Value & Volume, 2023-2030 ($)
Figure 119: Hong Kong GDP and Population, 2023-2030 ($)
Figure 120: Hong Kong GDP – Composition of 2023, By Sector of Origin
Figure 121: Hong Kong Export and Import Value & Volume, 2023-2030 ($)
Figure 122: Middle East & Africa Deep Brain Stimulator MarketMiddle East & Africa 3D Printing Market Value & Volume, 2023-2030 ($)
Figure 123: Russia Deep Brain Stimulator MarketRussia 3D Printing Market Value & Volume, 2023-2030 ($)
Figure 124: Russia GDP and Population, 2023-2030 ($)
Figure 125: Russia GDP – Composition of 2023, By Sector of Origin
Figure 126: Russia Export and Import Value & Volume, 2023-2030 ($)
Figure 127: Israel Deep Brain Stimulator Market Value & Volume, 2023-2030 ($)
Figure 128: Israel GDP and Population, 2023-2030 ($)
Figure 129: Israel GDP – Composition of 2023, By Sector of Origin
Figure 130: Israel Export and Import Value & Volume, 2023-2030 ($)
Figure 131: Entropy Share, By Strategies, 2023-2030* (%)Deep Brain Stimulator Market
Figure 132: Developments, 2023-2030*Deep Brain Stimulator Market
Figure 133: Company 1 Deep Brain Stimulator Market Net Revenue, By Years, 2023-2030* ($)
Figure 134: Company 1 Deep Brain Stimulator Market Net Revenue Share, By Business segments, 2023 (%)
Figure 135: Company 1 Deep Brain Stimulator Market Net Sales Share, By Geography, 2023 (%)
Figure 136: Company 2 Deep Brain Stimulator Market Net Revenue, By Years, 2023-2030* ($)
Figure 137: Company 2 Deep Brain Stimulator Market Net Revenue Share, By Business segments, 2023 (%)
Figure 138: Company 2 Deep Brain Stimulator Market Net Sales Share, By Geography, 2023 (%)
Figure 139: Company 3Deep Brain Stimulator Market Net Revenue, By Years, 2023-2030* ($)
Figure 140: Company 3Deep Brain Stimulator Market Net Revenue Share, By Business segments, 2023 (%)
Figure 141: Company 3Deep Brain Stimulator Market Net Sales Share, By Geography, 2023 (%)
Figure 142: Company 4 Deep Brain Stimulator Market Net Revenue, By Years, 2023-2030* ($)
Figure 143: Company 4 Deep Brain Stimulator Market Net Revenue Share, By Business segments, 2023 (%)
Figure 144: Company 4 Deep Brain Stimulator Market Net Sales Share, By Geography, 2023 (%)
Figure 145: Company 5 Deep Brain Stimulator Market Net Revenue, By Years, 2023-2030* ($)
Figure 146: Company 5 Deep Brain Stimulator Market Net Revenue Share, By Business segments, 2023 (%)
Figure 147: Company 5 Deep Brain Stimulator Market Net Sales Share, By Geography, 2023 (%)
Figure 148: Company 6 Deep Brain Stimulator Market Net Revenue, By Years, 2023-2030* ($)
Figure 149: Company 6 Deep Brain Stimulator Market Net Revenue Share, By Business segments, 2023 (%)
Figure 150: Company 6 Deep Brain Stimulator Market Net Sales Share, By Geography, 2023 (%)
Figure 151: Company 7 Deep Brain Stimulator Market Net Revenue, By Years, 2023-2030* ($)
Figure 152: Company 7 Deep Brain Stimulator Market Net Revenue Share, By Business segments, 2023 (%)
Figure 153: Company 7 Deep Brain Stimulator Market Net Sales Share, By Geography, 2023 (%)
Figure 154: Company 8 Deep Brain Stimulator Market Net Revenue, By Years, 2023-2030* ($)
Figure 155: Company 8 Deep Brain Stimulator Market Net Revenue Share, By Business segments, 2023 (%)
Figure 156: Company 8 Deep Brain Stimulator Market Net Sales Share, By Geography, 2023 (%)
Figure 157: Company 9 Deep Brain Stimulator Market Net Revenue, By Years, 2023-2030* ($)
Figure 158: Company 9 Deep Brain Stimulator Market Net Revenue Share, By Business segments, 2023 (%)
Figure 159: Company 9 Deep Brain Stimulator Market Net Sales Share, By Geography, 2023 (%)
Figure 160: Company 10 Deep Brain Stimulator Market Net Revenue, By Years, 2023-2030* ($)
Figure 161: Company 10 Deep Brain Stimulator Market Net Revenue Share, By Business segments, 2023 (%)
Figure 162: Company 10 Deep Brain Stimulator Market Net Sales Share, By Geography, 2023 (%)
Figure 163: Company 11 Deep Brain Stimulator Market Net Revenue, By Years, 2023-2030* ($)
Figure 164: Company 11 Deep Brain Stimulator Market Net Revenue Share, By Business segments, 2023 (%)
Figure 165: Company 11 Deep Brain Stimulator Market Net Sales Share, By Geography, 2023 (%)
Figure 166: Company 12 Deep Brain Stimulator Market Net Revenue, By Years, 2023-2030* ($)
Figure 167: Company 12 Deep Brain Stimulator Market Net Revenue Share, By Business segments, 2023 (%)
Figure 168: Company 12 Deep Brain Stimulator Market Net Sales Share, By Geography, 2023 (%)
Figure 169: Company 13Deep Brain Stimulator Market Net Revenue, By Years, 2023-2030* ($)
Figure 170: Company 13Deep Brain Stimulator Market Net Revenue Share, By Business segments, 2023 (%)
Figure 171: Company 13Deep Brain Stimulator Market Net Sales Share, By Geography, 2023 (%)
Figure 172: Company 14 Deep Brain Stimulator Market Net Revenue, By Years, 2023-2030* ($)
Figure 173: Company 14 Deep Brain Stimulator Market Net Revenue Share, By Business segments, 2023 (%)
Figure 174: Company 14 Deep Brain Stimulator Market Net Sales Share, By Geography, 2023 (%)
Figure 175: Company 15 Deep Brain Stimulator Market Net Revenue, By Years, 2023-2030* ($)
Figure 176: Company 15 Deep Brain Stimulator Market Net Revenue Share, By Business segments, 2023 (%)
Figure 177: Company 15 Deep Brain Stimulator Market Net Sales Share, By Geography, 2023 (%)