 Email
Email Print
Print


Neuropathy is defined as the damaged caused to the nerves, and diabetic neuropathy refers to the nerve damages caused due to diabetes. Diabetes damages body nerves as a result of increased levels of blood glucose. Diabetic neuropathy is the most commonly found complication of diabetes.
The report “Global Diabetic neuropathy Market” for the projected period 2016 to 2021 has been segmented on three different parameters. The global diabetic neuropathy market has been primarily studied on the basis of different categories of Diabetic neuropathy such as Peripheral, Autonomic neuropathy and so on. The Diabetic neuropathy market has also been studied on the basis of different treatment methods such as Antidepressants for e.g. Duloxetine (Cymbalta), Nortriptyline, Electrical Nerve Stimulation and many more. The market has also been studied on the premise of different geographies and the penetration of Diabetic neuropathy disease in those geographies.
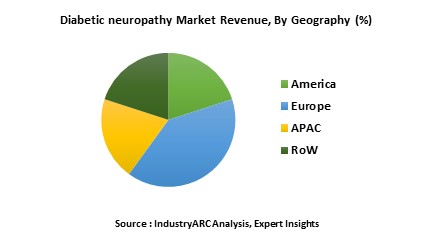
North America is currently the dominating the global diabetic neuropathy market, followed by Europe. This can be attributed to the increasing number of patients with diabetes, surge in research and development activities on cure of diabetes or its related complications, and developing healthcare infrastructure in the region. The diabetic neuropathy market in Asia is expected to attain significant growth rate in the coming years. In addition, increasing number of diabetic patients in developing countries such as India, China, and Japan are expected to lead growth in the Asian diabetic neuropathy market. Increasing prevalence of diabetes cases, aging population are some of the key factors driving the global diabetic neuropathy market. However, the global diabetic neuropathy market is being restrained by factors such as the high failure rate of the clinical trials, stringent government regulations.
Sample Companies Profiled in this Report are:
The Diabetic neuropathy market report also comprises of the leading companies profiled in an extremely descriptive manner. The company profiles include financial summaries, strategies, recent developments and product portfolios of the leading companies in the Diabetic neuropathy market. The report also incorporates a profound study of the market entropy, market forces and strategic analysis of the Diabetic neuropathy market.
The report “Global Diabetic neuropathy Market” for the projected period 2016 to 2021 has been segmented on three different parameters. The global diabetic neuropathy market has been primarily studied on the basis of different categories of Diabetic neuropathy such as Peripheral, Autonomic neuropathy and so on. The Diabetic neuropathy market has also been studied on the basis of different treatment methods such as Antidepressants for e.g. Duloxetine (Cymbalta), Nortriptyline, Electrical Nerve Stimulation and many more. The market has also been studied on the premise of different geographies and the penetration of Diabetic neuropathy disease in those geographies.
North America is currently the dominating the global diabetic neuropathy market, followed by Europe. This can be attributed to the increasing number of patients with diabetes, surge in research and development activities on cure of diabetes or its related complications, and developing healthcare infrastructure in the region. The diabetic neuropathy market in Asia is expected to attain significant growth rate in the coming years. In addition, increasing number of diabetic patients in developing countries such as India, China, and Japan are expected to lead growth in the Asian diabetic neuropathy market. Increasing prevalence of diabetes cases, aging population are some of the key factors driving the global diabetic neuropathy market. However, the global diabetic neuropathy market is being restrained by factors such as the high failure rate of the clinical trials, stringent government regulations.
Sample Companies Profiled in this Report are:
- Neuromeric, Inc.
- Allergan PLC
- Mitsubishi Tanabe Pharma Corporation.
- Pfizer, Inc.
- Novartis AG
- 10+
The Diabetic neuropathy market report also comprises of the leading companies profiled in an extremely descriptive manner. The company profiles include financial summaries, strategies, recent developments and product portfolios of the leading companies in the Diabetic neuropathy market. The report also incorporates a profound study of the market entropy, market forces and strategic analysis of the Diabetic neuropathy market.
1. Diabetic neuropathy Market - Overview
1.1. Definitions and Scope
2. Diabetic neuropathy Market - Executive summary
2.1. Market Revenue, Market Size and Key Trends by Company
2.2. Key Trends by type of Application
2.3. Key Trends segmented by Geography
3. Diabetic neuropathy Market
3.1. Comparative analysis
3.1.1. Product Benchmarking - Top 10 companies
3.1.2. Top 5 Financials Analysis
3.1.3. Market Value split by Top 10 companies
3.1.4. Patent Analysis - Top 10 companies
3.1.5. Pricing Analysis
4. Diabetic neuropathy Market – Startup companies Scenario Premium
4.1. Top 10 startup company Analysis by
4.1.1. Investment
4.1.2. Revenue
4.1.3. Market Shares
4.1.4. Market Size and Application Analysis
4.1.5. Venture Capital and Funding Scenario
5. Diabetic neuropathy Market – Industry Market Entry Scenario Premium
5.1. Regulatory Framework Overview
5.2. New Business and Ease of Doing business index
5.3. Case studies of successful ventures
5.4. Customer Analysis – Top 10 companies
6. Diabetic neuropathy Market Forces
6.1. Drivers
6.2. Constraints
6.3. Challenges
6.4. Porters five force model
6.4.1. Bargaining power of suppliers
6.4.2. Bargaining powers of customers
6.4.3. Threat of new entrants
6.4.4. Rivalry among existing players
6.4.5. Threat of substitutes
7. Diabetic neuropathy Market -Strategic analysis
7.1. Value chain analysis
7.2. Opportunities analysis
7.3. Product life cycle
7.4. Suppliers and distributors Market Share
8. Diabetic neuropathy Market – By Type (Market Size -$Million / $Billion)
8.1. Market Size and Market Share Analysis
8.2. Application Revenue and Trend Research
8.3. Product Segment Analysis
8.3.1. Peripheral Neuropathy
8.3.2. Autonomic Neuropathy
8.3.3. Proximal Neuropathy
8.3.4. Focal Neuropathy
9. Diabetic neuropathy Market – By Treatment Methods (Market Size -$Million / $Billion)
9.1. Antidepressants
9.1.1. Duloxetine (Cymbalta)
9.1.2. Nortriptyline (Pamelor, Aventyl)
9.1.3. Desipramine (Norpramin)
9.2. Anti-seizure medications
9.3. Anticonvulsants
9.4. Electrical Nerve Stimulation
9.5. Topical Medications
9.6. Others
10. Diabetic neuropathy - By Geography (Market Size -$Million / $Billion)
10.1. Diabetic neuropathy Market - North America Segment Research
10.2. North America Market Research (Million / $Billion)
10.2.1. Segment type Size and Market Size Analysis
10.2.2. Revenue and Trends
10.2.3. Application Revenue and Trends by type of Application
10.2.4. Company Revenue and Product Analysis
10.2.5. North America Product type and Application Market Size
10.2.5.1. U.S.
10.2.5.2. Canada
10.2.5.3. Mexico
10.2.5.4. Rest of North America
10.3. Diabetic neuropathy - South America Segment Research
10.4. South America Market Research (Market Size -$Million / $Billion)
10.4.1. Segment type Size and Market Size Analysis
10.4.2. Revenue and Trends
10.4.3. Application Revenue and Trends by type of Application
10.4.4. Company Revenue and Product Analysis
10.4.5. South America Product type and Application Market Size
10.4.5.1. Brazil
10.4.5.2. Venezuela
10.4.5.3. Argentina
10.4.5.4. Ecuador
10.4.5.5. Peru
10.4.5.6. Colombia
10.4.5.7. Costa Rica
10.4.5.8. Rest of South America
10.5. Diabetic neuropathy - Europe Segment Research
10.6. Europe Market Research (Market Size -$Million / $Billion)
10.6.1. Segment type Size and Market Size Analysis
10.6.2. Revenue and Trends
10.6.3. Application Revenue and Trends by type of Application
10.6.4. Company Revenue and Product Analysis
10.6.5. Europe Segment Product type and Application Market Size
10.6.5.1. U.K
10.6.5.2. Germany
10.6.5.3. Italy
10.6.5.4. France
10.6.5.5. Netherlands
10.6.5.6. Belgium
10.6.5.7. Spain
10.6.5.8. Denmark
10.6.5.9. Rest of Europe
10.7. Diabetic neuropathy – APAC Segment Research
10.8. APAC Market Research (Market Size -$Million / $Billion)
10.8.1. Segment type Size and Market Size Analysis
10.8.2. Revenue and Trends
10.8.3. Application Revenue and Trends by type of Application
10.8.4. Company Revenue and Product Analysis
10.8.5. APAC Segment – Product type and Application Market Size
10.8.5.1. China
10.8.5.2. Australia
10.8.5.3. Japan
10.8.5.4. South Korea
10.8.5.5. India
10.8.5.6. Taiwan
10.8.5.7. Malaysia
11. Diabetic neuropathy Market - Entropy
11.1. New product launches
11.2. M&A's, collaborations, JVs and partnerships
12. Diabetic neuropathy Market – Industry / Segment Competition landscape Premium
12.1. Market Share Analysis
12.1.1. Market Share by Country- Top companies
12.1.2. Market Share by Region- Top 10 companies
12.1.3. Market Share by type of Application – Top 10 companies
12.1.4. Market Share by type of Product / Product category- Top 10 companies
12.1.5. Market Share at global level- Top 10 companies
12.1.6. Best Practises for companies
13. Diabetic neuropathy Market – Key Company List by Country Premium
14. Diabetic neuropathy Market Company Analysis
14.1. Market Share, Company Revenue, Products, M&A, Developments
14.2. NeuroMetrix, Inc
14.3. Allergan PLC
14.4. Mitsubishi Tanabe Pharma Corporation
14.5. Pfizer, Inc
14.6. Novartis AG
14.7. AbbVie, Inc
14.8. Eli Lilly
14.9. Merck & Co., Inc
14.10. Sanofi
14.11. GlaxoSmithKline plc
14.12. Company 11
14.13. Company 12
14.14. Company 13
14.15. Company 14
"*Financials would be provided on a best efforts basis for private companies"
15. Diabetic neuropathy Market -Appendix
15.1. Abbreviations
15.2. Sources
16. Diabetic neuropathy Market -Methodology Premium
16.1. Research Methodology
16.1.1. Company Expert Interviews
16.1.2. Industry Databases
16.1.3. Associations
16.1.4. Company News
16.1.5. Company Annual Reports
16.1.6. Application Trends
16.1.7. New Products and Product database
16.1.8. Company Transcripts
16.1.9. R&D Trends
16.1.10. Key Opinion Leaders Interviews
16.1.11. Supply and Demand Trends
List of Tables:
Table 1: Diabetic neuropathy Market Overview 2023-2030
Table 2: Diabetic neuropathy Market Leader Analysis 2023-2030 (US$)
Table 3: Diabetic neuropathy Market Product Analysis 2023-2030 (US$)
Table 4: Diabetic neuropathy Market End User Analysis 2023-2030 (US$)
Table 5: Diabetic neuropathy Market Patent Analysis 2013-2023* (US$)
Table 6: Diabetic neuropathy Market Financial Analysis 2023-2030 (US$)
Table 7: Diabetic neuropathy Market Driver Analysis 2023-2030 (US$)
Table 8: Diabetic neuropathy Market Challenges Analysis 2023-2030 (US$)
Table 9: Diabetic neuropathy Market Constraint Analysis 2023-2030 (US$)
Table 10: Diabetic neuropathy Market Supplier Bargaining Power Analysis 2023-2030 (US$)
Table 11: Diabetic neuropathy Market Buyer Bargaining Power Analysis 2023-2030 (US$)
Table 12: Diabetic neuropathy Market Threat of Substitutes Analysis 2023-2030 (US$)
Table 13: Diabetic neuropathy Market Threat of New Entrants Analysis 2023-2030 (US$)
Table 14: Diabetic neuropathy Market Degree of Competition Analysis 2023-2030 (US$)
Table 15: Diabetic neuropathy Market Value Chain Analysis 2023-2030 (US$)
Table 16: Diabetic neuropathy Market Pricing Analysis 2023-2030 (US$)
Table 17: Diabetic neuropathy Market Opportunities Analysis 2023-2030 (US$)
Table 18: Diabetic neuropathy Market Product Life Cycle Analysis 2023-2030 (US$)
Table 19: Diabetic neuropathy Market Supplier Analysis 2023-2030 (US$)
Table 20: Diabetic neuropathy Market Distributor Analysis 2023-2030 (US$)
Table 21: Diabetic neuropathy Market Trend Analysis 2023-2030 (US$)
Table 22: Diabetic neuropathy Market Size 2023 (US$)
Table 23: Diabetic neuropathy Market Forecast Analysis 2023-2030 (US$)
Table 24: Diabetic neuropathy Market Sales Forecast Analysis 2023-2030 (Units)
Table 25: Diabetic neuropathy Market, Revenue & Volume, By Type, 2023-2030 ($)
Table 26: Diabetic neuropathy Market By Type, Revenue & Volume, By Peripheral Neuropathy, 2023-2030 ($)
Table 27: Diabetic neuropathy Market By Type, Revenue & Volume, By Autonomic Neuropathy, 2023-2030 ($)
Table 28: Diabetic neuropathy Market By Type, Revenue & Volume, By Proximal Neuropathy, 2023-2030 ($)
Table 29: Diabetic neuropathy Market By Type, Revenue & Volume, By Focal Neuropathy, 2023-2030 ($)
Table 30: Diabetic neuropathy Market, Revenue & Volume, By Treatment Methods, 2023-2030 ($)
Table 31: Diabetic neuropathy Market By Treatment Methods, Revenue & Volume, By Antidepressants, 2023-2030 ($)
Table 32: Diabetic neuropathy Market By Treatment Methods, Revenue & Volume, By Anti-seizure medications, 2023-2030 ($)
Table 33: Diabetic neuropathy Market By Treatment Methods, Revenue & Volume, By Anticonvulsants, 2023-2030 ($)
Table 34: Diabetic neuropathy Market By Treatment Methods, Revenue & Volume, By Electrical Nerve Stimulation, 2023-2030 ($)
Table 35: Diabetic neuropathy Market By Treatment Methods, Revenue & Volume, By Topical Medications, 2023-2030 ($)
Table 36: North America Diabetic neuropathy Market, Revenue & Volume, By Type, 2023-2030 ($)
Table 37: North America Diabetic neuropathy Market, Revenue & Volume, By Treatment Methods, 2023-2030 ($)
Table 38: South america Diabetic neuropathy Market, Revenue & Volume, By Type, 2023-2030 ($)
Table 39: South america Diabetic neuropathy Market, Revenue & Volume, By Treatment Methods, 2023-2030 ($)
Table 40: Europe Diabetic neuropathy Market, Revenue & Volume, By Type, 2023-2030 ($)
Table 41: Europe Diabetic neuropathy Market, Revenue & Volume, By Treatment Methods, 2023-2030 ($)
Table 42: APAC Diabetic neuropathy Market, Revenue & Volume, By Type, 2023-2030 ($)
Table 43: APAC Diabetic neuropathy Market, Revenue & Volume, By Treatment Methods, 2023-2030 ($)
Table 44: Middle East & Africa Diabetic neuropathy Market, Revenue & Volume, By Type, 2023-2030 ($)
Table 45: Middle East & Africa Diabetic neuropathy Market, Revenue & Volume, By Treatment Methods, 2023-2030 ($)
Table 46: Russia Diabetic neuropathy Market, Revenue & Volume, By Type, 2023-2030 ($)
Table 47: Russia Diabetic neuropathy Market, Revenue & Volume, By Treatment Methods, 2023-2030 ($)
Table 48: Israel Diabetic neuropathy Market, Revenue & Volume, By Type, 2023-2030 ($)
Table 49: Israel Diabetic neuropathy Market, Revenue & Volume, By Treatment Methods, 2023-2030 ($)
Table 50: Top Companies 2023 (US$) Diabetic neuropathy Market, Revenue & Volume
Table 51: Product Launch 2023-2030 Diabetic neuropathy Market, Revenue & Volume
Table 52: Mergers & Acquistions 2023-2030 Diabetic neuropathy Market, Revenue & Volume
List of Figures:
Figure 1: Overview of Diabetic neuropathy Market 2023-2030
Figure 2: Market Share Analysis for Diabetic neuropathy Market 2023 (US$)
Figure 3: Product Comparison in Diabetic neuropathy Market 2023-2030 (US$)
Figure 4: End User Profile for Diabetic neuropathy Market 2023-2030 (US$)
Figure 5: Patent Application and Grant in Diabetic neuropathy Market 2013-2023* (US$)
Figure 6: Top 5 Companies Financial Analysis in Diabetic neuropathy Market 2023-2030 (US$)
Figure 7: Market Entry Strategy in Diabetic neuropathy Market 2023-2030
Figure 8: Ecosystem Analysis in Diabetic neuropathy Market 2023
Figure 9: Average Selling Price in Diabetic neuropathy Market 2023-2030
Figure 10: Top Opportunites in Diabetic neuropathy Market 2023-2030
Figure 11: Market Life Cycle Analysis in Diabetic neuropathy Market
Figure 12: GlobalBy Type Diabetic neuropathy Market Revenue, 2023-2030 ($)
Figure 13: GlobalBy Treatment Methods Diabetic neuropathy Market Revenue, 2023-2030 ($)
Figure 14: Global Diabetic neuropathy Market - By Geography
Figure 15: Global Diabetic neuropathy Market Value & Volume, By Geography, 2023-2030 ($)
Figure 16: Global Diabetic neuropathy Market CAGR, By Geography, 2023-2030 (%)
Figure 17: North America Diabetic neuropathy Market Value & Volume, 2023-2030 ($)
Figure 18: US Diabetic neuropathy Market Value & Volume, 2023-2030 ($)
Figure 19: US GDP and Population, 2023-2030 ($)
Figure 20: US GDP – Composition of 2023, By Sector of Origin
Figure 21: US Export and Import Value & Volume, 2023-2030 ($)
Figure 22: Canada Diabetic neuropathy Market Value & Volume, 2023-2030 ($)
Figure 23: Canada GDP and Population, 2023-2030 ($)
Figure 24: Canada GDP – Composition of 2023, By Sector of Origin
Figure 25: Canada Export and Import Value & Volume, 2023-2030 ($)
Figure 26: Mexico Diabetic neuropathy Market Value & Volume, 2023-2030 ($)
Figure 27: Mexico GDP and Population, 2023-2030 ($)
Figure 28: Mexico GDP – Composition of 2023, By Sector of Origin
Figure 29: Mexico Export and Import Value & Volume, 2023-2030 ($)
Figure 30: South America Diabetic neuropathy Market Value & Volume, 2023-2030 ($)
Figure 31: Brazil Diabetic neuropathy Market Value & Volume, 2023-2030 ($)
Figure 32: Brazil GDP and Population, 2023-2030 ($)
Figure 33: Brazil GDP – Composition of 2023, By Sector of Origin
Figure 34: Brazil Export and Import Value & Volume, 2023-2030 ($)
Figure 35: Venezuela Diabetic neuropathy Market Value & Volume, 2023-2030 ($)
Figure 36: Venezuela GDP and Population, 2023-2030 ($)
Figure 37: Venezuela GDP – Composition of 2023, By Sector of Origin
Figure 38: Venezuela Export and Import Value & Volume, 2023-2030 ($)
Figure 39: Argentina Diabetic neuropathy Market Value & Volume, 2023-2030 ($)
Figure 40: Argentina GDP and Population, 2023-2030 ($)
Figure 41: Argentina GDP – Composition of 2023, By Sector of Origin
Figure 42: Argentina Export and Import Value & Volume, 2023-2030 ($)
Figure 43: Ecuador Diabetic neuropathy Market Value & Volume, 2023-2030 ($)
Figure 44: Ecuador GDP and Population, 2023-2030 ($)
Figure 45: Ecuador GDP – Composition of 2023, By Sector of Origin
Figure 46: Ecuador Export and Import Value & Volume, 2023-2030 ($)
Figure 47: Peru Diabetic neuropathy Market Value & Volume, 2023-2030 ($)
Figure 48: Peru GDP and Population, 2023-2030 ($)
Figure 49: Peru GDP – Composition of 2023, By Sector of Origin
Figure 50: Peru Export and Import Value & Volume, 2023-2030 ($)
Figure 51: Colombia Diabetic neuropathy Market Value & Volume, 2023-2030 ($)
Figure 52: Colombia GDP and Population, 2023-2030 ($)
Figure 53: Colombia GDP – Composition of 2023, By Sector of Origin
Figure 54: Colombia Export and Import Value & Volume, 2023-2030 ($)
Figure 55: Costa Rica Diabetic neuropathy Market Value & Volume, 2023-2030 ($)
Figure 56: Costa Rica GDP and Population, 2023-2030 ($)
Figure 57: Costa Rica GDP – Composition of 2023, By Sector of Origin
Figure 58: Costa Rica Export and Import Value & Volume, 2023-2030 ($)
Figure 59: Europe Diabetic neuropathy Market Value & Volume, 2023-2030 ($)
Figure 60: U.K Diabetic neuropathy Market Value & Volume, 2023-2030 ($)
Figure 61: U.K GDP and Population, 2023-2030 ($)
Figure 62: U.K GDP – Composition of 2023, By Sector of Origin
Figure 63: U.K Export and Import Value & Volume, 2023-2030 ($)
Figure 64: Germany Diabetic neuropathy Market Value & Volume, 2023-2030 ($)
Figure 65: Germany GDP and Population, 2023-2030 ($)
Figure 66: Germany GDP – Composition of 2023, By Sector of Origin
Figure 67: Germany Export and Import Value & Volume, 2023-2030 ($)
Figure 68: Italy Diabetic neuropathy Market Value & Volume, 2023-2030 ($)
Figure 69: Italy GDP and Population, 2023-2030 ($)
Figure 70: Italy GDP – Composition of 2023, By Sector of Origin
Figure 71: Italy Export and Import Value & Volume, 2023-2030 ($)
Figure 72: France Diabetic neuropathy Market Value & Volume, 2023-2030 ($)
Figure 73: France GDP and Population, 2023-2030 ($)
Figure 74: France GDP – Composition of 2023, By Sector of Origin
Figure 75: France Export and Import Value & Volume, 2023-2030 ($)
Figure 76: Netherlands Diabetic neuropathy Market Value & Volume, 2023-2030 ($)
Figure 77: Netherlands GDP and Population, 2023-2030 ($)
Figure 78: Netherlands GDP – Composition of 2023, By Sector of Origin
Figure 79: Netherlands Export and Import Value & Volume, 2023-2030 ($)
Figure 80: Belgium Diabetic neuropathy Market Value & Volume, 2023-2030 ($)
Figure 81: Belgium GDP and Population, 2023-2030 ($)
Figure 82: Belgium GDP – Composition of 2023, By Sector of Origin
Figure 83: Belgium Export and Import Value & Volume, 2023-2030 ($)
Figure 84: Spain Diabetic neuropathy Market Value & Volume, 2023-2030 ($)
Figure 85: Spain GDP and Population, 2023-2030 ($)
Figure 86: Spain GDP – Composition of 2023, By Sector of Origin
Figure 87: Spain Export and Import Value & Volume, 2023-2030 ($)
Figure 88: Denmark Diabetic neuropathy Market Value & Volume, 2023-2030 ($)
Figure 89: Denmark GDP and Population, 2023-2030 ($)
Figure 90: Denmark GDP – Composition of 2023, By Sector of Origin
Figure 91: Denmark Export and Import Value & Volume, 2023-2030 ($)
Figure 92: APAC Diabetic neuropathy Market Value & Volume, 2023-2030 ($)
Figure 93: China Diabetic neuropathy Market Value & Volume, 2023-2030
Figure 94: China GDP and Population, 2023-2030 ($)
Figure 95: China GDP – Composition of 2023, By Sector of Origin
Figure 96: China Export and Import Value & Volume, 2023-2030 ($) Diabetic neuropathy Market China Export and Import Value & Volume, 2023-2030 ($)
Figure 97: Australia Diabetic neuropathy Market Value & Volume, 2023-2030 ($)
Figure 98: Australia GDP and Population, 2023-2030 ($)
Figure 99: Australia GDP – Composition of 2023, By Sector of Origin
Figure 100: Australia Export and Import Value & Volume, 2023-2030 ($)
Figure 101: South Korea Diabetic neuropathy Market Value & Volume, 2023-2030 ($)
Figure 102: South Korea GDP and Population, 2023-2030 ($)
Figure 103: South Korea GDP – Composition of 2023, By Sector of Origin
Figure 104: South Korea Export and Import Value & Volume, 2023-2030 ($)
Figure 105: India Diabetic neuropathy Market Value & Volume, 2023-2030 ($)
Figure 106: India GDP and Population, 2023-2030 ($)
Figure 107: India GDP – Composition of 2023, By Sector of Origin
Figure 108: India Export and Import Value & Volume, 2023-2030 ($)
Figure 109: Taiwan Diabetic neuropathy Market Value & Volume, 2023-2030 ($)
Figure 110: Taiwan GDP and Population, 2023-2030 ($)
Figure 111: Taiwan GDP – Composition of 2023, By Sector of Origin
Figure 112: Taiwan Export and Import Value & Volume, 2023-2030 ($)
Figure 113: Malaysia Diabetic neuropathy Market Value & Volume, 2023-2030 ($)
Figure 114: Malaysia GDP and Population, 2023-2030 ($)
Figure 115: Malaysia GDP – Composition of 2023, By Sector of Origin
Figure 116: Malaysia Export and Import Value & Volume, 2023-2030 ($)
Figure 117: Hong Kong Diabetic neuropathy Market Value & Volume, 2023-2030 ($)
Figure 118: Hong Kong GDP and Population, 2023-2030 ($)
Figure 119: Hong Kong GDP – Composition of 2023, By Sector of Origin
Figure 120: Hong Kong Export and Import Value & Volume, 2023-2030 ($)
Figure 121: Middle East & Africa Diabetic neuropathy Market Middle East & Africa 3D Printing Market Value & Volume, 2023-2030 ($)
Figure 122: Russia Diabetic neuropathy Market Value & Volume, 2023-2030 ($)
Figure 123: Russia GDP and Population, 2023-2030 ($)
Figure 124: Russia GDP – Composition of 2023, By Sector of Origin
Figure 125: Russia Export and Import Value & Volume, 2023-2030 ($)
Figure 126: Israel Diabetic neuropathy Market Value & Volume, 2023-2030 ($)
Figure 127: Israel GDP and Population, 2023-2030 ($)
Figure 128: Israel GDP – Composition of 2023, By Sector of Origin
Figure 129: Israel Export and Import Value & Volume, 2023-2030 ($)
Figure 130: Entropy Share, By Strategies, 2023-2030* (%) Diabetic neuropathy Market
Figure 131: Developments, 2023-2030* Diabetic neuropathy Market
Figure 132: Company 1 Diabetic neuropathy Market Net Revenue, By Years, 2023-2030* ($)
Figure 133: Company 1 Diabetic neuropathy Market Net Revenue Share, By Business segments, 2023 (%)
Figure 134: Company 1 Diabetic neuropathy Market Net Sales Share, By Geography, 2023 (%)
Figure 135: Company 2 Diabetic neuropathy Market Net Revenue, By Years, 2023-2030* ($)
Figure 136: Company 2 Diabetic neuropathy Market Net Revenue Share, By Business segments, 2023 (%)
Figure 137: Company 2 Diabetic neuropathy Market Net Sales Share, By Geography, 2023 (%)
Figure 138: Company 3 Diabetic neuropathy Market Net Revenue, By Years, 2023-2030* ($)
Figure 139: Company 3 Diabetic neuropathy Market Net Revenue Share, By Business segments, 2023 (%)
Figure 140: Company 3 Diabetic neuropathy Market Net Sales Share, By Geography, 2023 (%)
Figure 141: Company 4 Diabetic neuropathy Market Net Revenue, By Years, 2023-2030* ($)
Figure 142: Company 4 Diabetic neuropathy Market Net Revenue Share, By Business segments, 2023 (%)
Figure 143: Company 4 Diabetic neuropathy Market Net Sales Share, By Geography, 2023 (%)
Figure 144: Company 5 Diabetic neuropathy Market Net Revenue, By Years, 2023-2030* ($)
Figure 145: Company 5 Diabetic neuropathy Market Net Revenue Share, By Business segments, 2023 (%)
Figure 146: Company 5 Diabetic neuropathy Market Net Sales Share, By Geography, 2023 (%)
Figure 147: Company 6 Diabetic neuropathy Market Net Revenue, By Years, 2023-2030* ($)
Figure 148: Company 6 Diabetic neuropathy Market Net Revenue Share, By Business segments, 2023 (%)
Figure 149: Company 6 Diabetic neuropathy Market Net Sales Share, By Geography, 2023 (%)
Figure 150: Company 7 Diabetic neuropathy Market Net Revenue, By Years, 2023-2030* ($)
Figure 151: Company 7 Diabetic neuropathy Market Net Revenue Share, By Business segments, 2023 (%)
Figure 152: Company 7 Diabetic neuropathy Market Net Sales Share, By Geography, 2023 (%)
Figure 153: Company 8 Diabetic neuropathy Market Net Revenue, By Years, 2023-2030* ($)
Figure 154: Company 8 Diabetic neuropathy Market Net Revenue Share, By Business segments, 2023 (%)
Figure 155: Company 8 Diabetic neuropathy Market Net Sales Share, By Geography, 2023 (%)
Figure 156: Company 9 Diabetic neuropathy Market Net Revenue, By Years, 2023-2030* ($)
Figure 157: Company 9 Diabetic neuropathy Market Net Revenue Share, By Business segments, 2023 (%)
Figure 158: Company 9 Diabetic neuropathy Market Net Sales Share, By Geography, 2023 (%)
Figure 159: Company 10 Diabetic neuropathy Market Net Revenue, By Years, 2023-2030* ($)
Figure 160: Company 10 Diabetic neuropathy Market Net Revenue Share, By Business segments, 2023 (%)
Figure 161: Company 10 Diabetic neuropathy Market Net Sales Share, By Geography, 2023 (%)
Figure 162: Company 11 Diabetic neuropathy Market Net Revenue, By Years, 2023-2030* ($)
Figure 163: Company 11 Diabetic neuropathy Market Net Revenue Share, By Business segments, 2023 (%)
Figure 164: Company 11 Diabetic neuropathy Market Net Sales Share, By Geography, 2023 (%)
Figure 165: Company 12 Diabetic neuropathy Market Net Revenue, By Years, 2023-2030* ($)
Figure 166: Company 12 Diabetic neuropathy Market Net Revenue Share, By Business segments, 2023 (%)
Figure 167: Company 12 Diabetic neuropathy Market Net Sales Share, By Geography, 2023 (%)
Figure 168: Company 13 Diabetic neuropathy Market Net Revenue, By Years, 2023-2030* ($)
Figure 169: Company 13 Diabetic neuropathy Market Net Revenue Share, By Business segments, 2023 (%)
Figure 170: Company 13 Diabetic neuropathy Market Net Sales Share, By Geography, 2023 (%)
Figure 171: Company 14 Diabetic neuropathy Market Net Revenue, By Years, 2023-2030* ($)
Figure 172: Company 14 Diabetic neuropathy Market Net Revenue Share, By Business segments, 2023 (%)
Figure 173: Company 14 Diabetic neuropathy Market Net Sales Share, By Geography, 2023 (%)
Figure 174: Company 15 Diabetic neuropathy Market Net Revenue, By Years, 2023-2030* ($)
Figure 175: Company 15 Diabetic neuropathy Market Net Revenue Share, By Business segments, 2023 (%)
Figure 176: Company 15 Diabetic neuropathy Market Net Sales Share, By Geography, 2023 (%)