 Email
Email Print
Print


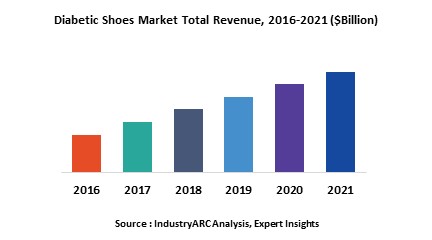
High blood sugar can damage internal components of human body such as the nerves and blood vessels that do have connectivity to the foot. People with increased sugar levels have high risk of developing foot related issues such as pain and swelling. Today there are diabetic shoes available in the market that can promote healthy blood circulation in the human feet. Diabetic shoes are of different categories and due to increase in the customer awareness for the healthcare products and the trending designs of these therapeutic shoes, the market has gained significant traction in the past years.
The report “Global Diabetic Shoes market” for the projected period 2016 to 2021 has been segmented on three different parameters. The global Diabetic Shoes market has been primarily studied on the basis of demographics. The Diabetic Shoes market has also been studied on the basis of different categories such as Athletics, Sandals and many more. The market has also been studied on the premise of different geographies based on the data obtained from the primaries and secondary research conducted amid the report formation.
Middle East and North America are the mature market for diabetic shoes as per the initial estimations as per the initial research results. This can be attributed to the presence of the highest number of diabetic patients in countries such as Saudi Arabia, Yemen, Iraq and USA. The level of awareness for these medical products in the customers present in these regions is considerably higher than the Asian and European customers. This difference of awareness can also be accounted for high purchasing power and use of advanced marketing channels used by the companies in the developed geographies. The increasing number of aging population and diabetic patients in the Asia-Pacific and European countries is laying down grounds for the growth of the diabetic shoe market in the coming years. However, the global Diabetic Shoes market is being restrained by factors such as low branding and marketing of diabetic shoes and also because of the stringent barriers and regulations for entering this particular market.
Sample Companies Profiled in this Report are:
The Diabetic Shoes market report also comprises of the leading companies profiled in an extremely descriptive manner. The company profiles include financial summaries, strategies, recent developments and product portfolios of the leading companies in the Diabetic Shoes market. The report also incorporates a profound study of the market entropy, market forces and strategic analysis of the Diabetic Shoes market.
The report “Global Diabetic Shoes market” for the projected period 2016 to 2021 has been segmented on three different parameters. The global Diabetic Shoes market has been primarily studied on the basis of demographics. The Diabetic Shoes market has also been studied on the basis of different categories such as Athletics, Sandals and many more. The market has also been studied on the premise of different geographies based on the data obtained from the primaries and secondary research conducted amid the report formation.
Middle East and North America are the mature market for diabetic shoes as per the initial estimations as per the initial research results. This can be attributed to the presence of the highest number of diabetic patients in countries such as Saudi Arabia, Yemen, Iraq and USA. The level of awareness for these medical products in the customers present in these regions is considerably higher than the Asian and European customers. This difference of awareness can also be accounted for high purchasing power and use of advanced marketing channels used by the companies in the developed geographies. The increasing number of aging population and diabetic patients in the Asia-Pacific and European countries is laying down grounds for the growth of the diabetic shoe market in the coming years. However, the global Diabetic Shoes market is being restrained by factors such as low branding and marketing of diabetic shoes and also because of the stringent barriers and regulations for entering this particular market.
Sample Companies Profiled in this Report are:
- ThromboGenics NV
- Allergan PLC
- Bayer AG
- Regeneron Pharmaceuticals Inc.
- Novartis AG
- 10+
The Diabetic Shoes market report also comprises of the leading companies profiled in an extremely descriptive manner. The company profiles include financial summaries, strategies, recent developments and product portfolios of the leading companies in the Diabetic Shoes market. The report also incorporates a profound study of the market entropy, market forces and strategic analysis of the Diabetic Shoes market.
1. Diabetic Shoes Market - Overview
1.1. Definitions and Scope
2. Diabetic Shoes Market - Executive summary
2.1. Market Revenue, Market Size and Key Trends by Company
2.2. Key Trends by type of Application
2.3. Key Trends segmented by Geography
3. Diabetic Shoes Market
3.1. Comparative analysis
3.1.1. Product Benchmarking - Top 10 companies
3.1.2. Top 5 Financials Analysis
3.1.3. Market Value split by Top 10 companies
3.1.4. Patent Analysis - Top 10 companies
3.1.5. Pricing Analysis
4. Diabetic Shoes Market – Startup companies Scenario Premium
4.1. Top 10 startup company Analysis by
4.1.1. Investment
4.1.2. Revenue
4.1.3. Market Shares
4.1.4. Market Size and Application Analysis
4.1.5. Venture Capital and Funding Scenario
5. Diabetic Shoes Market – Industry Market Entry Scenario Premium
5.1. Regulatory Framework Overview
5.2. New Business and Ease of Doing business index
5.3. Case studies of successful ventures
5.4. Customer Analysis – Top 10 companies
6. Diabetic Shoes Market Forces
6.1. Drivers
6.2. Constraints
6.3. Challenges
6.4. Porters five force model
6.4.1. Bargaining power of suppliers
6.4.2. Bargaining powers of customers
6.4.3. Threat of new entrants
6.4.4. Rivalry among existing players
6.4.5. Threat of substitutes
7. Diabetic Shoes Market -Strategic analysis
7.1. Value chain analysis
7.2. Opportunities analysis
7.3. Product life cycle
7.4. Suppliers and distributors Market Share
8. Diabetic Shoes Market – By Gender (Market Size -$Million / $Billion)
8.1. Market Size and Market Share Analysis
8.2. Application Revenue and Trend Research
8.3. Product Segment Analysis
8.3.1. Men
8.3.2. Women
9. Diabetic Shoes Market – By Type (Market Size -$Million / $Billion)
9.1. Athletics
9.2. Casuals
9.3. Sandals
9.4. Floaters
9.5. Boots
10. Diabetic Shoes Market – By Distribution Channel (Market Size -$Million / $Billion)
10.1. Exclusive Brand Stores
10.2. Retailers (e.g. Lifestyle, Shoppers Stop)
10.3. Online Platform
10.4. Distributers
10.5. Unorganized Channel
11. Diabetic Shoes - By Geography (Market Size -$Million / $Billion)
11.1. Diabetic Shoes Market - North America Segment Research
11.2. North America Market Research (Million / $Billion)
11.2.1. Segment type Size and Market Size Analysis
11.2.2. Revenue and Trends
11.2.3. Application Revenue and Trends by type of Application
11.2.4. Company Revenue and Product Analysis
11.2.5. North America Product type and Application Market Size
11.2.5.1. U.S.
11.2.5.2. Canada
11.2.5.3. Mexico
11.2.5.4. Rest of North America
11.3. Diabetic Shoes - South America Segment Research
11.4. South America Market Research (Market Size -$Million / $Billion)
11.4.1. Segment type Size and Market Size Analysis
11.4.2. Revenue and Trends
11.4.3. Application Revenue and Trends by type of Application
11.4.4. Company Revenue and Product Analysis
11.4.5. South America Product type and Application Market Size
11.4.5.1. Brazil
11.4.5.2. Venezuela
11.4.5.3. Argentina
11.4.5.4. Ecuador
11.4.5.5. Peru
11.4.5.6. Colombia
11.4.5.7. Costa Rica
11.4.5.8. Rest of South America
11.5. Diabetic Shoes - Europe Segment Research
11.6. Europe Market Research (Market Size -$Million / $Billion)
11.6.1. Segment type Size and Market Size Analysis
11.6.2. Revenue and Trends
11.6.3. Application Revenue and Trends by type of Application
11.6.4. Company Revenue and Product Analysis
11.6.5. Europe Segment Product type and Application Market Size
11.6.5.1. U.K
11.6.5.2. Germany
11.6.5.3. Italy
11.6.5.4. France
11.6.5.5. Netherlands
11.6.5.6. Belgium
11.6.5.7. Spain
11.6.5.8. Denmark
11.6.5.9. Rest of Europe
11.7. Diabetic Shoes – APAC Segment Research
11.8. APAC Market Research (Market Size -$Million / $Billion)
11.8.1. Segment type Size and Market Size Analysis
11.8.2. Revenue and Trends
11.8.3. Application Revenue and Trends by type of Application
11.8.4. Company Revenue and Product Analysis
11.8.5. APAC Segment – Product type and Application Market Size
11.8.5.1. China
11.8.5.2. Australia
11.8.5.3. Japan
11.8.5.4. South Korea
11.8.5.5. India
11.8.5.6. Taiwan
11.8.5.7. Malaysia
12. Diabetic Shoes Market - Entropy
12.1. New product launches
12.2. M&A's, collaborations, JVs and partnerships
13. Diabetic Shoes Market – Industry / Segment Competition landscape Premium
13.1. Market Share Analysis
13.1.1. Market Share by Country- Top companies
13.1.2. Market Share by Region- Top 10 companies
13.1.3. Market Share by type of Application – Top 10 companies
13.1.4. Market Share by type of Product / Product category- Top 10 companies
13.1.5. Market Share at global level- Top 10 companies
13.1.6. Best Practises for companies
14. Diabetic Shoes Market – Key Company List by Country Premium
15. Diabetic Shoes Market Company Analysis
15.1. Market Share, Company Revenue, Products, M&A, Developments
15.2. Orthofeets
15.3. New Balance Athletic Shoe, Inc.,
15.4. Dr. Comfort
15.5. Propét USA, Inc.
15.6. P.W.Minor
15.7. Aetrex Worldwide, Inc.
15.8. Pedilite LLC
15.9. Oasis Footwear,LLC
15.10. SureFit
15.11. InStride Shoes LLC and more
"*Financials would be provided on a best efforts basis for private companies"
16. Diabetic Shoes Market -Appendix
16.1. Abbreviations
16.2. Sources
17. Diabetic Shoes Market -Methodology Premium
17.1. Research Methodology
17.1.1. Company Expert Interviews
17.1.2. Industry Databases
17.1.3. Associations
17.1.4. Company News
17.1.5. Company Annual Reports
17.1.6. Application Trends
17.1.7. New Products and Product database
17.1.8. Company Transcripts
17.1.9. R&D Trends
17.1.10. Key Opinion Leaders Interviews
17.1.11. Supply and Demand Trends
List of Tables:
Table 1: Diabetic Shoes Market Overview 2023-2030
Table 2: Diabetic Shoes Market Leader Analysis 2023-2030 (US$)
Table 3: Diabetic Shoes Market Product Analysis 2023-2030 (US$)
Table 4: Diabetic Shoes Market End User Analysis 2023-2030 (US$)
Table 5: Diabetic Shoes Market Patent Analysis 2013-2023* (US$)
Table 6: Diabetic Shoes Market Financial Analysis 2023-2030 (US$)
Table 7: Diabetic Shoes Market Driver Analysis 2023-2030 (US$)
Table 8: Diabetic Shoes Market Challenges Analysis 2023-2030 (US$)
Table 9: Diabetic Shoes Market Constraint Analysis 2023-2030 (US$)
Table 10: Diabetic Shoes Market Supplier Bargaining Power Analysis 2023-2030 (US$)
Table 11: Diabetic Shoes Market Buyer Bargaining Power Analysis 2023-2030 (US$)
Table 12: Diabetic Shoes Market Threat of Substitutes Analysis 2023-2030 (US$)
Table 13: Diabetic Shoes Market Threat of New Entrants Analysis 2023-2030 (US$)
Table 14: Diabetic Shoes Market Degree of Competition Analysis 2023-2030 (US$)
Table 15: Diabetic Shoes Market Value Chain Analysis 2023-2030 (US$)
Table 16: Diabetic Shoes Market Pricing Analysis 2023-2030 (US$)
Table 17: Diabetic Shoes Market Opportunities Analysis 2023-2030 (US$)
Table 18: Diabetic Shoes Market Product Life Cycle Analysis 2023-2030 (US$)
Table 19: Diabetic Shoes Market Supplier Analysis 2023-2030 (US$)
Table 20: Diabetic Shoes Market Distributor Analysis 2023-2030 (US$)
Table 21: Diabetic Shoes Market Trend Analysis 2023-2030 (US$)
Table 22: Diabetic Shoes Market Size 2023 (US$)
Table 23: Diabetic Shoes Market Forecast Analysis 2023-2030 (US$)
Table 24: Diabetic Shoes Market Sales Forecast Analysis 2023-2030 (Units)
Table 25: Diabetic Shoes Market, Revenue & Volume, By Type, 2023-2030 ($)
Table 26: Diabetic Shoes Market By Type, Revenue & Volume, By Athletics, 2023-2030 ($)
Table 27: Diabetic Shoes Market By Type, Revenue & Volume, By Casuals, 2023-2030 ($)
Table 28: Diabetic Shoes Market By Type, Revenue & Volume, By Sandals, 2023-2030 ($)
Table 29: Diabetic Shoes Market By Type, Revenue & Volume, By Floaters, 2023-2030 ($)
Table 30: Diabetic Shoes Market By Type, Revenue & Volume, By Boots, 2023-2030 ($)
Table 31: Diabetic Shoes Market, Revenue & Volume, By Gender, 2023-2030 ($)
Table 32: Diabetic Shoes Market By Gender, Revenue & Volume, By Men, 2023-2030 ($)
Table 33: Diabetic Shoes Market By Gender, Revenue & Volume, By Women, 2023-2030 ($)
Table 34: Diabetic Shoes Market, Revenue & Volume, By Distribution Channel, 2023-2030 ($)
Table 35: Diabetic Shoes Market By Distribution Channel, Revenue & Volume, By Exclusive Brand Stores, 2023-2030 ($)
Table 36: Diabetic Shoes Market By Distribution Channel, Revenue & Volume, By Retailers (e.g. Lifestyle, Shoppers Stop), 2023-2030 ($)
Table 37: Diabetic Shoes Market By Distribution Channel, Revenue & Volume, By Online Platform, 2023-2030 ($)
Table 38: Diabetic Shoes Market By Distribution Channel, Revenue & Volume, By Distributers, 2023-2030 ($)
Table 39: Diabetic Shoes Market By Distribution Channel, Revenue & Volume, By Unorganized Channel, 2023-2030 ($)
Table 40: North America Diabetic Shoes Market, Revenue & Volume, By Type, 2023-2030 ($)
Table 41: North America Diabetic Shoes Market, Revenue & Volume, By Gender, 2023-2030 ($)
Table 42: North America Diabetic Shoes Market, Revenue & Volume, By Distribution Channel, 2023-2030 ($)
Table 43: South america Diabetic Shoes Market, Revenue & Volume, By Type, 2023-2030 ($)
Table 44: South america Diabetic Shoes Market, Revenue & Volume, By Gender, 2023-2030 ($)
Table 45: South america Diabetic Shoes Market, Revenue & Volume, By Distribution Channel, 2023-2030 ($)
Table 46: Europe Diabetic Shoes Market, Revenue & Volume, By Type, 2023-2030 ($)
Table 47: Europe Diabetic Shoes Market, Revenue & Volume, By Gender, 2023-2030 ($)
Table 48: Europe Diabetic Shoes Market, Revenue & Volume, By Distribution Channel, 2023-2030 ($)
Table 49: APAC Diabetic Shoes Market, Revenue & Volume, By Type, 2023-2030 ($)
Table 50: APAC Diabetic Shoes Market, Revenue & Volume, By Gender, 2023-2030 ($)
Table 51: APAC Diabetic Shoes Market, Revenue & Volume, By Distribution Channel, 2023-2030 ($)
Table 52: Middle East & Africa Diabetic Shoes Market, Revenue & Volume, By Type, 2023-2030 ($)
Table 53: Middle East & Africa Diabetic Shoes Market, Revenue & Volume, By Gender, 2023-2030 ($)
Table 54: Middle East & Africa Diabetic Shoes Market, Revenue & Volume, By Distribution Channel, 2023-2030 ($)
Table 55: Russia Diabetic Shoes Market, Revenue & Volume, By Type, 2023-2030 ($)
Table 56: Russia Diabetic Shoes Market, Revenue & Volume, By Gender, 2023-2030 ($)
Table 57: Russia Diabetic Shoes Market, Revenue & Volume, By Distribution Channel, 2023-2030 ($)
Table 58: Israel Diabetic Shoes Market, Revenue & Volume, By Type, 2023-2030 ($)
Table 59: Israel Diabetic Shoes Market, Revenue & Volume, By Gender, 2023-2030 ($)
Table 60: Israel Diabetic Shoes Market, Revenue & Volume, By Distribution Channel, 2023-2030 ($)
Table 61: Top Companies 2023 (US$) Diabetic Shoes Market, Revenue & Volume
Table 62: Product Launch 2023-2030 Diabetic Shoes Market, Revenue & Volume
Table 63: Mergers & Acquistions 2023-2030 Diabetic Shoes Market, Revenue & Volume
List of Figures:
Figure 1: Overview of Diabetic Shoes Market 2023-2030
Figure 2: Market Share Analysis for Diabetic Shoes Market 2023 (US$)
Figure 3: Product Comparison in Diabetic Shoes Market 2023-2030 (US$)
Figure 4: End User Profile for Diabetic Shoes Market 2023-2030 (US$)
Figure 5: Patent Application and Grant in Diabetic Shoes Market 2013-2023* (US$)
Figure 6: Top 5 Companies Financial Analysis in Diabetic Shoes Market 2023-2030 (US$)
Figure 7: Market Entry Strategy in Diabetic Shoes Market 2023-2030
Figure 8: Ecosystem Analysis in Diabetic Shoes Market 2023
Figure 9: Average Selling Price in Diabetic Shoes Market 2023-2030
Figure 10: Top Opportunites in Diabetic Shoes Market 2023-2030
Figure 11: Market Life Cycle Analysis in Diabetic Shoes Market
Figure 12: GlobalBy Type Diabetic Shoes Market Revenue, 2023-2030 ($)
Figure 13: GlobalBy Gender Diabetic Shoes Market Revenue, 2023-2030 ($)
Figure 14: GlobalBy Distribution Channel Diabetic Shoes Market Revenue, 2023-2030 ($)
Figure 15: Global Diabetic Shoes Market - By Geography
Figure 16: Global Diabetic Shoes Market Value & Volume, By Geography, 2023-2030 ($)
Figure 17: Global Diabetic Shoes Market CAGR, By Geography, 2023-2030 (%)
Figure 18: North America Diabetic Shoes Market Value & Volume, 2023-2030 ($)
Figure 19: US Diabetic Shoes Market Value & Volume, 2023-2030 ($)
Figure 20: US GDP and Population, 2023-2030 ($)
Figure 21: US GDP – Composition of 2023, By Sector of Origin
Figure 22: US Export and Import Value & Volume, 2023-2030 ($)
Figure 23: Canada Diabetic Shoes Market Value & Volume, 2023-2030 ($)
Figure 24: Canada GDP and Population, 2023-2030 ($)
Figure 25: Canada GDP – Composition of 2023, By Sector of Origin
Figure 26: Canada Export and Import Value & Volume, 2023-2030 ($)
Figure 27: Mexico Diabetic Shoes Market Value & Volume, 2023-2030 ($)
Figure 28: Mexico GDP and Population, 2023-2030 ($)
Figure 29: Mexico GDP – Composition of 2023, By Sector of Origin
Figure 30: Mexico Export and Import Value & Volume, 2023-2030 ($)
Figure 31: South America Diabetic Shoes Market Value & Volume, 2023-2030 ($)
Figure 32: Brazil Diabetic Shoes Market Value & Volume, 2023-2030 ($)
Figure 33: Brazil GDP and Population, 2023-2030 ($)
Figure 34: Brazil GDP – Composition of 2023, By Sector of Origin
Figure 35: Brazil Export and Import Value & Volume, 2023-2030 ($)
Figure 36: Venezuela Diabetic Shoes Market Value & Volume, 2023-2030 ($)
Figure 37: Venezuela GDP and Population, 2023-2030 ($)
Figure 38: Venezuela GDP – Composition of 2023, By Sector of Origin
Figure 39: Venezuela Export and Import Value & Volume, 2023-2030 ($)
Figure 40: Argentina Diabetic Shoes Market Value & Volume, 2023-2030 ($)
Figure 41: Argentina GDP and Population, 2023-2030 ($)
Figure 42: Argentina GDP – Composition of 2023, By Sector of Origin
Figure 43: Argentina Export and Import Value & Volume, 2023-2030 ($)
Figure 44: Ecuador Diabetic Shoes Market Value & Volume, 2023-2030 ($)
Figure 45: Ecuador GDP and Population, 2023-2030 ($)
Figure 46: Ecuador GDP – Composition of 2023, By Sector of Origin
Figure 47: Ecuador Export and Import Value & Volume, 2023-2030 ($)
Figure 48: Peru Diabetic Shoes Market Value & Volume, 2023-2030 ($)
Figure 49: Peru GDP and Population, 2023-2030 ($)
Figure 50: Peru GDP – Composition of 2023, By Sector of Origin
Figure 51: Peru Export and Import Value & Volume, 2023-2030 ($)
Figure 52: Colombia Diabetic Shoes Market Value & Volume, 2023-2030 ($)
Figure 53: Colombia GDP and Population, 2023-2030 ($)
Figure 54: Colombia GDP – Composition of 2023, By Sector of Origin
Figure 55: Colombia Export and Import Value & Volume, 2023-2030 ($)
Figure 56: Costa Rica Diabetic Shoes Market Value & Volume, 2023-2030 ($)
Figure 57: Costa Rica GDP and Population, 2023-2030 ($)
Figure 58: Costa Rica GDP – Composition of 2023, By Sector of Origin
Figure 59: Costa Rica Export and Import Value & Volume, 2023-2030 ($)
Figure 60: Europe Diabetic Shoes Market Value & Volume, 2023-2030 ($)
Figure 61: U.K Diabetic Shoes Market Value & Volume, 2023-2030 ($)
Figure 62: U.K GDP and Population, 2023-2030 ($)
Figure 63: U.K GDP – Composition of 2023, By Sector of Origin
Figure 64: U.K Export and Import Value & Volume, 2023-2030 ($)
Figure 65: Germany Diabetic Shoes Market Value & Volume, 2023-2030 ($)
Figure 66: Germany GDP and Population, 2023-2030 ($)
Figure 67: Germany GDP – Composition of 2023, By Sector of Origin
Figure 68: Germany Export and Import Value & Volume, 2023-2030 ($)
Figure 69: Italy Diabetic Shoes Market Value & Volume, 2023-2030 ($)
Figure 70: Italy GDP and Population, 2023-2030 ($)
Figure 71: Italy GDP – Composition of 2023, By Sector of Origin
Figure 72: Italy Export and Import Value & Volume, 2023-2030 ($)
Figure 73: France Diabetic Shoes Market Value & Volume, 2023-2030 ($)
Figure 74: France GDP and Population, 2023-2030 ($)
Figure 75: France GDP – Composition of 2023, By Sector of Origin
Figure 76: France Export and Import Value & Volume, 2023-2030 ($)
Figure 77: Netherlands Diabetic Shoes Market Value & Volume, 2023-2030 ($)
Figure 78: Netherlands GDP and Population, 2023-2030 ($)
Figure 79: Netherlands GDP – Composition of 2023, By Sector of Origin
Figure 80: Netherlands Export and Import Value & Volume, 2023-2030 ($)
Figure 81: Belgium Diabetic Shoes Market Value & Volume, 2023-2030 ($)
Figure 82: Belgium GDP and Population, 2023-2030 ($)
Figure 83: Belgium GDP – Composition of 2023, By Sector of Origin
Figure 84: Belgium Export and Import Value & Volume, 2023-2030 ($)
Figure 85: Spain Diabetic Shoes Market Value & Volume, 2023-2030 ($)
Figure 86: Spain GDP and Population, 2023-2030 ($)
Figure 87: Spain GDP – Composition of 2023, By Sector of Origin
Figure 88: Spain Export and Import Value & Volume, 2023-2030 ($)
Figure 89: Denmark Diabetic Shoes Market Value & Volume, 2023-2030 ($)
Figure 90: Denmark GDP and Population, 2023-2030 ($)
Figure 91: Denmark GDP – Composition of 2023, By Sector of Origin
Figure 92: Denmark Export and Import Value & Volume, 2023-2030 ($)
Figure 93: APAC Diabetic Shoes Market Value & Volume, 2023-2030 ($)
Figure 94: China Diabetic Shoes Market Value & Volume, 2023-2030
Figure 95: China GDP and Population, 2023-2030 ($)
Figure 96: China GDP – Composition of 2023, By Sector of Origin
Figure 97: China Export and Import Value & Volume, 2023-2030 ($) Diabetic Shoes Market China Export and Import Value & Volume, 2023-2030 ($)
Figure 98: Australia Diabetic Shoes Market Value & Volume, 2023-2030 ($)
Figure 99: Australia GDP and Population, 2023-2030 ($)
Figure 100: Australia GDP – Composition of 2023, By Sector of Origin
Figure 101: Australia Export and Import Value & Volume, 2023-2030 ($)
Figure 102: South Korea Diabetic Shoes Market Value & Volume, 2023-2030 ($)
Figure 103: South Korea GDP and Population, 2023-2030 ($)
Figure 104: South Korea GDP – Composition of 2023, By Sector of Origin
Figure 105: South Korea Export and Import Value & Volume, 2023-2030 ($)
Figure 106: India Diabetic Shoes Market Value & Volume, 2023-2030 ($)
Figure 107: India GDP and Population, 2023-2030 ($)
Figure 108: India GDP – Composition of 2023, By Sector of Origin
Figure 109: India Export and Import Value & Volume, 2023-2030 ($)
Figure 110: Taiwan Diabetic Shoes Market Value & Volume, 2023-2030 ($)
Figure 111: Taiwan GDP and Population, 2023-2030 ($)
Figure 112: Taiwan GDP – Composition of 2023, By Sector of Origin
Figure 113: Taiwan Export and Import Value & Volume, 2023-2030 ($)
Figure 114: Malaysia Diabetic Shoes Market Value & Volume, 2023-2030 ($)
Figure 115: Malaysia GDP and Population, 2023-2030 ($)
Figure 116: Malaysia GDP – Composition of 2023, By Sector of Origin
Figure 117: Malaysia Export and Import Value & Volume, 2023-2030 ($)
Figure 118: Hong Kong Diabetic Shoes Market Value & Volume, 2023-2030 ($)
Figure 119: Hong Kong GDP and Population, 2023-2030 ($)
Figure 120: Hong Kong GDP – Composition of 2023, By Sector of Origin
Figure 121: Hong Kong Export and Import Value & Volume, 2023-2030 ($)
Figure 122: Middle East & Africa Diabetic Shoes Market Middle East & Africa 3D Printing Market Value & Volume, 2023-2030 ($)
Figure 123: Russia Diabetic Shoes Market Value & Volume, 2023-2030 ($)
Figure 124: Russia GDP and Population, 2023-2030 ($)
Figure 125: Russia GDP – Composition of 2023, By Sector of Origin
Figure 126: Russia Export and Import Value & Volume, 2023-2030 ($)
Figure 127: Israel Diabetic Shoes Market Value & Volume, 2023-2030 ($)
Figure 128: Israel GDP and Population, 2023-2030 ($)
Figure 129: Israel GDP – Composition of 2023, By Sector of Origin
Figure 130: Israel Export and Import Value & Volume, 2023-2030 ($)
Figure 131: Entropy Share, By Strategies, 2023-2030* (%) Diabetic Shoes Market
Figure 132: Developments, 2023-2030* Diabetic Shoes Market
Figure 133: Company 1 Diabetic Shoes Market Net Revenue, By Years, 2023-2030* ($)
Figure 134: Company 1 Diabetic Shoes Market Net Revenue Share, By Business segments, 2023 (%)
Figure 135: Company 1 Diabetic Shoes Market Net Sales Share, By Geography, 2023 (%)
Figure 136: Company 2 Diabetic Shoes Market Net Revenue, By Years, 2023-2030* ($)
Figure 137: Company 2 Diabetic Shoes Market Net Revenue Share, By Business segments, 2023 (%)
Figure 138: Company 2 Diabetic Shoes Market Net Sales Share, By Geography, 2023 (%)
Figure 139: Company 3 Diabetic Shoes Market Net Revenue, By Years, 2023-2030* ($)
Figure 140: Company 3 Diabetic Shoes Market Net Revenue Share, By Business segments, 2023 (%)
Figure 141: Company 3 Diabetic Shoes Market Net Sales Share, By Geography, 2023 (%)
Figure 142: Company 4 Diabetic Shoes Market Net Revenue, By Years, 2023-2030* ($)
Figure 143: Company 4 Diabetic Shoes Market Net Revenue Share, By Business segments, 2023 (%)
Figure 144: Company 4 Diabetic Shoes Market Net Sales Share, By Geography, 2023 (%)
Figure 145: Company 5 Diabetic Shoes Market Net Revenue, By Years, 2023-2030* ($)
Figure 146: Company 5 Diabetic Shoes Market Net Revenue Share, By Business segments, 2023 (%)
Figure 147: Company 5 Diabetic Shoes Market Net Sales Share, By Geography, 2023 (%)
Figure 148: Company 6 Diabetic Shoes Market Net Revenue, By Years, 2023-2030* ($)
Figure 149: Company 6 Diabetic Shoes Market Net Revenue Share, By Business segments, 2023 (%)
Figure 150: Company 6 Diabetic Shoes Market Net Sales Share, By Geography, 2023 (%)
Figure 151: Company 7 Diabetic Shoes Market Net Revenue, By Years, 2023-2030* ($)
Figure 152: Company 7 Diabetic Shoes Market Net Revenue Share, By Business segments, 2023 (%)
Figure 153: Company 7 Diabetic Shoes Market Net Sales Share, By Geography, 2023 (%)
Figure 154: Company 8 Diabetic Shoes Market Net Revenue, By Years, 2023-2030* ($)
Figure 155: Company 8 Diabetic Shoes Market Net Revenue Share, By Business segments, 2023 (%)
Figure 156: Company 8 Diabetic Shoes Market Net Sales Share, By Geography, 2023 (%)
Figure 157: Company 9 Diabetic Shoes Market Net Revenue, By Years, 2023-2030* ($)
Figure 158: Company 9 Diabetic Shoes Market Net Revenue Share, By Business segments, 2023 (%)
Figure 159: Company 9 Diabetic Shoes Market Net Sales Share, By Geography, 2023 (%)
Figure 160: Company 10 Diabetic Shoes Market Net Revenue, By Years, 2023-2030* ($)
Figure 161: Company 10 Diabetic Shoes Market Net Revenue Share, By Business segments, 2023 (%)
Figure 162: Company 10 Diabetic Shoes Market Net Sales Share, By Geography, 2023 (%)
Figure 163: Company 11 Diabetic Shoes Market Net Revenue, By Years, 2023-2030* ($)
Figure 164: Company 11 Diabetic Shoes Market Net Revenue Share, By Business segments, 2023 (%)
Figure 165: Company 11 Diabetic Shoes Market Net Sales Share, By Geography, 2023 (%)
Figure 166: Company 12 Diabetic Shoes Market Net Revenue, By Years, 2023-2030* ($)
Figure 167: Company 12 Diabetic Shoes Market Net Revenue Share, By Business segments, 2023 (%)
Figure 168: Company 12 Diabetic Shoes Market Net Sales Share, By Geography, 2023 (%)
Figure 169: Company 13 Diabetic Shoes Market Net Revenue, By Years, 2023-2030* ($)
Figure 170: Company 13 Diabetic Shoes Market Net Revenue Share, By Business segments, 2023 (%)
Figure 171: Company 13 Diabetic Shoes Market Net Sales Share, By Geography, 2023 (%)
Figure 172: Company 14 Diabetic Shoes Market Net Revenue, By Years, 2023-2030* ($)
Figure 173: Company 14 Diabetic Shoes Market Net Revenue Share, By Business segments, 2023 (%)
Figure 174: Company 14 Diabetic Shoes Market Net Sales Share, By Geography, 2023 (%)
Figure 175: Company 15 Diabetic Shoes Market Net Revenue, By Years, 2023-2030* ($)
Figure 176: Company 15 Diabetic Shoes Market Net Revenue Share, By Business segments, 2023 (%)
Figure 177: Company 15 Diabetic Shoes Market Net Sales Share, By Geography, 2023 (%)