 Email
Email Print
Print


Pediculosis Treatment Market - Forecast(2024 - 2030)
Pediculosis is caused due to infestation of blood feeding Phthiraptera, and an ectoparasitic insect Louse. Lice saliva enters human circulatory system, while sucking human blood and this causes puritus. Pediculosis spreads through close physical contact, cloths and linens, combs, hats, and others. Globally, increase in prevalence of pediculosis, rise in the awareness regarding pediculosis and growing adoption of human lice in forensic studies are the prime growth drivers of pediculosis treatment market. In addition, increase in adoption of pediculosis treatment in emerging economies such as China, India and others will create new opportunities for pediculosis treatment market. However, higher cost of the research and development, and lack of diagnostic tools and condition specific treatment are the key restraints for pediculosis treatment market.
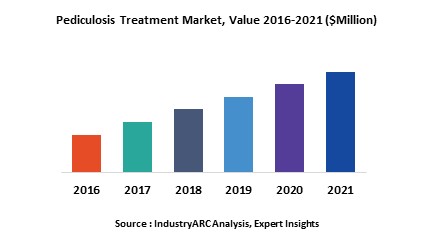
This report identifies the global pediculosis treatment market size in for the year 2014-2016, and forecast of the same for year 2021. It also highlights the potential growth opportunities in the coming years, while also reviewing the market drivers, restraints, growth indicators, challenges, market dynamics, competitive landscape and other key aspects with respect to pediculosis treatment market.
Geographically, North America dominated the pediculosis treatment market due to modernize healthcare infrastructure, higher healthcare spending, reimbursement coverage and government support. Asia Pacific is projected to have the fastest growth, owing to rapidly increasing aging population, rise in awareness about pediculosis and related treatments, modernization of healthcare infrastructure and growing medical tourism industry in developing nations such as China and India in this region. Among all the louse type, pediculosis pubis has the highest market share in pediculosis treatment market.
This report segments pediculosis treatment market on the basis of louse type, treatment, and regional market as follows:
This report identifies all the major companies operating in the pediculosis treatment market. Some of the major companies’ profiles in detail are as follows:
This report identifies the global pediculosis treatment market size in for the year 2014-2016, and forecast of the same for year 2021. It also highlights the potential growth opportunities in the coming years, while also reviewing the market drivers, restraints, growth indicators, challenges, market dynamics, competitive landscape and other key aspects with respect to pediculosis treatment market.
Geographically, North America dominated the pediculosis treatment market due to modernize healthcare infrastructure, higher healthcare spending, reimbursement coverage and government support. Asia Pacific is projected to have the fastest growth, owing to rapidly increasing aging population, rise in awareness about pediculosis and related treatments, modernization of healthcare infrastructure and growing medical tourism industry in developing nations such as China and India in this region. Among all the louse type, pediculosis pubis has the highest market share in pediculosis treatment market.
This report segments pediculosis treatment market on the basis of louse type, treatment, and regional market as follows:
- Pediculosis Treatment Market, By Louse Type: Pediculosis Capitis, Pediculosis Pubis, and Pediculosis Corporis
- The report has focused study on pediculosis treatment market by basis of treatment such as: Dimeticone Lotion, Malathion + Dimeticone Lotion, Isopropyl Alcohol, Suffocation-Based Pediculicide, Petrolatum, Mercuric Oxide Ointment, and Others
- This report has been further segmented into major regions, which includes detailed analysis of each region such as: North America, Europe, Asia-Pacific (APAC), and Rest of the World (RoW) covering all the major country level markets in each of the region
This report identifies all the major companies operating in the pediculosis treatment market. Some of the major companies’ profiles in detail are as follows:
- Clearwater Paper Corporation
- DS Smith PLC
- Packaging Corp. of America
- Amcor Limited
- Cascades Inc.
1. Pediculosis Treatment Market Overview
2. Pediculosis Treatment Market- Executive Summary
3. Pediculosis Treatment Market Landscape
3.1. Market Share Analysis
3.2. Competitive analysis
3.2.1. Product Benchmarking
3.2.2. End-User Profiling
3.2.3. Patent analysis
3.2.4. Top 5 Financials Analysis
4. Pediculosis Treatment Market Forces
4.1. Market Drivers
4.2. Market Constraints
4.3. Market Challenges
4.4. Attractiveness of the Global Pediculosis Treatment Industry
4.4.1. Power of Suppliers
4.4.2. Power of Customers
4.4.3. Threat of New entrants
4.4.4. Threat of Substitution
4.4.5. Degree of Competition
5. Pediculosis Treatment Market- Strategic Analysis
5.1. Value Chain Analysis
5.2. Pricing Analysis
5.3. Opportunity Analysis
5.4. Product/Market Life Cycle
5.5. Suppliers and Distributors
6. Pediculosis Treatment Market - By Louse Type
6.1. Introduction
6.2. Pediculosis Capitis
6.3. Pediculosis Pubis
6.4. Pediculosis Corporis
7. Pediculosis Treatment Market - By Treatment
7.1. Introduction
7.2. Dimeticone Lotion
7.3. Malathion + Dimeticone Lotion
7.4. Isopropyl Alcohol
7.5. Suffocation-Based Pediculicide
7.6. Petrolatum
7.7. Mercuric Oxide Ointment
7.8. Others
8. Pediculosis Treatment Market- By Geography
8.1. Introduction
8.2. North America
8.2.1. U.S.
8.2.2. Canada
8.2.3. Mexico
8.3. Europe
8.3.1. U.K.
8.3.2. France
8.3.3. Germany
8.3.4. Italy
8.3.5. Spain
8.3.6. Russia
8.3.7. Rest of Europe
8.4. APAC
8.4.1. China
8.4.2. India
8.4.3. Japan
8.4.4. South Korea
8.4.5. Rest of APAC
8.5. RoW
8.5.1. Middle East
8.5.2. Africa
8.5.3. South America
9. Pediculosis Treatment Market Entropy
10. Pediculosis Treatment Market - Company Profiles
10.1. TyraTech Inc. (U.S.)
10.2. Tec Laboratories Inc. (U.S.)
10.3. Arbor Pharmaceuticals LLC (U.S.)
10.4. Logic Product Group (U.S.)
10.5. Major Pharmaceuticals (U.S.)
10.6. ParaPRO LLC (U.S.)
10.7. Prestige Brands, Inc. (U.S.)
10.8. Bayer AG (Germany)
10.9. Thornton & Ross Limited (U.K.)
10.10. Lavipharm (Greece)
*More than 40 Companies are profiled in this Research Report, Complete List available on Request*
"*Financials would be provided on a best efforts basis for private companies"
11. Appendix
11.1. Abbreviations
11.2. Sources
11.3. Research Methodology
11.4. Bibliography
11.5. Compilation of Expert Insights
11.6. Disclaimer
List of Tables
Table 1: Pediculosis Treatment Market Overview 2023-2030
Table 2: Pediculosis Treatment Market Leader Analysis 2023-2030 (US$)
Table 3: Pediculosis Treatment MarketProduct Analysis 2023-2030 (US$)
Table 4: Pediculosis Treatment MarketEnd User Analysis 2023-2030 (US$)
Table 5: Pediculosis Treatment MarketPatent Analysis 2013-2023* (US$)
Table 6: Pediculosis Treatment MarketFinancial Analysis 2023-2030 (US$)
Table 7: Pediculosis Treatment Market Driver Analysis 2023-2030 (US$)
Table 8: Pediculosis Treatment MarketChallenges Analysis 2023-2030 (US$)
Table 9: Pediculosis Treatment MarketConstraint Analysis 2023-2030 (US$)
Table 10: Pediculosis Treatment Market Supplier Bargaining Power Analysis 2023-2030 (US$)
Table 11: Pediculosis Treatment Market Buyer Bargaining Power Analysis 2023-2030 (US$)
Table 12: Pediculosis Treatment Market Threat of Substitutes Analysis 2023-2030 (US$)
Table 13: Pediculosis Treatment Market Threat of New Entrants Analysis 2023-2030 (US$)
Table 14: Pediculosis Treatment Market Degree of Competition Analysis 2023-2030 (US$)
Table 15: Pediculosis Treatment MarketValue Chain Analysis 2023-2030 (US$)
Table 16: Pediculosis Treatment MarketPricing Analysis 2023-2030 (US$)
Table 17: Pediculosis Treatment MarketOpportunities Analysis 2023-2030 (US$)
Table 18: Pediculosis Treatment MarketProduct Life Cycle Analysis 2023-2030 (US$)
Table 19: Pediculosis Treatment MarketSupplier Analysis 2023-2030 (US$)
Table 20: Pediculosis Treatment MarketDistributor Analysis 2023-2030 (US$)
Table 21: Pediculosis Treatment Market Trend Analysis 2023-2030 (US$)
Table 22: Pediculosis Treatment Market Size 2023 (US$)
Table 23: Pediculosis Treatment Market Forecast Analysis 2023-2030 (US$)
Table 24: Pediculosis Treatment Market Sales Forecast Analysis 2023-2030 (Units)
Table 25: Pediculosis Treatment Market, Revenue & Volume,By Louse Type, 2023-2030 ($)
Table 26: Pediculosis Treatment MarketBy Louse Type, Revenue & Volume,By Pediculosis Capitis, 2023-2030 ($)
Table 27: Pediculosis Treatment MarketBy Louse Type, Revenue & Volume,By Pediculosis Pubis, 2023-2030 ($)
Table 28: Pediculosis Treatment MarketBy Louse Type, Revenue & Volume,By Pediculosis Corporis, 2023-2030 ($)
Table 29: Pediculosis Treatment Market, Revenue & Volume,By Treatment, 2023-2030 ($)
Table 30: Pediculosis Treatment MarketBy Treatment, Revenue & Volume,By Dimeticone Lotion, 2023-2030 ($)
Table 31: Pediculosis Treatment MarketBy Treatment, Revenue & Volume,By Malathion + Dimeticone Lotion, 2023-2030 ($)
Table 32: Pediculosis Treatment MarketBy Treatment, Revenue & Volume,By Isopropyl Alcohol, 2023-2030 ($)
Table 33: Pediculosis Treatment MarketBy Treatment, Revenue & Volume,By Suffocation-Based Pediculicide, 2023-2030 ($)
Table 34: Pediculosis Treatment MarketBy Treatment, Revenue & Volume,By Petrolatum, 2023-2030 ($)
Table 35: North America Pediculosis Treatment Market, Revenue & Volume,By Louse Type, 2023-2030 ($)
Table 36: North America Pediculosis Treatment Market, Revenue & Volume,By Treatment, 2023-2030 ($)
Table 37: South america Pediculosis Treatment Market, Revenue & Volume,By Louse Type, 2023-2030 ($)
Table 38: South america Pediculosis Treatment Market, Revenue & Volume,By Treatment, 2023-2030 ($)
Table 39: Europe Pediculosis Treatment Market, Revenue & Volume,By Louse Type, 2023-2030 ($)
Table 40: Europe Pediculosis Treatment Market, Revenue & Volume,By Treatment, 2023-2030 ($)
Table 41: APAC Pediculosis Treatment Market, Revenue & Volume,By Louse Type, 2023-2030 ($)
Table 42: APAC Pediculosis Treatment Market, Revenue & Volume,By Treatment, 2023-2030 ($)
Table 43: Middle East & Africa Pediculosis Treatment Market, Revenue & Volume,By Louse Type, 2023-2030 ($)
Table 44: Middle East & Africa Pediculosis Treatment Market, Revenue & Volume,By Treatment, 2023-2030 ($)
Table 45: Russia Pediculosis Treatment Market, Revenue & Volume,By Louse Type, 2023-2030 ($)
Table 46: Russia Pediculosis Treatment Market, Revenue & Volume,By Treatment, 2023-2030 ($)
Table 47: Israel Pediculosis Treatment Market, Revenue & Volume,By Louse Type, 2023-2030 ($)
Table 48: Israel Pediculosis Treatment Market, Revenue & Volume,By Treatment, 2023-2030 ($)
Table 49: Top Companies 2023 (US$)Pediculosis Treatment Market, Revenue & Volume,,
Table 50: Product Launch 2023-2030Pediculosis Treatment Market, Revenue & Volume,,
Table 51: Mergers & Acquistions 2023-2030Pediculosis Treatment Market, Revenue & Volume,,
List of Figures
Figure 1: Overview of Pediculosis Treatment Market 2023-2030
Figure 2: Market Share Analysis for Pediculosis Treatment Market 2023 (US$)
Figure 3: Product Comparison in Pediculosis Treatment Market 2023-2030 (US$)
Figure 4: End User Profile for Pediculosis Treatment Market 2023-2030 (US$)
Figure 5: Patent Application and Grant in Pediculosis Treatment Market 2013-2023* (US$)
Figure 6: Top 5 Companies Financial Analysis in Pediculosis Treatment Market 2023-2030 (US$)
Figure 7: Market Entry Strategy in Pediculosis Treatment Market 2023-2030
Figure 8: Ecosystem Analysis in Pediculosis Treatment Market2023
Figure 9: Average Selling Price in Pediculosis Treatment Market 2023-2030
Figure 10: Top Opportunites in Pediculosis Treatment Market 2023-2030
Figure 11: Market Life Cycle Analysis in Pediculosis Treatment Market
Figure 12: GlobalBy Louse TypePediculosis Treatment Market Revenue, 2023-2030 ($)
Figure 13: GlobalBy TreatmentPediculosis Treatment Market Revenue, 2023-2030 ($)
Figure 14: Global Pediculosis Treatment Market - By Geography
Figure 15: Global Pediculosis Treatment Market Value & Volume, By Geography, 2023-2030 ($)
Figure 16: Global Pediculosis Treatment Market CAGR, By Geography, 2023-2030 (%)
Figure 17: North America Pediculosis Treatment Market Value & Volume, 2023-2030 ($)
Figure 18: US Pediculosis Treatment Market Value & Volume, 2023-2030 ($)
Figure 19: US GDP and Population, 2023-2030 ($)
Figure 20: US GDP – Composition of 2023, By Sector of Origin
Figure 21: US Export and Import Value & Volume, 2023-2030 ($)
Figure 22: Canada Pediculosis Treatment Market Value & Volume, 2023-2030 ($)
Figure 23: Canada GDP and Population, 2023-2030 ($)
Figure 24: Canada GDP – Composition of 2023, By Sector of Origin
Figure 25: Canada Export and Import Value & Volume, 2023-2030 ($)
Figure 26: Mexico Pediculosis Treatment Market Value & Volume, 2023-2030 ($)
Figure 27: Mexico GDP and Population, 2023-2030 ($)
Figure 28: Mexico GDP – Composition of 2023, By Sector of Origin
Figure 29: Mexico Export and Import Value & Volume, 2023-2030 ($)
Figure 30: South America Pediculosis Treatment MarketSouth America 3D Printing Market Value & Volume, 2023-2030 ($)
Figure 31: Brazil Pediculosis Treatment Market Value & Volume, 2023-2030 ($)
Figure 32: Brazil GDP and Population, 2023-2030 ($)
Figure 33: Brazil GDP – Composition of 2023, By Sector of Origin
Figure 34: Brazil Export and Import Value & Volume, 2023-2030 ($)
Figure 35: Venezuela Pediculosis Treatment Market Value & Volume, 2023-2030 ($)
Figure 36: Venezuela GDP and Population, 2023-2030 ($)
Figure 37: Venezuela GDP – Composition of 2023, By Sector of Origin
Figure 38: Venezuela Export and Import Value & Volume, 2023-2030 ($)
Figure 39: Argentina Pediculosis Treatment Market Value & Volume, 2023-2030 ($)
Figure 40: Argentina GDP and Population, 2023-2030 ($)
Figure 41: Argentina GDP – Composition of 2023, By Sector of Origin
Figure 42: Argentina Export and Import Value & Volume, 2023-2030 ($)
Figure 43: Ecuador Pediculosis Treatment Market Value & Volume, 2023-2030 ($)
Figure 44: Ecuador GDP and Population, 2023-2030 ($)
Figure 45: Ecuador GDP – Composition of 2023, By Sector of Origin
Figure 46: Ecuador Export and Import Value & Volume, 2023-2030 ($)
Figure 47: Peru Pediculosis Treatment Market Value & Volume, 2023-2030 ($)
Figure 48: Peru GDP and Population, 2023-2030 ($)
Figure 49: Peru GDP – Composition of 2023, By Sector of Origin
Figure 50: Peru Export and Import Value & Volume, 2023-2030 ($)
Figure 51: Colombia Pediculosis Treatment Market Value & Volume, 2023-2030 ($)
Figure 52: Colombia GDP and Population, 2023-2030 ($)
Figure 53: Colombia GDP – Composition of 2023, By Sector of Origin
Figure 54: Colombia Export and Import Value & Volume, 2023-2030 ($)
Figure 55: Costa Rica Pediculosis Treatment MarketCosta Rica 3D Printing Market Value & Volume, 2023-2030 ($)
Figure 56: Costa Rica GDP and Population, 2023-2030 ($)
Figure 57: Costa Rica GDP – Composition of 2023, By Sector of Origin
Figure 58: Costa Rica Export and Import Value & Volume, 2023-2030 ($)
Figure 59: Europe Pediculosis Treatment Market Value & Volume, 2023-2030 ($)
Figure 60: U.K Pediculosis Treatment Market Value & Volume, 2023-2030 ($)
Figure 61: U.K GDP and Population, 2023-2030 ($)
Figure 62: U.K GDP – Composition of 2023, By Sector of Origin
Figure 63: U.K Export and Import Value & Volume, 2023-2030 ($)
Figure 64: Germany Pediculosis Treatment Market Value & Volume, 2023-2030 ($)
Figure 65: Germany GDP and Population, 2023-2030 ($)
Figure 66: Germany GDP – Composition of 2023, By Sector of Origin
Figure 67: Germany Export and Import Value & Volume, 2023-2030 ($)
Figure 68: Italy Pediculosis Treatment Market Value & Volume, 2023-2030 ($)
Figure 69: Italy GDP and Population, 2023-2030 ($)
Figure 70: Italy GDP – Composition of 2023, By Sector of Origin
Figure 71: Italy Export and Import Value & Volume, 2023-2030 ($)
Figure 72: France Pediculosis Treatment Market Value & Volume, 2023-2030 ($)
Figure 73: France GDP and Population, 2023-2030 ($)
Figure 74: France GDP – Composition of 2023, By Sector of Origin
Figure 75: France Export and Import Value & Volume, 2023-2030 ($)
Figure 76: Netherlands Pediculosis Treatment Market Value & Volume, 2023-2030 ($)
Figure 77: Netherlands GDP and Population, 2023-2030 ($)
Figure 78: Netherlands GDP – Composition of 2023, By Sector of Origin
Figure 79: Netherlands Export and Import Value & Volume, 2023-2030 ($)
Figure 80: Belgium Pediculosis Treatment Market Value & Volume, 2023-2030 ($)
Figure 81: Belgium GDP and Population, 2023-2030 ($)
Figure 82: Belgium GDP – Composition of 2023, By Sector of Origin
Figure 83: Belgium Export and Import Value & Volume, 2023-2030 ($)
Figure 84: Spain Pediculosis Treatment Market Value & Volume, 2023-2030 ($)
Figure 85: Spain GDP and Population, 2023-2030 ($)
Figure 86: Spain GDP – Composition of 2023, By Sector of Origin
Figure 87: Spain Export and Import Value & Volume, 2023-2030 ($)
Figure 88: Denmark Pediculosis Treatment Market Value & Volume, 2023-2030 ($)
Figure 89: Denmark GDP and Population, 2023-2030 ($)
Figure 90: Denmark GDP – Composition of 2023, By Sector of Origin
Figure 91: Denmark Export and Import Value & Volume, 2023-2030 ($)
Figure 92: APAC Pediculosis Treatment Market Value & Volume, 2023-2030 ($)
Figure 93: China Pediculosis Treatment MarketValue & Volume, 2023-2030
Figure 94: China GDP and Population, 2023-2030 ($)
Figure 95: China GDP – Composition of 2023, By Sector of Origin
Figure 96: China Export and Import Value & Volume, 2023-2030 ($)Pediculosis Treatment MarketChina Export and Import Value & Volume, 2023-2030 ($)
Figure 97: Australia Pediculosis Treatment Market Value & Volume, 2023-2030 ($)
Figure 98: Australia GDP and Population, 2023-2030 ($)
Figure 99: Australia GDP – Composition of 2023, By Sector of Origin
Figure 100: Australia Export and Import Value & Volume, 2023-2030 ($)
Figure 101: South Korea Pediculosis Treatment Market Value & Volume, 2023-2030 ($)
Figure 102: South Korea GDP and Population, 2023-2030 ($)
Figure 103: South Korea GDP – Composition of 2023, By Sector of Origin
Figure 104: South Korea Export and Import Value & Volume, 2023-2030 ($)
Figure 105: India Pediculosis Treatment Market Value & Volume, 2023-2030 ($)
Figure 106: India GDP and Population, 2023-2030 ($)
Figure 107: India GDP – Composition of 2023, By Sector of Origin
Figure 108: India Export and Import Value & Volume, 2023-2030 ($)
Figure 109: Taiwan Pediculosis Treatment MarketTaiwan 3D Printing Market Value & Volume, 2023-2030 ($)
Figure 110: Taiwan GDP and Population, 2023-2030 ($)
Figure 111: Taiwan GDP – Composition of 2023, By Sector of Origin
Figure 112: Taiwan Export and Import Value & Volume, 2023-2030 ($)
Figure 113: Malaysia Pediculosis Treatment MarketMalaysia 3D Printing Market Value & Volume, 2023-2030 ($)
Figure 114: Malaysia GDP and Population, 2023-2030 ($)
Figure 115: Malaysia GDP – Composition of 2023, By Sector of Origin
Figure 116: Malaysia Export and Import Value & Volume, 2023-2030 ($)
Figure 117: Hong Kong Pediculosis Treatment MarketHong Kong 3D Printing Market Value & Volume, 2023-2030 ($)
Figure 118: Hong Kong GDP and Population, 2023-2030 ($)
Figure 119: Hong Kong GDP – Composition of 2023, By Sector of Origin
Figure 120: Hong Kong Export and Import Value & Volume, 2023-2030 ($)
Figure 121: Middle East & Africa Pediculosis Treatment MarketMiddle East & Africa 3D Printing Market Value & Volume, 2023-2030 ($)
Figure 122: Russia Pediculosis Treatment MarketRussia 3D Printing Market Value & Volume, 2023-2030 ($)
Figure 123: Russia GDP and Population, 2023-2030 ($)
Figure 124: Russia GDP – Composition of 2023, By Sector of Origin
Figure 125: Russia Export and Import Value & Volume, 2023-2030 ($)
Figure 126: Israel Pediculosis Treatment Market Value & Volume, 2023-2030 ($)
Figure 127: Israel GDP and Population, 2023-2030 ($)
Figure 128: Israel GDP – Composition of 2023, By Sector of Origin
Figure 129: Israel Export and Import Value & Volume, 2023-2030 ($)
Figure 130: Entropy Share, By Strategies, 2023-2030* (%)Pediculosis Treatment Market
Figure 131: Developments, 2023-2030*Pediculosis Treatment Market
Figure 132: Company 1 Pediculosis Treatment Market Net Revenue, By Years, 2023-2030* ($)
Figure 133: Company 1 Pediculosis Treatment Market Net Revenue Share, By Business segments, 2023 (%)
Figure 134: Company 1 Pediculosis Treatment Market Net Sales Share, By Geography, 2023 (%)
Figure 135: Company 2 Pediculosis Treatment Market Net Revenue, By Years, 2023-2030* ($)
Figure 136: Company 2 Pediculosis Treatment Market Net Revenue Share, By Business segments, 2023 (%)
Figure 137: Company 2 Pediculosis Treatment Market Net Sales Share, By Geography, 2023 (%)
Figure 138: Company 3Pediculosis Treatment Market Net Revenue, By Years, 2023-2030* ($)
Figure 139: Company 3Pediculosis Treatment Market Net Revenue Share, By Business segments, 2023 (%)
Figure 140: Company 3Pediculosis Treatment Market Net Sales Share, By Geography, 2023 (%)
Figure 141: Company 4 Pediculosis Treatment Market Net Revenue, By Years, 2023-2030* ($)
Figure 142: Company 4 Pediculosis Treatment Market Net Revenue Share, By Business segments, 2023 (%)
Figure 143: Company 4 Pediculosis Treatment Market Net Sales Share, By Geography, 2023 (%)
Figure 144: Company 5 Pediculosis Treatment Market Net Revenue, By Years, 2023-2030* ($)
Figure 145: Company 5 Pediculosis Treatment Market Net Revenue Share, By Business segments, 2023 (%)
Figure 146: Company 5 Pediculosis Treatment Market Net Sales Share, By Geography, 2023 (%)
Figure 147: Company 6 Pediculosis Treatment Market Net Revenue, By Years, 2023-2030* ($)
Figure 148: Company 6 Pediculosis Treatment Market Net Revenue Share, By Business segments, 2023 (%)
Figure 149: Company 6 Pediculosis Treatment Market Net Sales Share, By Geography, 2023 (%)
Figure 150: Company 7 Pediculosis Treatment Market Net Revenue, By Years, 2023-2030* ($)
Figure 151: Company 7 Pediculosis Treatment Market Net Revenue Share, By Business segments, 2023 (%)
Figure 152: Company 7 Pediculosis Treatment Market Net Sales Share, By Geography, 2023 (%)
Figure 153: Company 8 Pediculosis Treatment Market Net Revenue, By Years, 2023-2030* ($)
Figure 154: Company 8 Pediculosis Treatment Market Net Revenue Share, By Business segments, 2023 (%)
Figure 155: Company 8 Pediculosis Treatment Market Net Sales Share, By Geography, 2023 (%)
Figure 156: Company 9 Pediculosis Treatment Market Net Revenue, By Years, 2023-2030* ($)
Figure 157: Company 9 Pediculosis Treatment Market Net Revenue Share, By Business segments, 2023 (%)
Figure 158: Company 9 Pediculosis Treatment Market Net Sales Share, By Geography, 2023 (%)
Figure 159: Company 10 Pediculosis Treatment Market Net Revenue, By Years, 2023-2030* ($)
Figure 160: Company 10 Pediculosis Treatment Market Net Revenue Share, By Business segments, 2023 (%)
Figure 161: Company 10 Pediculosis Treatment Market Net Sales Share, By Geography, 2023 (%)
Figure 162: Company 11 Pediculosis Treatment Market Net Revenue, By Years, 2023-2030* ($)
Figure 163: Company 11 Pediculosis Treatment Market Net Revenue Share, By Business segments, 2023 (%)
Figure 164: Company 11 Pediculosis Treatment Market Net Sales Share, By Geography, 2023 (%)
Figure 165: Company 12 Pediculosis Treatment Market Net Revenue, By Years, 2023-2030* ($)
Figure 166: Company 12 Pediculosis Treatment Market Net Revenue Share, By Business segments, 2023 (%)
Figure 167: Company 12 Pediculosis Treatment Market Net Sales Share, By Geography, 2023 (%)
Figure 168: Company 13Pediculosis Treatment Market Net Revenue, By Years, 2023-2030* ($)
Figure 169: Company 13Pediculosis Treatment Market Net Revenue Share, By Business segments, 2023 (%)
Figure 170: Company 13Pediculosis Treatment Market Net Sales Share, By Geography, 2023 (%)
Figure 171: Company 14 Pediculosis Treatment Market Net Revenue, By Years, 2023-2030* ($)
Figure 172: Company 14 Pediculosis Treatment Market Net Revenue Share, By Business segments, 2023 (%)
Figure 173: Company 14 Pediculosis Treatment Market Net Sales Share, By Geography, 2023 (%)
Figure 174: Company 15 Pediculosis Treatment Market Net Revenue, By Years, 2023-2030* ($)
Figure 175: Company 15 Pediculosis Treatment Market Net Revenue Share, By Business segments, 2023 (%)
Figure 176: Company 15 Pediculosis Treatment Market Net Sales Share, By Geography, 2023 (%)