 Email
Email Print
Print


Primary Progressive Multiple Sclerosis Market - Forecast(2024 - 2030)
Primary progressive multiple sclerosis (PPMS) is type of multiple sclerosis (MS) disease which affects nervous system by causing inflammation. Multiple sclerosis is also referred as disseminated sclerosis. Such diseases causes damages to the nervous system and affects its communication and causes other problems, which includes various other mental, physical and psychiatric problems. Under primary progressive multiple sclerosis (PPMS)] neurological functions are steadily deteriorated with minimal distinct relapses (exacerbations and attacks) or the fixed period remissions. The progression rates of PPMS may vary from person to person and over the timeframes, which may show the signs of transitory improvements, however, the progression of disease remains persistent. Currently increasing population with MS is driving the PPMS market and is expected to continue during the period of study. However, higher R&D cost involved to develop new drugs and treatments is expected to be the key constraint for PPMS over the period of study.
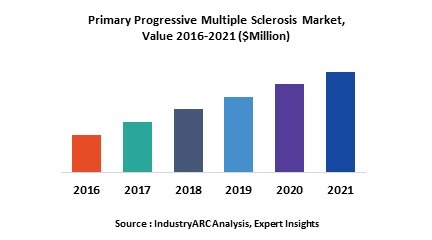
This report identifies the global primary progressive multiple sclerosis market size in for the year 2014-2016, and forecast of the same for year 2021. It also highlights the potential growth opportunities in the coming years, while also reviewing the market drivers, restraints, growth indicators, challenges, market dynamics, competitive landscape, and other key aspects with respect to primary progressive multiple sclerosis market.
Geographically, North America dominated the primary progressive multiple sclerosis market due to higher awareness about the diseases amongst citizens coupled with advanced and well developed healthcare infrastructure with easy accessibility to each of the citizens. North America was followed by Europe and Asia-Pacific as the second and third largest markets for primary progressive multiple sclerosis. Asia Pacific is projected to have the fastest growth, owing to rapidly growing healthcare infrastructure in the major developing economies such as India and China along with rising aware amongst practitioners and people in the region.
This report segments primary progressive multiple sclerosis market on the basis of diagnosis type, treatment centre and regional market as follows:
This report identifies all the major companies operating in the primary progressive multiple sclerosis market. Some of the major companies’ profiles in detail are as follows:
This report identifies the global primary progressive multiple sclerosis market size in for the year 2014-2016, and forecast of the same for year 2021. It also highlights the potential growth opportunities in the coming years, while also reviewing the market drivers, restraints, growth indicators, challenges, market dynamics, competitive landscape, and other key aspects with respect to primary progressive multiple sclerosis market.
Geographically, North America dominated the primary progressive multiple sclerosis market due to higher awareness about the diseases amongst citizens coupled with advanced and well developed healthcare infrastructure with easy accessibility to each of the citizens. North America was followed by Europe and Asia-Pacific as the second and third largest markets for primary progressive multiple sclerosis. Asia Pacific is projected to have the fastest growth, owing to rapidly growing healthcare infrastructure in the major developing economies such as India and China along with rising aware amongst practitioners and people in the region.
This report segments primary progressive multiple sclerosis market on the basis of diagnosis type, treatment centre and regional market as follows:
- This report on primary progressive multiple sclerosis market is segment on the basis of diagnosis type covering three major diagnosis types as follows: Magnetic Resonance Imaging (MRI) Scans, Simple electrical stimulation tests, Lumbar puncture
- On the basis of treatment centre, this report on primary progressive multiple sclerosis market is segmented into three major segments as follows:, Hospital testing (Commercial/private hospitals, Public health hospitals, Symptomatic diagnostic testing with medications), Clinics, Home Treatment (Managing symptoms, Rehabilitation, Healthy living)
- This report on primary progressive multiple sclerosis has been further segmented into major regions, which includes detailed analysis of each region such as: North America, Europe, Asia-Pacific (APAC), and Rest of the World (RoW) covering all the major country level markets in each of the region
This report identifies all the major companies operating in the primary progressive multiple sclerosis market. Some of the major companies’ profiles in detail are as follows:
- F. Hoffmann-La Roche Ltd.
- Innate Immunotherapeutics Limited
- Biogen Idec
- Teva Pharmaceuticals
- Bayer Healthcare
1. Primary Progressive Multiple Sclerosis Market - Overview
1.1. Definitions and Scope
2. Primary Progressive Multiple Sclerosis Market - Executive summary
2.1. Market Revenue, Market Size and Key Trends by Company
2.2. Key Trends by type of Application
2.3. Key Trends segmented by Geography
3. Primary Progressive Multiple Sclerosis Market
3.1. Comparative analysis
3.1.1. Product Benchmarking - Top 10 companies
3.1.2. Top 5 Financials Analysis
3.1.3. Market Value split by Top 10 companies
3.1.4. Patent Analysis - Top 10 companies
3.1.5. Pricing Analysis
4. Primary Progressive Multiple Sclerosis Market – Startup companies Scenario Premium
4.1. Top 10 startup company Analysis by
4.1.1. Investment
4.1.2. Revenue
4.1.3. Market Shares
4.1.4. Market Size and Application Analysis
4.1.5. Venture Capital and Funding Scenario
5. Primary Progressive Multiple Sclerosis Market – Industry Market Entry Scenario Premium
5.1. Regulatory Framework Overview
5.2. New Business and Ease of Doing business index
5.3. Case studies of successful ventures
5.4. Customer Analysis – Top 10 companies
6. Primary Progressive Multiple Sclerosis Market Forces
6.1. Drivers
6.2. Constraints
6.3. Challenges
6.4. Porters five force model
6.4.1. Bargaining power of suppliers
6.4.2. Bargaining powers of customers
6.4.3. Threat of new entrants
6.4.4. Rivalry among existing players
6.4.5. Threat of substitutes
7. Primary Progressive Multiple Sclerosis Market -Strategic analysis
7.1. Value chain analysis
7.2. Opportunities analysis
7.3. Product life cycle
7.4. Suppliers and distributors Market Share
8. Primary Progressive Multiple Sclerosis Market – By Diagnosis Type (Market Size -$Million / $Billion)
8.1. Market Size and Market Share Analysis
8.2. Application Revenue and Trend Research
8.3. Product Segment Analysis
8.3.1. Magnetic Resonance Imaging (MRI) Scans
8.3.2. Simple electrical stimulation tests
8.3.3. Lumbar puncture
9. Primary Progressive Multiple Sclerosis Market – By Treatment Centre (Market Size -$Million / $Billion)
9.1. Hospital testing
9.1.1. Commercial/private hospitals
9.1.2. Public health hospitals
9.1.3. Symptomatic diagnostic testing with medications
9.2. Clinics
9.3. Home Treatment
9.3.1. Managing symptoms
9.3.2. Rehabilitation
9.3.3. Healthy living
10. Primary Progressive Multiple Sclerosis – By End Use Industry(Market Size -$Million / $Billion)
10.1. Segment type Size and Market Share Analysis
10.2. Application Revenue and Trends by type of Application
10.3. Application Segment Analysis by Type
10.3.1. App
10.3.2. App
10.3.3. App
10.3.4. App
10.3.5. App
10.3.6. App
10.3.7. App
11. Primary Progressive Multiple Sclerosis - By Geography (Market Size -$Million / $Billion)
11.1. Primary Progressive Multiple Sclerosis Market - North America Segment Research
11.2. North America Market Research (Million / $Billion)
11.2.1. Segment type Size and Market Size Analysis
11.2.2. Revenue and Trends
11.2.3. Application Revenue and Trends by type of Application
11.2.4. Company Revenue and Product Analysis
11.2.5. North America Product type and Application Market Size
11.2.5.1. U.S.
11.2.5.2. Canada
11.2.5.3. Mexico
11.2.5.4. Rest of North America
11.3. Primary Progressive Multiple Sclerosis - South America Segment Research
11.4. South America Market Research (Market Size -$Million / $Billion)
11.4.1. Segment type Size and Market Size Analysis
11.4.2. Revenue and Trends
11.4.3. Application Revenue and Trends by type of Application
11.4.4. Company Revenue and Product Analysis
11.4.5. South America Product type and Application Market Size
11.4.5.1. Brazil
11.4.5.2. Venezuela
11.4.5.3. Argentina
11.4.5.4. Ecuador
11.4.5.5. Peru
11.4.5.6. Colombia
11.4.5.7. Costa Rica
11.4.5.8. Rest of South America
11.5. Primary Progressive Multiple Sclerosis - Europe Segment Research
11.6. Europe Market Research (Market Size -$Million / $Billion)
11.6.1. Segment type Size and Market Size Analysis
11.6.2. Revenue and Trends
11.6.3. Application Revenue and Trends by type of Application
11.6.4. Company Revenue and Product Analysis
11.6.5. Europe Segment Product type and Application Market Size
11.6.5.1. U.K
11.6.5.2. Germany
11.6.5.3. Italy
11.6.5.4. France
11.6.5.5. Netherlands
11.6.5.6. Belgium
11.6.5.7. Spain
11.6.5.8. Denmark
11.6.5.9. Rest of Europe
11.7. Primary Progressive Multiple Sclerosis – APAC Segment Research
11.8. APAC Market Research (Market Size -$Million / $Billion)
11.8.1. Segment type Size and Market Size Analysis
11.8.2. Revenue and Trends
11.8.3. Application Revenue and Trends by type of Application
11.8.4. Company Revenue and Product Analysis
11.8.5. APAC Segment – Product type and Application Market Size
11.8.5.1. China
11.8.5.2. Australia
11.8.5.3. Japan
11.8.5.4. South Korea
11.8.5.5. India
11.8.5.6. Taiwan
11.8.5.7. Malaysia
12. Primary Progressive Multiple Sclerosis Market - Entropy
12.1. New product launches
12.2. M&A's, collaborations, JVs and partnerships
13. Primary Progressive Multiple Sclerosis Market – Industry / Segment Competition landscape Premium
13.1. Market Share Analysis
13.1.1. Market Share by Country- Top companies
13.1.2. Market Share by Region- Top 10 companies
13.1.3. Market Share by type of Application – Top 10 companies
13.1.4. Market Share by type of Product / Product category- Top 10 companies
13.1.5. Market Share at global level- Top 10 companies
13.1.6. Best Practises for companies
14. Primary Progressive Multiple Sclerosis Market – Key Company List by Country Premium
15. Primary Progressive Multiple Sclerosis Market Company Analysis
15.1. Market Share, Company Revenue, Products, M&A, Developments
15.2. F. Hoffmann-La Roche Ltd.
15.3. Innate Immunotherapeutics Limited
15.4. Biogen Idec
15.5. Teva Pharmaceuticals
15.6. Bayer Healthcare
15.7. Pfizer Inc.
15.8. Sanofi-Aventis
15.9. Merck
15.10. Novartis.
15.11. Company 10
15.12. Company 11
15.13. Company 12 and more
"*Financials would be provided on a best efforts basis for private companies"
16. Primary Progressive Multiple Sclerosis Market -Appendix
16.1. Abbreviations
16.2. Sources
17. Primary Progressive Multiple Sclerosis Market -Methodology Premium
17.1. Research Methodology
17.1.1. Company Expert Interviews
17.1.2. Industry Databases
17.1.3. Associations
17.1.4. Company News
17.1.5. Company Annual Reports
17.1.6. Application Trends
17.1.7. New Products and Product database
17.1.8. Company Transcripts
17.1.9. R&D Trends
17.1.10. Key Opinion Leaders Interviews
17.1.11. Supply and Demand Trends
List of Tables:
Table 1: Primary Progressive Multiple Sclerosis Market Overview 2023-2030
Table 2: Primary Progressive Multiple Sclerosis Market Leader Analysis 2023-2030 (US$)
Table 3: Primary Progressive Multiple Sclerosis Market Product Analysis 2023-2030 (US$)
Table 4: Primary Progressive Multiple Sclerosis Market End User Analysis 2023-2030 (US$)
Table 5: Primary Progressive Multiple Sclerosis Market Patent Analysis 2013-2023* (US$)
Table 6: Primary Progressive Multiple Sclerosis Market Financial Analysis 2023-2030 (US$)
Table 7: Primary Progressive Multiple Sclerosis Market Driver Analysis 2023-2030 (US$)
Table 8: Primary Progressive Multiple Sclerosis Market Challenges Analysis 2023-2030 (US$)
Table 9: Primary Progressive Multiple Sclerosis Market Constraint Analysis 2023-2030 (US$)
Table 10: Primary Progressive Multiple Sclerosis Market Supplier Bargaining Power Analysis 2023-2030 (US$)
Table 11: Primary Progressive Multiple Sclerosis Market Buyer Bargaining Power Analysis 2023-2030 (US$)
Table 12: Primary Progressive Multiple Sclerosis Market Threat of Substitutes Analysis 2023-2030 (US$)
Table 13: Primary Progressive Multiple Sclerosis Market Threat of New Entrants Analysis 2023-2030 (US$)
Table 14: Primary Progressive Multiple Sclerosis Market Degree of Competition Analysis 2023-2030 (US$)
Table 15: Primary Progressive Multiple Sclerosis Market Value Chain Analysis 2023-2030 (US$)
Table 16: Primary Progressive Multiple Sclerosis Market Pricing Analysis 2023-2030 (US$)
Table 17: Primary Progressive Multiple Sclerosis Market Opportunities Analysis 2023-2030 (US$)
Table 18: Primary Progressive Multiple Sclerosis Market Product Life Cycle Analysis 2023-2030 (US$)
Table 19: Primary Progressive Multiple Sclerosis Market Supplier Analysis 2023-2030 (US$)
Table 20: Primary Progressive Multiple Sclerosis Market Distributor Analysis 2023-2030 (US$)
Table 21: Primary Progressive Multiple Sclerosis Market Trend Analysis 2023-2030 (US$)
Table 22: Primary Progressive Multiple Sclerosis Market Size 2023 (US$)
Table 23: Primary Progressive Multiple Sclerosis Market Forecast Analysis 2023-2030 (US$)
Table 24: Primary Progressive Multiple Sclerosis Market Sales Forecast Analysis 2023-2030 (Units)
Table 25: Primary Progressive Multiple Sclerosis Market, Revenue & Volume, By Type, 2023-2030 ($)
Table 26: Primary Progressive Multiple Sclerosis Market By Type, Revenue & Volume, By Magnetic Resonance Imaging (MRI) Scans, 2023-2030 ($)
Table 27: Primary Progressive Multiple Sclerosis Market By Type, Revenue & Volume, By Simple electrical stimulation tests, 2023-2030 ($)
Table 28: Primary Progressive Multiple Sclerosis Market By Type, Revenue & Volume, By Lumbar puncture, 2023-2030 ($)
Table 29: Primary Progressive Multiple Sclerosis Market, Revenue & Volume, By Treatment Centre, 2023-2030 ($)
Table 30: Primary Progressive Multiple Sclerosis Market By Treatment Centre, Revenue & Volume, By Hospital testing, 2023-2030 ($)
Table 31: Primary Progressive Multiple Sclerosis Market By Treatment Centre, Revenue & Volume, By Commercial/private hospitals, 2023-2030 ($)
Table 32: Primary Progressive Multiple Sclerosis Market By Treatment Centre, Revenue & Volume, By Clinics, 2023-2030 ($)
Table 33: Primary Progressive Multiple Sclerosis Market By Treatment Centre, Revenue & Volume, By Home Treatment, 2023-2030 ($)
Table 34: Primary Progressive Multiple Sclerosis Market By Treatment Centre, Revenue & Volume, By Managing symptoms, 2023-2030 ($)
Table 35: North America Primary Progressive Multiple Sclerosis Market, Revenue & Volume, By Type, 2023-2030 ($)
Table 36: North America Primary Progressive Multiple Sclerosis Market, Revenue & Volume, By Treatment Centre, 2023-2030 ($)
Table 37: South america Primary Progressive Multiple Sclerosis Market, Revenue & Volume, By Type, 2023-2030 ($)
Table 38: South america Primary Progressive Multiple Sclerosis Market, Revenue & Volume, By Treatment Centre, 2023-2030 ($)
Table 39: Europe Primary Progressive Multiple Sclerosis Market, Revenue & Volume, By Type, 2023-2030 ($)
Table 40: Europe Primary Progressive Multiple Sclerosis Market, Revenue & Volume, By Treatment Centre, 2023-2030 ($)
Table 41: APAC Primary Progressive Multiple Sclerosis Market, Revenue & Volume, By Type, 2023-2030 ($)
Table 42: APAC Primary Progressive Multiple Sclerosis Market, Revenue & Volume, By Treatment Centre, 2023-2030 ($)
Table 43: Middle East & Africa Primary Progressive Multiple Sclerosis Market, Revenue & Volume, By Type, 2023-2030 ($)
Table 44: Middle East & Africa Primary Progressive Multiple Sclerosis Market, Revenue & Volume, By Treatment Centre, 2023-2030 ($)
Table 45: Russia Primary Progressive Multiple Sclerosis Market, Revenue & Volume, By Type, 2023-2030 ($)
Table 46: Russia Primary Progressive Multiple Sclerosis Market, Revenue & Volume, By Treatment Centre, 2023-2030 ($)
Table 47: Israel Primary Progressive Multiple Sclerosis Market, Revenue & Volume, By Type, 2023-2030 ($)
Table 48: Israel Primary Progressive Multiple Sclerosis Market, Revenue & Volume, By Treatment Centre, 2023-2030 ($)
Table 49: Top Companies 2023 (US$) Primary Progressive Multiple Sclerosis Market, Revenue & Volume
Table 50: Product Launch 2023-2030 Primary Progressive Multiple Sclerosis Market, Revenue & Volume
Table 51: Mergers & Acquistions 2023-2030 Primary Progressive Multiple Sclerosis Market, Revenue & Volume
List of Figures:
Figure 1: Overview of Primary Progressive Multiple Sclerosis Market 2023-2030
Figure 2: Market Share Analysis for Primary Progressive Multiple Sclerosis Market 2023 (US$)
Figure 3: Product Comparison in Primary Progressive Multiple Sclerosis Market 2023-2030 (US$)
Figure 4: End User Profile for Primary Progressive Multiple Sclerosis Market 2023-2030 (US$)
Figure 5: Patent Application and Grant in Primary Progressive Multiple Sclerosis Market 2013-2023* (US$)
Figure 6: Top 5 Companies Financial Analysis in Primary Progressive Multiple Sclerosis Market 2023-2030 (US$)
Figure 7: Market Entry Strategy in Primary Progressive Multiple Sclerosis Market 2023-2030
Figure 8: Ecosystem Analysis in Primary Progressive Multiple Sclerosis Market 2023
Figure 9: Average Selling Price in Primary Progressive Multiple Sclerosis Market 2023-2030
Figure 10: Top Opportunites in Primary Progressive Multiple Sclerosis Market 2023-2030
Figure 11: Market Life Cycle Analysis in Primary Progressive Multiple Sclerosis Market
Figure 12: GlobalBy TypePrimary Progressive Multiple Sclerosis Market Revenue, 2023-2030 ($)
Figure 13: GlobalBy Treatment CentrePrimary Progressive Multiple Sclerosis Market Revenue, 2023-2030 ($)
Figure 14: Global Primary Progressive Multiple Sclerosis Market - By Geography
Figure 15: Global Primary Progressive Multiple Sclerosis Market Value & Volume, By Geography, 2023-2030 ($)
Figure 16: Global Primary Progressive Multiple Sclerosis Market CAGR, By Geography, 2023-2030 (%)
Figure 17: North America Primary Progressive Multiple Sclerosis Market Value & Volume, 2023-2030 ($)
Figure 18: US Primary Progressive Multiple Sclerosis Market Value & Volume, 2023-2030 ($)
Figure 19: US GDP and Population, 2023-2030 ($)
Figure 20: US GDP – Composition of 2023, By Sector of Origin
Figure 21: US Export and Import Value & Volume, 2023-2030 ($)
Figure 22: Canada Primary Progressive Multiple Sclerosis Market Value & Volume, 2023-2030 ($)
Figure 23: Canada GDP and Population, 2023-2030 ($)
Figure 24: Canada GDP – Composition of 2023, By Sector of Origin
Figure 25: Canada Export and Import Value & Volume, 2023-2030 ($)
Figure 26: Mexico Primary Progressive Multiple Sclerosis Market Value & Volume, 2023-2030 ($)
Figure 27: Mexico GDP and Population, 2023-2030 ($)
Figure 28: Mexico GDP – Composition of 2023, By Sector of Origin
Figure 29: Mexico Export and Import Value & Volume, 2023-2030 ($)
Figure 30: South America Primary Progressive Multiple Sclerosis Market Value & Volume, 2023-2030 ($)
Figure 31: Brazil Primary Progressive Multiple Sclerosis Market Value & Volume, 2023-2030 ($)
Figure 32: Brazil GDP and Population, 2023-2030 ($)
Figure 33: Brazil GDP – Composition of 2023, By Sector of Origin
Figure 34: Brazil Export and Import Value & Volume, 2023-2030 ($)
Figure 35: Venezuela Primary Progressive Multiple Sclerosis Market Value & Volume, 2023-2030 ($)
Figure 36: Venezuela GDP and Population, 2023-2030 ($)
Figure 37: Venezuela GDP – Composition of 2023, By Sector of Origin
Figure 38: Venezuela Export and Import Value & Volume, 2023-2030 ($)
Figure 39: Argentina Primary Progressive Multiple Sclerosis Market Value & Volume, 2023-2030 ($)
Figure 40: Argentina GDP and Population, 2023-2030 ($)
Figure 41: Argentina GDP – Composition of 2023, By Sector of Origin
Figure 42: Argentina Export and Import Value & Volume, 2023-2030 ($)
Figure 43: Ecuador Primary Progressive Multiple Sclerosis Market Value & Volume, 2023-2030 ($)
Figure 44: Ecuador GDP and Population, 2023-2030 ($)
Figure 45: Ecuador GDP – Composition of 2023, By Sector of Origin
Figure 46: Ecuador Export and Import Value & Volume, 2023-2030 ($)
Figure 47: Peru Primary Progressive Multiple Sclerosis Market Value & Volume, 2023-2030 ($)
Figure 48: Peru GDP and Population, 2023-2030 ($)
Figure 49: Peru GDP – Composition of 2023, By Sector of Origin
Figure 50: Peru Export and Import Value & Volume, 2023-2030 ($)
Figure 51: Colombia Primary Progressive Multiple Sclerosis Market Value & Volume, 2023-2030 ($)
Figure 52: Colombia GDP and Population, 2023-2030 ($)
Figure 53: Colombia GDP – Composition of 2023, By Sector of Origin
Figure 54: Colombia Export and Import Value & Volume, 2023-2030 ($)
Figure 55: Costa Rica Primary Progressive Multiple Sclerosis Market Value & Volume, 2023-2030 ($)
Figure 56: Costa Rica GDP and Population, 2023-2030 ($)
Figure 57: Costa Rica GDP – Composition of 2023, By Sector of Origin
Figure 58: Costa Rica Export and Import Value & Volume, 2023-2030 ($)
Figure 59: Europe Primary Progressive Multiple Sclerosis Market Value & Volume, 2023-2030 ($)
Figure 60: U.K Primary Progressive Multiple Sclerosis Market Value & Volume, 2023-2030 ($)
Figure 61: U.K GDP and Population, 2023-2030 ($)
Figure 62: U.K GDP – Composition of 2023, By Sector of Origin
Figure 63: U.K Export and Import Value & Volume, 2023-2030 ($)
Figure 64: Germany Primary Progressive Multiple Sclerosis Market Value & Volume, 2023-2030 ($)
Figure 65: Germany GDP and Population, 2023-2030 ($)
Figure 66: Germany GDP – Composition of 2023, By Sector of Origin
Figure 67: Germany Export and Import Value & Volume, 2023-2030 ($)
Figure 68: Italy Primary Progressive Multiple Sclerosis Market Value & Volume, 2023-2030 ($)
Figure 69: Italy GDP and Population, 2023-2030 ($)
Figure 70: Italy GDP – Composition of 2023, By Sector of Origin
Figure 71: Italy Export and Import Value & Volume, 2023-2030 ($)
Figure 72: France Primary Progressive Multiple Sclerosis Market Value & Volume, 2023-2030 ($)
Figure 73: France GDP and Population, 2023-2030 ($)
Figure 74: France GDP – Composition of 2023, By Sector of Origin
Figure 75: France Export and Import Value & Volume, 2023-2030 ($)
Figure 76: Netherlands Primary Progressive Multiple Sclerosis Market Value & Volume, 2023-2030 ($)
Figure 77: Netherlands GDP and Population, 2023-2030 ($)
Figure 78: Netherlands GDP – Composition of 2023, By Sector of Origin
Figure 79: Netherlands Export and Import Value & Volume, 2023-2030 ($)
Figure 80: Belgium Primary Progressive Multiple Sclerosis Market Value & Volume, 2023-2030 ($)
Figure 81: Belgium GDP and Population, 2023-2030 ($)
Figure 82: Belgium GDP – Composition of 2023, By Sector of Origin
Figure 83: Belgium Export and Import Value & Volume, 2023-2030 ($)
Figure 84: Spain Primary Progressive Multiple Sclerosis Market Value & Volume, 2023-2030 ($)
Figure 85: Spain GDP and Population, 2023-2030 ($)
Figure 86: Spain GDP – Composition of 2023, By Sector of Origin
Figure 87: Spain Export and Import Value & Volume, 2023-2030 ($)
Figure 88: Denmark Primary Progressive Multiple Sclerosis Market Value & Volume, 2023-2030 ($)
Figure 89: Denmark GDP and Population, 2023-2030 ($)
Figure 90: Denmark GDP – Composition of 2023, By Sector of Origin
Figure 91: Denmark Export and Import Value & Volume, 2023-2030 ($)
Figure 92: APAC Primary Progressive Multiple Sclerosis Market Value & Volume, 2023-2030 ($)
Figure 93: China Primary Progressive Multiple Sclerosis Market Value & Volume, 2023-2030
Figure 94: China GDP and Population, 2023-2030 ($)
Figure 95: China GDP – Composition of 2023, By Sector of Origin
Figure 96: China Export and Import Value & Volume, 2023-2030 ($)Primary Progressive Multiple Sclerosis Market China Export and Import Value & Volume, 2023-2030 ($)
Figure 97: Australia Primary Progressive Multiple Sclerosis Market Value & Volume, 2023-2030 ($)
Figure 98: Australia GDP and Population, 2023-2030 ($)
Figure 99: Australia GDP – Composition of 2023, By Sector of Origin
Figure 100: Australia Export and Import Value & Volume, 2023-2030 ($)
Figure 101: South Korea Primary Progressive Multiple Sclerosis Market Value & Volume, 2023-2030 ($)
Figure 102: South Korea GDP and Population, 2023-2030 ($)
Figure 103: South Korea GDP – Composition of 2023, By Sector of Origin
Figure 104: South Korea Export and Import Value & Volume, 2023-2030 ($)
Figure 105: India Primary Progressive Multiple Sclerosis Market Value & Volume, 2023-2030 ($)
Figure 106: India GDP and Population, 2023-2030 ($)
Figure 107: India GDP – Composition of 2023, By Sector of Origin
Figure 108: India Export and Import Value & Volume, 2023-2030 ($)
Figure 109: Taiwan Primary Progressive Multiple Sclerosis Market Value & Volume, 2023-2030 ($)
Figure 110: Taiwan GDP and Population, 2023-2030 ($)
Figure 111: Taiwan GDP – Composition of 2023, By Sector of Origin
Figure 112: Taiwan Export and Import Value & Volume, 2023-2030 ($)
Figure 113: Malaysia Primary Progressive Multiple Sclerosis Market Value & Volume, 2023-2030 ($)
Figure 114: Malaysia GDP and Population, 2023-2030 ($)
Figure 115: Malaysia GDP – Composition of 2023, By Sector of Origin
Figure 116: Malaysia Export and Import Value & Volume, 2023-2030 ($)
Figure 117: Hong Kong Primary Progressive Multiple Sclerosis Market Value & Volume, 2023-2030 ($)
Figure 118: Hong Kong GDP and Population, 2023-2030 ($)
Figure 119: Hong Kong GDP – Composition of 2023, By Sector of Origin
Figure 120: Hong Kong Export and Import Value & Volume, 2023-2030 ($)
Figure 121: Middle East & Africa Primary Progressive Multiple Sclerosis Market Middle East & Africa 3D Printing Market Value & Volume, 2023-2030 ($)
Figure 122: Russia Primary Progressive Multiple Sclerosis Market Value & Volume, 2023-2030 ($)
Figure 123: Russia GDP and Population, 2023-2030 ($)
Figure 124: Russia GDP – Composition of 2023, By Sector of Origin
Figure 125: Russia Export and Import Value & Volume, 2023-2030 ($)
Figure 126: Israel Primary Progressive Multiple Sclerosis Market Value & Volume, 2023-2030 ($)
Figure 127: Israel GDP and Population, 2023-2030 ($)
Figure 128: Israel GDP – Composition of 2023, By Sector of Origin
Figure 129: Israel Export and Import Value & Volume, 2023-2030 ($)
Figure 130: Entropy Share, By Strategies, 2023-2030* (%)Primary Progressive Multiple Sclerosis Market
Figure 131: Developments, 2023-2030*Primary Progressive Multiple Sclerosis Market
Figure 132: Company 1 Primary Progressive Multiple Sclerosis Market Net Revenue, By Years, 2023-2030* ($)
Figure 133: Company 1 Primary Progressive Multiple Sclerosis Market Net Revenue Share, By Business segments, 2023 (%)
Figure 134: Company 1 Primary Progressive Multiple Sclerosis Market Net Sales Share, By Geography, 2023 (%)
Figure 135: Company 2 Primary Progressive Multiple Sclerosis Market Net Revenue, By Years, 2023-2030* ($)
Figure 136: Company 2 Primary Progressive Multiple Sclerosis Market Net Revenue Share, By Business segments, 2023 (%)
Figure 137: Company 2 Primary Progressive Multiple Sclerosis Market Net Sales Share, By Geography, 2023 (%)
Figure 138: Company 3 Primary Progressive Multiple Sclerosis Market Net Revenue, By Years, 2023-2030* ($)
Figure 139: Company 3 Primary Progressive Multiple Sclerosis Market Net Revenue Share, By Business segments, 2023 (%)
Figure 140: Company 3 Primary Progressive Multiple Sclerosis Market Net Sales Share, By Geography, 2023 (%)
Figure 141: Company 4 Primary Progressive Multiple Sclerosis Market Net Revenue, By Years, 2023-2030* ($)
Figure 142: Company 4 Primary Progressive Multiple Sclerosis Market Net Revenue Share, By Business segments, 2023 (%)
Figure 143: Company 4 Primary Progressive Multiple Sclerosis Market Net Sales Share, By Geography, 2023 (%)
Figure 144: Company 5 Primary Progressive Multiple Sclerosis Market Net Revenue, By Years, 2023-2030* ($)
Figure 145: Company 5 Primary Progressive Multiple Sclerosis Market Net Revenue Share, By Business segments, 2023 (%)
Figure 146: Company 5 Primary Progressive Multiple Sclerosis Market Net Sales Share, By Geography, 2023 (%)
Figure 147: Company 6 Primary Progressive Multiple Sclerosis Market Net Revenue, By Years, 2023-2030* ($)
Figure 148: Company 6 Primary Progressive Multiple Sclerosis Market Net Revenue Share, By Business segments, 2023 (%)
Figure 149: Company 6 Primary Progressive Multiple Sclerosis Market Net Sales Share, By Geography, 2023 (%)
Figure 150: Company 7 Primary Progressive Multiple Sclerosis Market Net Revenue, By Years, 2023-2030* ($)
Figure 151: Company 7 Primary Progressive Multiple Sclerosis Market Net Revenue Share, By Business segments, 2023 (%)
Figure 152: Company 7 Primary Progressive Multiple Sclerosis Market Net Sales Share, By Geography, 2023 (%)
Figure 153: Company 8 Primary Progressive Multiple Sclerosis Market Net Revenue, By Years, 2023-2030* ($)
Figure 154: Company 8 Primary Progressive Multiple Sclerosis Market Net Revenue Share, By Business segments, 2023 (%)
Figure 155: Company 8 Primary Progressive Multiple Sclerosis Market Net Sales Share, By Geography, 2023 (%)
Figure 156: Company 9 Primary Progressive Multiple Sclerosis Market Net Revenue, By Years, 2023-2030* ($)
Figure 157: Company 9 Primary Progressive Multiple Sclerosis Market Net Revenue Share, By Business segments, 2023 (%)
Figure 158: Company 9 Primary Progressive Multiple Sclerosis Market Net Sales Share, By Geography, 2023 (%)
Figure 159: Company 10 Primary Progressive Multiple Sclerosis Market Net Revenue, By Years, 2023-2030* ($)
Figure 160: Company 10 Primary Progressive Multiple Sclerosis Market Net Revenue Share, By Business segments, 2023 (%)
Figure 161: Company 10 Primary Progressive Multiple Sclerosis Market Net Sales Share, By Geography, 2023 (%)
Figure 162: Company 11 Primary Progressive Multiple Sclerosis Market Net Revenue, By Years, 2023-2030* ($)
Figure 163: Company 11 Primary Progressive Multiple Sclerosis Market Net Revenue Share, By Business segments, 2023 (%)
Figure 164: Company 11 Primary Progressive Multiple Sclerosis Market Net Sales Share, By Geography, 2023 (%)
Figure 165: Company 12 Primary Progressive Multiple Sclerosis Market Net Revenue, By Years, 2023-2030* ($)
Figure 166: Company 12 Primary Progressive Multiple Sclerosis Market Net Revenue Share, By Business segments, 2023 (%)
Figure 167: Company 12 Primary Progressive Multiple Sclerosis Market Net Sales Share, By Geography, 2023 (%)
Figure 168: Company 13 Primary Progressive Multiple Sclerosis Market Net Revenue, By Years, 2023-2030* ($)
Figure 169: Company 13 Primary Progressive Multiple Sclerosis Market Net Revenue Share, By Business segments, 2023 (%)
Figure 170: Company 13 Primary Progressive Multiple Sclerosis Market Net Sales Share, By Geography, 2023 (%)
Figure 171: Company 14 Primary Progressive Multiple Sclerosis Market Net Revenue, By Years, 2023-2030* ($)
Figure 172: Company 14 Primary Progressive Multiple Sclerosis Market Net Revenue Share, By Business segments, 2023 (%)
Figure 173: Company 14 Primary Progressive Multiple Sclerosis Market Net Sales Share, By Geography, 2023 (%)
Figure 174: Company 15 Primary Progressive Multiple Sclerosis Market Net Revenue, By Years, 2023-2030* ($)
Figure 175: Company 15 Primary Progressive Multiple Sclerosis Market Net Revenue Share, By Business segments, 2023 (%)
Figure 176: Company 15 Primary Progressive Multiple Sclerosis Market Net Sales Share, By Geography, 2023 (%)