 Email
Email Print
Print


Quartz Crystal Oscillators Market - Forecast(2024 - 2030)
Quartz crystal oscillator can be defines as an oscillator used in electronics device in order to achieve the stable frequency and precise clocks. Quartz Crystal oscillator uses the mechanical resonance of a vibrating crystal which is made of piezoelectric material to generate an electrical signal with a very precise frequency. Globally growing telecommunication technology and penetration of the smartphones and tablets into pockets of majority of the population across the world is expected to be the key growth driver, however fast changing technology and introduction the advanced version of the crystal oscillators is making them obsoleted and outdated technology which is expected to remain the major restraint and key concern for the market players during the period of study.
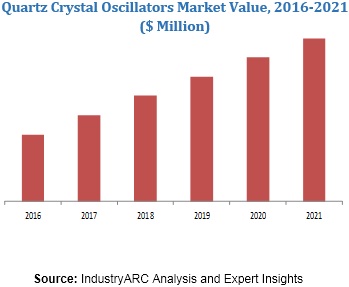
This report identifies the global quartz crystal oscillators market size in for the year 2014-2016, and forecast of the same for year 2021. It also highlights the potential growth opportunities in the coming years, while also reviewing the market drivers, restraints, growth indicators, challenges, market dynamics, competitive landscape, and other key aspects with respect to quartz crystal oscillators market.
Geographically, North America dominated the quartz crystal oscillators market due to higher demand of electrical consumer goods and smartphones by its tech savvy citizens. North America was followed by Europe and Asia-Pacific as the second and third largest consumer of quartz crystal oscillators. Asia Pacific is projected to have the fastest growth, owing to rapidly expanding smart phone consumer base especially in the major regional economies such as India and China in the region.
This report segments quartz crystal oscillators market on the basis of circuit type, technology, mounting scheme, application and regional market as follows:
Sample Companies Profiled in this Report are:
This report identifies the global quartz crystal oscillators market size in for the year 2014-2016, and forecast of the same for year 2021. It also highlights the potential growth opportunities in the coming years, while also reviewing the market drivers, restraints, growth indicators, challenges, market dynamics, competitive landscape, and other key aspects with respect to quartz crystal oscillators market.
Geographically, North America dominated the quartz crystal oscillators market due to higher demand of electrical consumer goods and smartphones by its tech savvy citizens. North America was followed by Europe and Asia-Pacific as the second and third largest consumer of quartz crystal oscillators. Asia Pacific is projected to have the fastest growth, owing to rapidly expanding smart phone consumer base especially in the major regional economies such as India and China in the region.
This report segments quartz crystal oscillators market on the basis of circuit type, technology, mounting scheme, application and regional market as follows:
- On the basis of circuit type this report on quartz crystal oscillators market is segmented as follows, covering all major types follows: Simple Packaged Crystal Oscillator (Spxo), Temperature-Compensated Crystal Oscillator (Tcxo) (Voltage-Controlled Temperature-Compensated Crystal Oscillator (Vctcxo)), Voltage-Controlled Crystal Oscillator (Vcxo) ( Temperature-Compensated Voltage-Controlled Crystal Oscillator (Tcvcxo), Oven Controlled Voltage-Controlled Crystal Oscillator (Ocvcxo)), Frequency-Controlled Crystal Oscillator (Fcxo), Oven Controlled Crystal Oscillator (Ocxo) (Double Oven-Controlled Crystal Oscillator (Docxo), Evacuated Miniature Crystal Oscillator (Emxo)) and Others
- On the basis of mounting this report on quartz crystal oscillator market is segmented as follows: Surface Mount, Thru-Hole
- On the basis of technology this report on quartz crystal oscillator market is segmented as follows: At Cut, Bt Cut, Sc Cut and Others
- On the basis of application this report on quartz crystal oscillator market is segmented as follows: Telecom and Networking, Consumer Electronics, Military and Aerospace, Research and Measurement, Industrial, Automotive, Medical Equipment and Others
- This report on quartz crystal oscillators has been further segmented into major regions, which includes detailed analysis of each region such as: North America, Europe, Asia-Pacific (APAC), and Rest of the World (RoW) covering all the major country level markets in each of the region
Sample Companies Profiled in this Report are:
- Miyazaki Epson Corporation
- Nihon Dempa Kogyo (NDK) Co., LTD.
- Txc Corporation
- Kyocera Crystal Device Corporation
- Daishinku Corp.
- 10+
1. Quartz Crystal Oscillators Market - Overview
1.1. Definitions and Scope
2. Quartz Crystal Oscillators Market - Executive summary
2.1. Market Revenue, Market Size and Key Trends by Company
2.2. Key Trends by type of Application
2.3. Key Trends segmented by Geography
3. Quartz Crystal Oscillators Market
3.1. Comparative analysis
3.1.1. Product Benchmarking - Top 10 companies
3.1.2. Top 5 Financials Analysis
3.1.3. Market Value split by Top 10 companies
3.1.4. Patent Analysis - Top 10 companies
3.1.5. Pricing Analysis
4. Quartz Crystal Oscillators Market – Startup companies Scenario Premium
4.1. Top 10 startup company Analysis by
4.1.1. Investment
4.1.2. Revenue
4.1.3. Market Shares
4.1.4. Market Size and Application Analysis
4.1.5. Venture Capital and Funding Scenario
5. Quartz Crystal Oscillators Market – Industry Market Entry Scenario Premium
5.1. Regulatory Framework Overview
5.2. New Business and Ease of Doing business index
5.3. Case studies of successful ventures
5.4. Customer Analysis – Top 10 companies
6. Quartz Crystal Oscillators Market Forces
6.1. Drivers
6.2. Constraints
6.3. Challenges
6.4. Porters five force model
6.4.1. Bargaining power of suppliers
6.4.2. Bargaining powers of customers
6.4.3. Threat of new entrants
6.4.4. Rivalry among existing players
6.4.5. Threat of substitutes
7. Quartz Crystal Oscillators Market - Strategic analysis
7.1. Value chain analysis
7.2. Opportunities analysis
7.3. Product life cycle
7.4. Suppliers and distributors Market Share
8. Quartz Crystal Oscillators Market – By Circuit Type (Market Size -$Million / $Billion)
8.1. Market Size and Market Share Analysis
8.2. Application Revenue and Trend Research
8.3. Product Segment Analysis
8.3.1. Simple Packaged Crystal Oscillator (Spxo)
8.3.2. Temperature-Compensated Crystal Oscillator (Tcxo)
8.3.2.1. Voltage-Controlled Temperature-Compensated Crystal Oscillator (Vctcxo)
8.3.3. Voltage-Controlled Crystal Oscillator (Vcxo)
8.3.3.1. Temperature-Compensated Voltage-Controlled Crystal Oscillator (Tcvcxo)
8.3.3.2. Oven Controlled Voltage-Controlled Crystal Oscillator (Ocvcxo)
8.3.4. Frequency-Controlled Crystal Oscillator (Fcxo)
8.3.5. Oven Controlled Crystal Oscillator (Ocxo)
8.3.5.1. Double Oven-Controlled Crystal Oscillator (Docxo)
8.3.5.2. Evacuated Miniature Crystal Oscillator (Emxo)
8.3.6. Others
9. Quartz Crystal Oscillators Market – By Mounting Type (Market Size -$Million / $Billion)
9.1. Surface Mount
9.2. Thru-Hole
10. Quartz Crystal Oscillators Market – By Technology (Market Size -$Million / $Billion)
10.1. At Cut
10.2. Bt Cut
10.3. Sc Cut
10.4. Others
11. Quartz Crystal Oscillators Market – By Application (Market Size -$Million / $Billion)
11.1. Telecom and Networking
11.2. Consumer Electronics
11.3. Military and Aerospace
11.4. Research and Measurement
11.5. Industrial
11.6. Automotive
11.7. Medical Equipment
11.8. Others
12. Quartz Crystal Oscillators - By Geography (Market Size -$Million / $Billion)
12.1. Quartz Crystal Oscillators Market - North America Segment Research
12.2. North America Market Research (Million / $Billion)
12.2.1. Segment type Size and Market Size Analysis
12.2.2. Revenue and Trends
12.2.3. Application Revenue and Trends by type of Application
12.2.4. Company Revenue and Product Analysis
12.2.5. North America Product type and Application Market Size
12.2.5.1. U.S.
12.2.5.2. Canada
12.2.5.3. Mexico
12.2.5.4. Rest of North America
12.3. Quartz Crystal Oscillators - South America Segment Research
12.4. South America Market Research (Market Size -$Million / $Billion)
12.4.1. Segment type Size and Market Size Analysis
12.4.2. Revenue and Trends
12.4.3. Application Revenue and Trends by type of Application
12.4.4. Company Revenue and Product Analysis
12.4.5. South America Product type and Application Market Size
12.4.5.1. Brazil
12.4.5.2. Venezuela
12.4.5.3. Argentina
12.4.5.4. Ecuador
12.4.5.5. Peru
12.4.5.6. Colombia
12.4.5.7. Costa Rica
12.4.5.8. Rest of South America
12.5. Quartz Crystal Oscillators - Europe Segment Research
12.6. Europe Market Research (Market Size -$Million / $Billion)
12.6.1. Segment type Size and Market Size Analysis
12.6.2. Revenue and Trends
12.6.3. Application Revenue and Trends by type of Application
12.6.4. Company Revenue and Product Analysis
12.6.5. Europe Segment Product type and Application Market Size
12.6.5.1. U.K
12.6.5.2. Germany
12.6.5.3. Italy
12.6.5.4. France
12.6.5.5. Netherlands
12.6.5.6. Belgium
12.6.5.7. Spain
12.6.5.8. Denmark
12.6.5.9. Rest of Europe
12.7. Quartz Crystal Oscillators – APAC Segment Research
12.8. APAC Market Research (Market Size -$Million / $Billion)
12.8.1. Segment type Size and Market Size Analysis
12.8.2. Revenue and Trends
12.8.3. Application Revenue and Trends by type of Application
12.8.4. Company Revenue and Product Analysis
12.8.5. APAC Segment – Product type and Application Market Size
12.8.5.1. China
12.8.5.2. Australia
12.8.5.3. Japan
12.8.5.4. South Korea
12.8.5.5. India
12.8.5.6. Taiwan
12.8.5.7. Malaysia
13. Quartz Crystal Oscillators Market - Entropy
13.1. New product launches
13.2. M&A's, collaborations, JVs and partnerships
14. Quartz Crystal Oscillators Market – Industry / Segment Competition landscape Premium
14.1. Market Share Analysis
14.1.1. Market Share by Country- Top companies
14.1.2. Market Share by Region- Top 10 companies
14.1.3. Market Share by type of Application – Top 10 companies
14.1.4. Market Share by type of Product / Product category- Top 10 companies
14.1.5. Market Share at global level- Top 10 companies
14.1.6. Best Practices for companies
15. Quartz Crystal Oscillators Market – Key Company List by Country Premium
16. Quartz Crystal Oscillators Market Company Analysis
16.1. Market Share, Company Revenue, Products, M&A, Developments
16.2. Miyazaki Epson Corporation
16.3. Nihon Dempa Kogyo (NDK) Co., LTD
16.4. Txc Corporation
16.5. Kyocera Crystal Device Corporation
16.6. Daishinku Corp
16.7. Company 6
16.8. Company 7
16.9. Company 8
16.10. Company 9
16.11. Company 10 and more
"*Financials would be provided on a best efforts basis for private companies"
17. Quartz Crystal Oscillators Market - Appendix
17.1. Abbreviations
17.2. Sources
18. Quartz Crystal Oscillators Market - Methodology
18.1. Research Methodology
18.1.1. Company Expert Interviews
18.1.2. Industry Databases
18.1.3. Associations
18.1.4. Company News
18.1.5. Company Annual Reports
18.1.6. Application Trends
18.1.7. New Products and Product database
18.1.8. Company Transcripts
18.1.9. R&D Trends
18.1.10. Key Opinion Leaders Interviews
18.1.11. Supply and Demand Trends
List of Tables:
Table1: Quartz Crystal Oscillators Market Overview 2023-2030
Table2: Quartz Crystal Oscillators Market Leader Analysis 2023-2030 (US$)
Table3: Quartz Crystal Oscillators Market Product Analysis 2023-2030 (US$)
Table4: Quartz Crystal Oscillators Market End User Analysis 2023-2030 (US$)
Table5: Quartz Crystal Oscillators Market Patent Analysis 2013-2023* (US$)
Table6: Quartz Crystal Oscillators Market Financial Analysis 2023-2030 (US$)
Table7: Quartz Crystal Oscillators Market Driver Analysis 2023-2030 (US$)
Table8: Quartz Crystal Oscillators Market Challenges Analysis 2023-2030 (US$)
Table9: Quartz Crystal Oscillators Market Constraint Analysis 2023-2030 (US$)
Table10: Quartz Crystal Oscillators Market Supplier Bargaining Power Analysis 2023-2030 (US$)
Table11: Quartz Crystal Oscillators Market Buyer Bargaining Power Analysis 2023-2030 (US$)
Table12: Quartz Crystal Oscillators Market Threat of Substitutes Analysis 2023-2030 (US$)
Table13: Quartz Crystal Oscillators Market Threat of New Entrants Analysis 2023-2030 (US$)
Table14: Quartz Crystal Oscillators Market Degree of Competition Analysis 2023-2030 (US$)
Table15: Quartz Crystal Oscillators Market Value Chain Analysis 2023-2030 (US$)
Table16: Quartz Crystal Oscillators Market Pricing Analysis 2023-2030 (US$)
Table17: Quartz Crystal Oscillators Market Opportunities Analysis 2023-2030 (US$)
Table18: Quartz Crystal Oscillators Market Product Life Cycle Analysis 2023-2030 (US$)
Table19: Quartz Crystal Oscillators Market Supplier Analysis 2023-2030 (US$)
Table20: Quartz Crystal Oscillators Market Distributor Analysis 2023-2030 (US$)
Table21: Quartz Crystal Oscillators Market Trend Analysis 2023-2030 (US$)
Table22: Quartz Crystal Oscillators Market Size 2023 (US$)
Table23: Quartz Crystal Oscillators Market Forecast Analysis 2023-2030 (US$)
Table24: Quartz Crystal Oscillators Market Sales Forecast Analysis 2023-2030 (Units)
Table25: Quartz Crystal Oscillators Market, Revenue & Volume, By Circuit Type, 2023-2030 ($)
Table26: Quartz Crystal Oscillators Market By Circuit Type, Revenue & Volume, By Simple Packaged Crystal Oscillator (Spxo), 2023-2030 ($)
Table27: Quartz Crystal Oscillators Market By Circuit Type, Revenue & Volume, By Temperature-Compensated Crystal Oscillator (Tcxo), 2023-2030 ($)
Table28: Quartz Crystal Oscillators Market By Circuit Type, Revenue & Volume, By Voltage-Controlled Crystal Oscillator (Vcxo), 2023-2030 ($)
Table29: Quartz Crystal Oscillators Market By Circuit Type, Revenue & Volume, By Frequency-Controlled Crystal Oscillator (Fcxo), 2023-2030 ($)
Table30: Quartz Crystal Oscillators Market By Circuit Type, Revenue & Volume, By Oven Controlled Crystal Oscillator (Ocxo), 2023-2030 ($)
Table31: Quartz Crystal Oscillators Market, Revenue & Volume, By Mounting Type, 2023-2030 ($)
Table32: Quartz Crystal Oscillators Market By Mounting Type, Revenue & Volume, By Surface Mount, 2023-2030 ($)
Table33: Quartz Crystal Oscillators Market By Mounting Type, Revenue & Volume, By Thru-Hole, 2023-2030 ($)
Table34: Quartz Crystal Oscillators Market, Revenue & Volume, By Technology, 2023-2030 ($)
Table35: Quartz Crystal Oscillators Market By Technology, Revenue & Volume, By At Cut, 2023-2030 ($)
Table36: Quartz Crystal Oscillators Market By Technology, Revenue & Volume, By Bt Cut, 2023-2030 ($)
Table37: Quartz Crystal Oscillators Market By Technology, Revenue & Volume, By Sc Cut, 2023-2030 ($)
Table38: Quartz Crystal Oscillators Market, Revenue & Volume, By Application, 2023-2030 ($)
Table39: Quartz Crystal Oscillators Market By Application, Revenue & Volume, By Telecom and Networking, 2023-2030 ($)
Table40: Quartz Crystal Oscillators Market By Application, Revenue & Volume, By Consumer Electronics, 2023-2030 ($)
Table41: Quartz Crystal Oscillators Market By Application, Revenue & Volume, By Military and Aerospace, 2023-2030 ($)
Table42: Quartz Crystal Oscillators Market By Application, Revenue & Volume, By Research and Measurement, 2023-2030 ($)
Table43: Quartz Crystal Oscillators Market By Application, Revenue & Volume, By Industrial, 2023-2030 ($)
Table44: North America Quartz Crystal Oscillators Market, Revenue & Volume, By Circuit Type, 2023-2030 ($)
Table45: North America Quartz Crystal Oscillators Market, Revenue & Volume, By Mounting Type, 2023-2030 ($)
Table46: North America Quartz Crystal Oscillators Market, Revenue & Volume, By Technology, 2023-2030 ($)
Table47: North America Quartz Crystal Oscillators Market, Revenue & Volume, By Application, 2023-2030 ($)
Table48: South america Quartz Crystal Oscillators Market, Revenue & Volume, By Circuit Type, 2023-2030 ($)
Table49: South america Quartz Crystal Oscillators Market, Revenue & Volume, By Mounting Type, 2023-2030 ($)
Table50: South america Quartz Crystal Oscillators Market, Revenue & Volume, By Technology, 2023-2030 ($)
Table51: South america Quartz Crystal Oscillators Market, Revenue & Volume, By Application, 2023-2030 ($)
Table52: Europe Quartz Crystal Oscillators Market, Revenue & Volume, By Circuit Type, 2023-2030 ($)
Table53: Europe Quartz Crystal Oscillators Market, Revenue & Volume, By Mounting Type, 2023-2030 ($)
Table54: Europe Quartz Crystal Oscillators Market, Revenue & Volume, By Technology, 2023-2030 ($)
Table55: Europe Quartz Crystal Oscillators Market, Revenue & Volume, By Application, 2023-2030 ($)
Table56: APAC Quartz Crystal Oscillators Market, Revenue & Volume, By Circuit Type, 2023-2030 ($)
Table57: APAC Quartz Crystal Oscillators Market, Revenue & Volume, By Mounting Type, 2023-2030 ($)
Table58: APAC Quartz Crystal Oscillators Market, Revenue & Volume, By Technology, 2023-2030 ($)
Table59: APAC Quartz Crystal Oscillators Market, Revenue & Volume, By Application, 2023-2030 ($)
Table60: Middle East & Africa Quartz Crystal Oscillators Market, Revenue & Volume, By Circuit Type, 2023-2030 ($)
Table61: Middle East & Africa Quartz Crystal Oscillators Market, Revenue & Volume, By Mounting Type, 2023-2030 ($)
Table62: Middle East & Africa Quartz Crystal Oscillators Market, Revenue & Volume, By Technology, 2023-2030 ($)
Table63: Middle East & Africa Quartz Crystal Oscillators Market, Revenue & Volume, By Application, 2023-2030 ($)
Table64: Russia Quartz Crystal Oscillators Market, Revenue & Volume, By Circuit Type, 2023-2030 ($)
Table65: Russia Quartz Crystal Oscillators Market, Revenue & Volume, By Mounting Type, 2023-2030 ($)
Table66: Russia Quartz Crystal Oscillators Market, Revenue & Volume, By Technology, 2023-2030 ($)
Table67: Russia Quartz Crystal Oscillators Market, Revenue & Volume, By Application, 2023-2030 ($)
Table68: Israel Quartz Crystal Oscillators Market, Revenue & Volume, By Circuit Type, 2023-2030 ($)
Table69: Israel Quartz Crystal Oscillators Market, Revenue & Volume, By Mounting Type, 2023-2030 ($)
Table70: Israel Quartz Crystal Oscillators Market, Revenue & Volume, By Technology, 2023-2030 ($)
Table71: Israel Quartz Crystal Oscillators Market, Revenue & Volume, By Application, 2023-2030 ($)
Table72: Top Companies 2023 (US$) Quartz Crystal Oscillators Market, Revenue & Volume
Table73: Product Launch 2023-2030 Quartz Crystal Oscillators Market, Revenue & Volume
Table74: Mergers & Acquistions 2023-2030 Quartz Crystal Oscillators Market, Revenue & Volume
List of Figures:
Figure 1: Overview of Quartz Crystal Oscillators Market 2023-2030
Figure 2: Market Share Analysis for Quartz Crystal Oscillators Market 2023 (US$)
Figure 3: Product Comparison in Quartz Crystal Oscillators Market 2023-2030 (US$)
Figure 4: End User Profile for Quartz Crystal Oscillators Market 2023-2030 (US$)
Figure 5: Patent Application and Grant in Quartz Crystal Oscillators Market 2013-2023* (US$)
Figure 6: Top 5 Companies Financial Analysis in Quartz Crystal Oscillators Market 2023-2030 (US$)
Figure 7: Market Entry Strategy in Quartz Crystal Oscillators Market 2023-2030
Figure 8: Ecosystem Analysis in Quartz Crystal Oscillators Market 2023
Figure 9: Average Selling Price in Quartz Crystal Oscillators Market 2023-2030
Figure 10: Top Opportunites in Quartz Crystal Oscillators Market 2023-2030
Figure 11: Market Life Cycle Analysis in Quartz Crystal Oscillators Market
Figure 12: GlobalBy Circuit TypeQuartz Crystal Oscillators Market Revenue, 2023-2030 ($)
Figure 13: GlobalBy Mounting TypeQuartz Crystal Oscillators Market Revenue, 2023-2030 ($)
Figure 14: GlobalBy TechnologyQuartz Crystal Oscillators Market Revenue, 2023-2030 ($)
Figure 15: GlobalBy ApplicationQuartz Crystal Oscillators Market Revenue, 2023-2030 ($)
Figure 16: Global Quartz Crystal Oscillators Market - By Geography
Figure 17: Global Quartz Crystal Oscillators Market Value & Volume, By Geography, 2023-2030 ($)
Figure 18: Global Quartz Crystal Oscillators Market CAGR, By Geography, 2023-2030 (%)
Figure 19: North America Quartz Crystal Oscillators Market Value & Volume, 2023-2030 ($)
Figure 20: US Quartz Crystal Oscillators Market Value & Volume, 2023-2030 ($)
Figure 21: US GDP and Population, 2023-2030 ($)
Figure 22: US GDP – Composition of 2023, By Sector of Origin
Figure 23: US Export and Import Value & Volume, 2023-2030 ($)
Figure 24: Canada Quartz Crystal Oscillators Market Value & Volume, 2023-2030 ($)
Figure 25: Canada GDP and Population, 2023-2030 ($)
Figure 26: Canada GDP – Composition of 2023, By Sector of Origin
Figure 27: Canada Export and Import Value & Volume, 2023-2030 ($)
Figure 28: Mexico Quartz Crystal Oscillators Market Value & Volume, 2023-2030 ($)
Figure 29: Mexico GDP and Population, 2023-2030 ($)
Figure 30: Mexico GDP – Composition of 2023, By Sector of Origin
Figure 31: Mexico Export and Import Value & Volume, 2023-2030 ($)
Figure 32: South America Quartz Crystal Oscillators Market Value & Volume, 2023-2030 ($)
Figure 33: Brazil Quartz Crystal Oscillators Market Value & Volume, 2023-2030 ($)
Figure 34: Brazil GDP and Population, 2023-2030 ($)
Figure 35: Brazil GDP – Composition of 2023, By Sector of Origin
Figure 36: Brazil Export and Import Value & Volume, 2023-2030 ($)
Figure 37: Venezuela Quartz Crystal Oscillators Market Value & Volume, 2023-2030 ($)
Figure 38: Venezuela GDP and Population, 2023-2030 ($)
Figure 39: Venezuela GDP – Composition of 2023, By Sector of Origin
Figure 40: Venezuela Export and Import Value & Volume, 2023-2030 ($)
Figure 41: Argentina Quartz Crystal Oscillators Market Value & Volume, 2023-2030 ($)
Figure 42: Argentina GDP and Population, 2023-2030 ($)
Figure 43: Argentina GDP – Composition of 2023, By Sector of Origin
Figure 44: Argentina Export and Import Value & Volume, 2023-2030 ($)
Figure 45: Ecuador Quartz Crystal Oscillators Market Value & Volume, 2023-2030 ($)
Figure 46: Ecuador GDP and Population, 2023-2030 ($)
Figure 47: Ecuador GDP – Composition of 2023, By Sector of Origin
Figure 48: Ecuador Export and Import Value & Volume, 2023-2030 ($)
Figure 49: Peru Quartz Crystal Oscillators Market Value & Volume, 2023-2030 ($)
Figure 50: Peru GDP and Population, 2023-2030 ($)
Figure 51: Peru GDP – Composition of 2023, By Sector of Origin
Figure 52: Peru Export and Import Value & Volume, 2023-2030 ($)
Figure 53: Colombia Quartz Crystal Oscillators Market Value & Volume, 2023-2030 ($)
Figure 54: Colombia GDP and Population, 2023-2030 ($)
Figure 55: Colombia GDP – Composition of 2023, By Sector of Origin
Figure 56: Colombia Export and Import Value & Volume, 2023-2030 ($)
Figure 57: Costa Rica Quartz Crystal Oscillators Market Value & Volume, 2023-2030 ($)
Figure 58: Costa Rica GDP and Population, 2023-2030 ($)
Figure 59: Costa Rica GDP – Composition of 2023, By Sector of Origin
Figure 60: Costa Rica Export and Import Value & Volume, 2023-2030 ($)
Figure 61: Europe Quartz Crystal Oscillators Market Value & Volume, 2023-2030 ($)
Figure 62: U.K Quartz Crystal Oscillators Market Value & Volume, 2023-2030 ($)
Figure 63: U.K GDP and Population, 2023-2030 ($)
Figure 64: U.K GDP – Composition of 2023, By Sector of Origin
Figure 65: U.K Export and Import Value & Volume, 2023-2030 ($)
Figure 66: Germany Quartz Crystal Oscillators Market Value & Volume, 2023-2030 ($)
Figure 67: Germany GDP and Population, 2023-2030 ($)
Figure 68: Germany GDP – Composition of 2023, By Sector of Origin
Figure 69: Germany Export and Import Value & Volume, 2023-2030 ($)
Figure 70: Italy Quartz Crystal Oscillators Market Value & Volume, 2023-2030 ($)
Figure 71: Italy GDP and Population, 2023-2030 ($)
Figure 72: Italy GDP – Composition of 2023, By Sector of Origin
Figure 73: Italy Export and Import Value & Volume, 2023-2030 ($)
Figure 74: France Quartz Crystal Oscillators Market Value & Volume, 2023-2030 ($)
Figure 75: France GDP and Population, 2023-2030 ($)
Figure 76: France GDP – Composition of 2023, By Sector of Origin
Figure 77: France Export and Import Value & Volume, 2023-2030 ($)
Figure 78: Netherlands Quartz Crystal Oscillators Market Value & Volume, 2023-2030 ($)
Figure 79: Netherlands GDP and Population, 2023-2030 ($)
Figure 80: Netherlands GDP – Composition of 2023, By Sector of Origin
Figure 81: Netherlands Export and Import Value & Volume, 2023-2030 ($)
Figure 82: Belgium Quartz Crystal Oscillators Market Value & Volume, 2023-2030 ($)
Figure 83: Belgium GDP and Population, 2023-2030 ($)
Figure 84: Belgium GDP – Composition of 2023, By Sector of Origin
Figure 85: Belgium Export and Import Value & Volume, 2023-2030 ($)
Figure 86: Spain Quartz Crystal Oscillators Market Value & Volume, 2023-2030 ($)
Figure 87: Spain GDP and Population, 2023-2030 ($)
Figure 88: Spain GDP – Composition of 2023, By Sector of Origin
Figure 89: Spain Export and Import Value & Volume, 2023-2030 ($)
Figure 90: Denmark Quartz Crystal Oscillators Market Value & Volume, 2023-2030 ($)
Figure 91: Denmark GDP and Population, 2023-2030 ($)
Figure 92: Denmark GDP – Composition of 2023, By Sector of Origin
Figure 93: Denmark Export and Import Value & Volume, 2023-2030 ($)
Figure 94: APAC Quartz Crystal Oscillators Market Value & Volume, 2023-2030 ($)
Figure 95: China Quartz Crystal Oscillators Market Value & Volume, 2023-2030
Figure 96: China GDP and Population, 2023-2030 ($)
Figure 97: China GDP – Composition of 2023, By Sector of Origin
Figure 98: China Export and Import Value & Volume, 2023-2030 ($)Quartz Crystal Oscillators Market China Export and Import Value & Volume, 2023-2030 ($)
Figure 99: Australia Quartz Crystal Oscillators Market Value & Volume, 2023-2030 ($)
Figure 100: Australia GDP and Population, 2023-2030 ($)
Figure 101: Australia GDP – Composition of 2023, By Sector of Origin
Figure 102: Australia Export and Import Value & Volume, 2023-2030 ($)
Figure 103: South Korea Quartz Crystal Oscillators Market Value & Volume, 2023-2030 ($)
Figure 104: South Korea GDP and Population, 2023-2030 ($)
Figure 105: South Korea GDP – Composition of 2023, By Sector of Origin
Figure 106: South Korea Export and Import Value & Volume, 2023-2030 ($)
Figure 107: India Quartz Crystal Oscillators Market Value & Volume, 2023-2030 ($)
Figure 108: India GDP and Population, 2023-2030 ($)
Figure 109: India GDP – Composition of 2023, By Sector of Origin
Figure 110: India Export and Import Value & Volume, 2023-2030 ($)
Figure 111: Taiwan Quartz Crystal Oscillators Market Value & Volume, 2023-2030 ($)
Figure 112: Taiwan GDP and Population, 2023-2030 ($)
Figure 113: Taiwan GDP – Composition of 2023, By Sector of Origin
Figure 114: Taiwan Export and Import Value & Volume, 2023-2030 ($)
Figure 115: Malaysia Quartz Crystal Oscillators Market Value & Volume, 2023-2030 ($)
Figure 116: Malaysia GDP and Population, 2023-2030 ($)
Figure 117: Malaysia GDP – Composition of 2023, By Sector of Origin
Figure 118: Malaysia Export and Import Value & Volume, 2023-2030 ($)
Figure 119: Hong Kong Quartz Crystal Oscillators Market Value & Volume, 2023-2030 ($)
Figure 120: Hong Kong GDP and Population, 2023-2030 ($)
Figure 121: Hong Kong GDP – Composition of 2023, By Sector of Origin
Figure 122: Hong Kong Export and Import Value & Volume, 2023-2030 ($)
Figure 123: Middle East & Africa Quartz Crystal Oscillators Market Middle East & Africa 3D Printing Market Value & Volume, 2023-2030 ($)
Figure 124: Russia Quartz Crystal Oscillators Market Value & Volume, 2023-2030 ($)
Figure 125: Russia GDP and Population, 2023-2030 ($)
Figure 126: Russia GDP – Composition of 2023, By Sector of Origin
Figure 127: Russia Export and Import Value & Volume, 2023-2030 ($)
Figure 128: Israel Quartz Crystal Oscillators Market Value & Volume, 2023-2030 ($)
Figure 129: Israel GDP and Population, 2023-2030 ($)
Figure 130: Israel GDP – Composition of 2023, By Sector of Origin
Figure 131: Israel Export and Import Value & Volume, 2023-2030 ($)
Figure 132: Entropy Share, By Strategies, 2023-2030* (%)Quartz Crystal Oscillators Market
Figure 133: Developments, 2023-2030*Quartz Crystal Oscillators Market
Figure 134: Company 1 Quartz Crystal Oscillators Market Net Revenue, By Years, 2023-2030* ($)
Figure 135: Company 1 Quartz Crystal Oscillators Market Net Revenue Share, By Business segments, 2023 (%)
Figure 136: Company 1 Quartz Crystal Oscillators Market Net Sales Share, By Geography, 2023 (%)
Figure 137: Company 2 Quartz Crystal Oscillators Market Net Revenue, By Years, 2023-2030* ($)
Figure 138: Company 2 Quartz Crystal Oscillators Market Net Revenue Share, By Business segments, 2023 (%)
Figure 139: Company 2 Quartz Crystal Oscillators Market Net Sales Share, By Geography, 2023 (%)
Figure 140: Company 3 Quartz Crystal Oscillators Market Net Revenue, By Years, 2023-2030* ($)
Figure 141: Company 3 Quartz Crystal Oscillators Market Net Revenue Share, By Business segments, 2023 (%)
Figure 142: Company 3 Quartz Crystal Oscillators Market Net Sales Share, By Geography, 2023 (%)
Figure 143: Company 4 Quartz Crystal Oscillators Market Net Revenue, By Years, 2023-2030* ($)
Figure 144: Company 4 Quartz Crystal Oscillators Market Net Revenue Share, By Business segments, 2023 (%)
Figure 145: Company 4 Quartz Crystal Oscillators Market Net Sales Share, By Geography, 2023 (%)
Figure 146: Company 5 Quartz Crystal Oscillators Market Net Revenue, By Years, 2023-2030* ($)
Figure 147: Company 5 Quartz Crystal Oscillators Market Net Revenue Share, By Business segments, 2023 (%)
Figure 148: Company 5 Quartz Crystal Oscillators Market Net Sales Share, By Geography, 2023 (%)
Figure 149: Company 6 Quartz Crystal Oscillators Market Net Revenue, By Years, 2023-2030* ($)
Figure 150: Company 6 Quartz Crystal Oscillators Market Net Revenue Share, By Business segments, 2023 (%)
Figure 151: Company 6 Quartz Crystal Oscillators Market Net Sales Share, By Geography, 2023 (%)
Figure 152: Company 7 Quartz Crystal Oscillators Market Net Revenue, By Years, 2023-2030* ($)
Figure 153: Company 7 Quartz Crystal Oscillators Market Net Revenue Share, By Business segments, 2023 (%)
Figure 154: Company 7 Quartz Crystal Oscillators Market Net Sales Share, By Geography, 2023 (%)
Figure 155: Company 8 Quartz Crystal Oscillators Market Net Revenue, By Years, 2023-2030* ($)
Figure 156: Company 8 Quartz Crystal Oscillators Market Net Revenue Share, By Business segments, 2023 (%)
Figure 157: Company 8 Quartz Crystal Oscillators Market Net Sales Share, By Geography, 2023 (%)
Figure 158: Company 9 Quartz Crystal Oscillators Market Net Revenue, By Years, 2023-2030* ($)
Figure 159: Company 9 Quartz Crystal Oscillators Market Net Revenue Share, By Business segments, 2023 (%)
Figure 160: Company 9 Quartz Crystal Oscillators Market Net Sales Share, By Geography, 2023 (%)
Figure 161: Company 10 Quartz Crystal Oscillators Market Net Revenue, By Years, 2023-2030* ($)
Figure 162: Company 10 Quartz Crystal Oscillators Market Net Revenue Share, By Business segments, 2023 (%)
Figure 163: Company 10 Quartz Crystal Oscillators Market Net Sales Share, By Geography, 2023 (%)
Figure 164: Company 11 Quartz Crystal Oscillators Market Net Revenue, By Years, 2023-2030* ($)
Figure 165: Company 11 Quartz Crystal Oscillators Market Net Revenue Share, By Business segments, 2023 (%)
Figure 166: Company 11 Quartz Crystal Oscillators Market Net Sales Share, By Geography, 2023 (%)
Figure 167: Company 12 Quartz Crystal Oscillators Market Net Revenue, By Years, 2023-2030* ($)
Figure 168: Company 12 Quartz Crystal Oscillators Market Net Revenue Share, By Business segments, 2023 (%)
Figure 169: Company 12 Quartz Crystal Oscillators Market Net Sales Share, By Geography, 2023 (%)
Figure 170: Company 13 Quartz Crystal Oscillators Market Net Revenue, By Years, 2023-2030* ($)
Figure 171: Company 13 Quartz Crystal Oscillators Market Net Revenue Share, By Business segments, 2023 (%)
Figure 172: Company 13 Quartz Crystal Oscillators Market Net Sales Share, By Geography, 2023 (%)
Figure 173: Company 14 Quartz Crystal Oscillators Market Net Revenue, By Years, 2023-2030* ($)
Figure 174: Company 14 Quartz Crystal Oscillators Market Net Revenue Share, By Business segments, 2023 (%)
Figure 175: Company 14 Quartz Crystal Oscillators Market Net Sales Share, By Geography, 2023 (%)
Figure 176: Company 15 Quartz Crystal Oscillators Market Net Revenue, By Years, 2023-2030* ($)
Figure 177: Company 15 Quartz Crystal Oscillators Market Net Revenue Share, By Business segments, 2023 (%)
Figure 178: Company 15 Quartz Crystal Oscillators Market Net Sales Share, By Geography, 2023 (%)