 Email
Email Print
Print


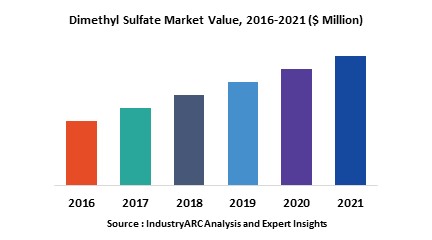
Dimethyl Sulfate Market Overview:
Dimethyl sulfate (DMS) is also known as dimethyl ester with colorless and faint onion odor. It is used as alkyl agent in different applications like pharmaceuticals, dyes, perfumes and as war gas. It is also used to make fatty ammonium solutions for fabric softeners and surfactants. It is most corrosive in nature. It causes severe damages to skin, throat if exposed. APAC countries are largest markets for DMS. The increased living standards of people using applications of DMS has also increased the market growth.
Dimethyl Sulfate Market Outlook:
The application industries are growing the demand of DMS in the market. The applications include pharmaceuticals, chemical industries, textile industries, dyes, perfumes, coloring agents, surfactants, solvents and so on. For the manufacturing of fabric solvents, the market of DMS has good scope in the future. Also for the chemical synthesis, catalyst and substitute properties of DMS has increased use in the chemical industries. For large applications, these are provided in drums, ISO tanks. The toxic nature is only retrain in this market. But EPA agencies are finding protective measures and creating awareness among the consumers to lead the market.
Dimethyl Sulfate Market Growth Drivers:
The behavior of catalyst, sulfating agent, stabilizer and solvent drives the market growth. Also DMS acts as substitute for various chemical compounds and used as alternative to them. For example, for the synthesis of beta-lactams, DMS became new reagent in the chemical synthesis. The advantage of replacing DMS is low cost, easy purification and so on.
Dimethyl Sulfate Market Challenges:
The reduction of risk factors exposed to Dimethyl Sulfate by fishes, humans and so on is a challenge in the market. For humans, Inhalation and dermal contact is the only way that harms the body. It causes cancer, Skin irritation, eye damage, and other serious effects when exposed or inhaled.
Dimethyl Sulfate Market Research Scope:
The base year of the study is 2017, with forecast done up to 2023. The study presents a thorough analysis of the competitive landscape, taking into account the market shares of the leading companies. It also provides information on unit shipments. These provide the key market participants with the necessary business intelligence and help them understand the future of the Dimethyl Sulfate. The assessment includes the forecast, an overview of the competitive structure, the market shares of the competitors, as well as the market trends, market demands, market drivers, market challenges, and product analysis. The market drivers and restraints have been assessed to fathom their impact over the forecast period. This report further identifies the key opportunities for growth while also detailing the key challenges and possible threats. The key areas of focus include the types of Dimethyl Sulfate Market, and their specific applications in different types of vehicles.
Dimethyl Sulfate Market Report: Industry Coverage:
Applications of Dimethyl Sulfate: Pharmaceuticals, Water treatment, chemical industry, fabric softeners, personal care, cosmetics, war gas, Perfumes, Dyes, Agrochemicals, Surfactants.
Forms of Dimethyl Sulfate: Liquid, Vapor
Dimethyl Sulfate Market report also analyzes the major geographic regions for the market as well as the major countries for the market in these regions. The regions and countries covered in the study include:
- North America: The U.S., Canada, Mexico
- South America: Brazil, Venezuela, Argentina, Ecuador, Peru, Colombia, Costa Rica
- Europe: The U.K., Germany, Italy, France, The Netherlands, Belgium, Spain, Denmark
- APAC: China, Japan, Australia, South Korea, India, Taiwan, Malaysia, Hong Kong
- Middle East and Africa: Israel, South Africa, Saudi Arabia
Dimethyl Sulfate Market Key Players Perspective:
Some of the other key players mentioned in this report are Dow chemical company, Dupont, BASF, Sigma Aldrich, Celedon Laboratories, IRO group, Honeywell and few more companies.
Dimethyl Sulfate Market Trends:
In vivo foot printing for the chemical cleavage of DNA, DMS is used for determining the proteins and DNA interactions at a given point of time.
The sensitive spectrophotometric method is employed for the determination of DMS content in polluted air and water. The tolerance limits of ions are studied for toxic levels.
1. Dimethyl Sulfate Market- Overview
1.1. Definitions and Scope
2. Dimethyl Sulfate Market- Executive summary
2.1. Market Revenue, Market Size and Key Trends by Company
2.2. Key Trends by type of Application
2.3. Key Trends segmented by Geography
3. Dimethyl Sulfate Market
3.1. Comparative analysis
3.1.1. Product Benchmarking - Top 10 companies
3.1.2. Top 5 Financials Analysis
3.1.3. Market Value split by Top 10 companies
3.1.4. Patent Analysis - Top 10 companies
3.1.5. Pricing Analysis
4. Dimethyl Sulfate Market– Startup companies Scenario Premium
4.1. Top 10 startup company Analysis by
4.1.1. Investment
4.1.2. Revenue
4.1.3. Market Shares
4.1.4. Market Size and Application Analysis
4.1.5. Venture Capital and Funding Scenario
5. Dimethyl Sulfate Market– Industry Market Entry Scenario Premium
5.1. Regulatory Framework Overview
5.2. New Business and Ease of Doing business index
5.3. Case studies of successful ventures
5.4. Customer Analysis – Top 10 companies
6. Dimethyl Sulfate Market Forces
6.1. Drivers
6.2. Constraints
6.3. Challenges
6.4. Porters five force model
6.4.1. Bargaining power of suppliers
6.4.2. Bargaining powers of customers
6.4.3. Threat of new entrants
6.4.4. Rivalry among existing players
6.4.5. Threat of substitutes
7. Dimethyl Sulfate Market-Strategic analysis
7.1. Value chain analysis
7.2. Opportunities analysis
7.3. Product life cycle
8. Dimethyl Sulfate Market– By Application (Market Size -$Million / $Billion)
8.1. Segment type Size and Market Share Analysis
8.2. Application Revenue and Trends by type of Application
8.3. Application Segment Analysis by Type
8.3.1. Dyes
8.3.2. Perfumes
8.3.3. War gas
8.3.4. Agrochemical
8.3.5. Water treatment
8.3.6. Surfactants
8.3.7. Fabric Softener
8.3.8. Cosmetic industry
8.3.9. Personal Care
8.3.10. Others
9. Dimethyl Sulfate Market – Type of Category 2 (Market Size -$Million / $Billion)
9.1. Liquid
9.2. Vapor
9.3. Others
10. Dimethyl Sulfate Market- By Geography (Market Size -$Million / $Billion)
10.1. Dimethyl Sulfate Market- North America Segment Research
10.2. North America Market Research (Million / $Billion)
10.2.1. Segment type Size and Market Size Analysis
10.2.2. Revenue and Trends
10.2.3. Application Revenue and Trends by type of Application
10.2.4. Company Revenue and Product Analysis
10.2.5. North America Product type and Application Market Size
10.2.5.1. U.S.
10.2.5.2. Canada
10.2.5.3. Mexico
10.2.5.4. Rest of North America
10.3. Dimethyl Sulfate Market- South America Segment Research
10.4. South America Market Research (Market Size -$Million / $Billion)
10.4.1. Segment type Size and Market Size Analysis
10.4.2. Revenue and Trends
10.4.3. Application Revenue and Trends by type of Application
10.4.4. Company Revenue and Product Analysis
10.4.5. South America Product type and Application Market Size
10.4.5.1. Brazil
10.4.5.2. Venezuela
10.4.5.3. Argentina
10.4.5.4. Ecuador
10.4.5.5. Peru
10.4.5.6. Colombia
10.4.5.7. Costa Rica
10.4.5.8. Rest of South America
10.5. Dimethyl Sulfate Market- Europe Segment Research
10.6. Europe Market Research (Market Size -$Million / $Billion)
10.6.1. Segment type Size and Market Size Analysis
10.6.2. Revenue and Trends
10.6.3. Application Revenue and Trends by type of Application
10.6.4. Company Revenue and Product Analysis
10.6.5. Europe Segment Product type and Application Market Size
10.6.5.1. U.K
10.6.5.2. Germany
10.6.5.3. Italy
10.6.5.4. France
10.6.5.5. Netherlands
10.6.5.6. Belgium
10.6.5.7. Spain
10.6.5.8. Denmark
10.6.5.9. Rest of Europe
10.7. Dimethyl Sulfate Market– APAC Segment Research
10.8. APAC Market Research (Market Size -$Million / $Billion)
10.8.1. Segment type Size and Market Size Analysis
10.8.2. Revenue and Trends
10.8.3. Application Revenue and Trends by type of Application
10.8.4. Company Revenue and Product Analysis
10.8.5. APAC Segment – Product type and Application Market Size
10.8.5.1. China
10.8.5.2. Australia
10.8.5.3. Japan
10.8.5.4. South Korea
10.8.5.5. India
10.8.5.6. Taiwan
10.8.5.7. Malaysia
10.8.5.8. Hong Kong
10.8.5.9. Rest of APAC
10.9. Dimethyl Sulfate Market– Middle East Segment and Africa Segment Research
10.10. Middle East & Africa Market Research (Market Size -$Million / $Billion)
10.10.1. Segment type Size and Market Size Analysis
10.10.2. Revenue and Trend Analysis
10.10.3. Application Revenue and Trends by type of Application
10.10.4. Company Revenue and Product Analysis
10.10.5. Middle East Segment Product type and Application Market Size
10.10.5.1. Israel
10.10.5.2. Saudi Arabia
10.10.5.3. UAE
10.10.6. Africa Segment Analysis
10.10.6.1. South Africa
10.10.6.2. Rest of Middle East & Africa
11. Dimethyl Sulfate Market- Entropy
11.1. New product launches
11.2. M&A's, collaborations, JVs and partnerships
12. Dimethyl Sulfate Market– Industry / Segment Competition landscape Premium
12.1. Market Share Analysis
12.1.1. Market Share by Country- Top companies
12.1.2. Market Share by Region- Top 10 companies
12.1.3. Market Share by type of Application – Top 10 companies
12.1.4. Market Share by type of Product / Product category- Top 10 companies
12.1.5. Market Share at global level- Top 10 companies
12.1.6. Best Practices for companies
13. Dimethyl Sulfate Market– Key Company List by Country Premium
14. Dimethyl Sulfate Market Company Analysis
14.1. Market Share, Company Revenue, Products, M&A, Developments
14.2. Dow chemical company
14.3. Dupont
14.4. BASF
14.5. Sigma Aldrich
14.6. Celedon Laboratories
14.7. IRO group
14.8. Honeywell
14.9. Company8
14.10. Compan9
14.11. Company 10 and more
"*Financials would be provided on a best efforts basis for private companies"
15. Dimethyl Sulfate Market-Appendix
15.1. Abbreviations
15.2. Sources
16. Dimethyl Sulfate Market-Methodology Premium
16.1. Research Methodology
16.1.1. Company Expert Interviews
16.1.2. Industry Databases
16.1.3. Associations
16.1.4. Company News
16.1.5. Company Annual Reports
16.1.6. Application Trends
16.1.7. New Products and Product database
16.1.8. Company Transcripts
16.1.9. R&D Trends
16.1.10. Key Opinion Leaders Interviews
16.1.11. Supply and Demand Trends
List of Tables:
Table 1: Dimethyl Sulfate Market Overview 2023-2030
Table 2: Dimethyl Sulfate Market Leader Analysis 2023-2030 (US$)
Table 3: Dimethyl Sulfate Market Product Analysis 2023-2030 (US$)
Table 4: Dimethyl Sulfate Market End User Analysis 2023-2030 (US$)
Table 5: Dimethyl Sulfate Market Patent Analysis 2013-2023* (US$)
Table 6: Dimethyl Sulfate Market Financial Analysis 2023-2030 (US$)
Table 7: Dimethyl Sulfate Market Driver Analysis 2023-2030 (US$)
Table 8: Dimethyl Sulfate Market Challenges Analysis 2023-2030 (US$)
Table 9: Dimethyl Sulfate Market Constraint Analysis 2023-2030 (US$)
Table 10: Dimethyl Sulfate Market Supplier Bargaining Power Analysis 2023-2030 (US$)
Table 11: Dimethyl Sulfate Market Buyer Bargaining Power Analysis 2023-2030 (US$)
Table 12: Dimethyl Sulfate Market Threat of Substitutes Analysis 2023-2030 (US$)
Table 13: Dimethyl Sulfate Market Threat of New Entrants Analysis 2023-2030 (US$)
Table 14: Dimethyl Sulfate Market Degree of Competition Analysis 2023-2030 (US$)
Table 15: Dimethyl Sulfate Market Value Chain Analysis 2023-2030 (US$)
Table 16: Dimethyl Sulfate Market Pricing Analysis 2023-2030 (US$)
Table 17: Dimethyl Sulfate Market Opportunities Analysis 2023-2030 (US$)
Table 18: Dimethyl Sulfate Market Product Life Cycle Analysis 2023-2030 (US$)
Table 19: Dimethyl Sulfate Market Supplier Analysis 2023-2030 (US$)
Table 20: Dimethyl Sulfate Market Distributor Analysis 2023-2030 (US$)
Table 21: Dimethyl Sulfate Market Trend Analysis 2023-2030 (US$)
Table 22: Dimethyl Sulfate Market Size 2023 (US$)
Table 23: Dimethyl Sulfate Market Forecast Analysis 2023-2030 (US$)
Table 24: Dimethyl Sulfate Market Sales Forecast Analysis 2023-2030 (Units)
Table 25: Dimethyl Sulfate Market, Revenue & Volume, By Industry, 2023-2030 ($)
Table 26: Dimethyl Sulfate Market By Industry, Revenue & Volume, By Pharmaceutical, 2023-2030 ($)
Table 27: Dimethyl Sulfate Market By Industry, Revenue & Volume, By Agrochemical, 2023-2030 ($)
Table 28: Dimethyl Sulfate Market By Industry, Revenue & Volume, By Water treatment, 2023-2030 ($)
Table 29: North America Dimethyl Sulfate Market, Revenue & Volume, By Industry, 2023-2030 ($)
Table 30: South america Dimethyl Sulfate Market, Revenue & Volume, By Industry, 2023-2030 ($)
Table 31: Europe Dimethyl Sulfate Market, Revenue & Volume, By Industry, 2023-2030 ($)
Table 32: APAC Dimethyl Sulfate Market, Revenue & Volume, By Industry, 2023-2030 ($)
Table 33: Middle East & Africa Dimethyl Sulfate Market, Revenue & Volume, By Industry, 2023-2030 ($)
Table 34: Russia Dimethyl Sulfate Market, Revenue & Volume, By Industry, 2023-2030 ($)
Table 35: Israel Dimethyl Sulfate Market, Revenue & Volume, By Industry, 2023-2030 ($)
Table 36: Top Companies 2023 (US$) Dimethyl Sulfate Market, Revenue & Volume
Table 37: Product Launch 2023-2030 Dimethyl Sulfate Market, Revenue & Volume
Table 38: Mergers & Acquistions 2023-2030 Dimethyl Sulfate Market, Revenue & Volume
List of Figures:
Figure 1: Overview of Dimethyl Sulfate Market 2023-2030
Figure 2: Market Share Analysis for Dimethyl Sulfate Market 2023 (US$)
Figure 3: Product Comparison in Dimethyl Sulfate Market 2023-2030 (US$)
Figure 4: End User Profile for Dimethyl Sulfate Market 2023-2030 (US$)
Figure 5: Patent Application and Grant in Dimethyl Sulfate Market 2013-2023* (US$)
Figure 6: Top 5 Companies Financial Analysis in Dimethyl Sulfate Market 2023-2030 (US$)
Figure 7: Market Entry Strategy in Dimethyl Sulfate Market 2023-2030
Figure 8: Ecosystem Analysis in Dimethyl Sulfate Market 2023
Figure 9: Average Selling Price in Dimethyl Sulfate Market 2023-2030
Figure 10: Top Opportunites in Dimethyl Sulfate Market 2023-2030
Figure 11: Market Life Cycle Analysis in Dimethyl Sulfate Market
Figure 12: GlobalBy Industry Dimethyl Sulfate Market Revenue, 2023-2030 ($)
Figure 13: Global Dimethyl Sulfate Market - By Geography
Figure 14: Global Dimethyl Sulfate Market Value & Volume, By Geography, 2023-2030 ($)
Figure 15: Global Dimethyl Sulfate Market CAGR, By Geography, 2023-2030 (%)
Figure 16: North America Dimethyl Sulfate Market Value & Volume, 2023-2030 ($)
Figure 17: US Dimethyl Sulfate Market Value & Volume, 2023-2030 ($)
Figure 18: US GDP and Population, 2023-2030 ($)
Figure 19: US GDP – Composition of 2023, By Sector of Origin
Figure 20: US Export and Import Value & Volume, 2023-2030 ($)
Figure 21: Canada Dimethyl Sulfate Market Value & Volume, 2023-2030 ($)
Figure 22: Canada GDP and Population, 2023-2030 ($)
Figure 23: Canada GDP – Composition of 2023, By Sector of Origin
Figure 24: Canada Export and Import Value & Volume, 2023-2030 ($)
Figure 25: Mexico Dimethyl Sulfate Market Value & Volume, 2023-2030 ($)
Figure 26: Mexico GDP and Population, 2023-2030 ($)
Figure 27: Mexico GDP – Composition of 2023, By Sector of Origin
Figure 28: Mexico Export and Import Value & Volume, 2023-2030 ($)
Figure 29: South America Dimethyl Sulfate Market Value & Volume, 2023-2030 ($)
Figure 30: Brazil Dimethyl Sulfate Market Value & Volume, 2023-2030 ($)
Figure 31: Brazil GDP and Population, 2023-2030 ($)
Figure 32: Brazil GDP – Composition of 2023, By Sector of Origin
Figure 33: Brazil Export and Import Value & Volume, 2023-2030 ($)
Figure 34: Venezuela Dimethyl Sulfate Market Value & Volume, 2023-2030 ($)
Figure 35: Venezuela GDP and Population, 2023-2030 ($)
Figure 36: Venezuela GDP – Composition of 2023, By Sector of Origin
Figure 37: Venezuela Export and Import Value & Volume, 2023-2030 ($)
Figure 38: Argentina Dimethyl Sulfate Market Value & Volume, 2023-2030 ($)
Figure 39: Argentina GDP and Population, 2023-2030 ($)
Figure 40: Argentina GDP – Composition of 2023, By Sector of Origin
Figure 41: Argentina Export and Import Value & Volume, 2023-2030 ($)
Figure 42: Ecuador Dimethyl Sulfate Market Value & Volume, 2023-2030 ($)
Figure 43: Ecuador GDP and Population, 2023-2030 ($)
Figure 44: Ecuador GDP – Composition of 2023, By Sector of Origin
Figure 45: Ecuador Export and Import Value & Volume, 2023-2030 ($)
Figure 46: Peru Dimethyl Sulfate Market Value & Volume, 2023-2030 ($)
Figure 47: Peru GDP and Population, 2023-2030 ($)
Figure 48: Peru GDP – Composition of 2023, By Sector of Origin
Figure 49: Peru Export and Import Value & Volume, 2023-2030 ($)
Figure 50: Colombia Dimethyl Sulfate Market Value & Volume, 2023-2030 ($)
Figure 51: Colombia GDP and Population, 2023-2030 ($)
Figure 52: Colombia GDP – Composition of 2023, By Sector of Origin
Figure 53: Colombia Export and Import Value & Volume, 2023-2030 ($)
Figure 54: Costa Rica Dimethyl Sulfate Market Value & Volume, 2023-2030 ($)
Figure 55: Costa Rica GDP and Population, 2023-2030 ($)
Figure 56: Costa Rica GDP – Composition of 2023, By Sector of Origin
Figure 57: Costa Rica Export and Import Value & Volume, 2023-2030 ($)
Figure 58: Europe Dimethyl Sulfate Market Value & Volume, 2023-2030 ($)
Figure 59: U.K Dimethyl Sulfate Market Value & Volume, 2023-2030 ($)
Figure 60: U.K GDP and Population, 2023-2030 ($)
Figure 61: U.K GDP – Composition of 2023, By Sector of Origin
Figure 62: U.K Export and Import Value & Volume, 2023-2030 ($)
Figure 63: Germany Dimethyl Sulfate Market Value & Volume, 2023-2030 ($)
Figure 64: Germany GDP and Population, 2023-2030 ($)
Figure 65: Germany GDP – Composition of 2023, By Sector of Origin
Figure 66: Germany Export and Import Value & Volume, 2023-2030 ($)
Figure 67: Italy Dimethyl Sulfate Market Value & Volume, 2023-2030 ($)
Figure 68: Italy GDP and Population, 2023-2030 ($)
Figure 69: Italy GDP – Composition of 2023, By Sector of Origin
Figure 70: Italy Export and Import Value & Volume, 2023-2030 ($)
Figure 71: France Dimethyl Sulfate Market Value & Volume, 2023-2030 ($)
Figure 72: France GDP and Population, 2023-2030 ($)
Figure 73: France GDP – Composition of 2023, By Sector of Origin
Figure 74: France Export and Import Value & Volume, 2023-2030 ($)
Figure 75: Netherlands Dimethyl Sulfate Market Value & Volume, 2023-2030 ($)
Figure 76: Netherlands GDP and Population, 2023-2030 ($)
Figure 77: Netherlands GDP – Composition of 2023, By Sector of Origin
Figure 78: Netherlands Export and Import Value & Volume, 2023-2030 ($)
Figure 79: Belgium Dimethyl Sulfate Market Value & Volume, 2023-2030 ($)
Figure 80: Belgium GDP and Population, 2023-2030 ($)
Figure 81: Belgium GDP – Composition of 2023, By Sector of Origin
Figure 82: Belgium Export and Import Value & Volume, 2023-2030 ($)
Figure 83: Spain Dimethyl Sulfate Market Value & Volume, 2023-2030 ($)
Figure 84: Spain GDP and Population, 2023-2030 ($)
Figure 85: Spain GDP – Composition of 2023, By Sector of Origin
Figure 86: Spain Export and Import Value & Volume, 2023-2030 ($)
Figure 87: Denmark Dimethyl Sulfate Market Value & Volume, 2023-2030 ($)
Figure 88: Denmark GDP and Population, 2023-2030 ($)
Figure 89: Denmark GDP – Composition of 2023, By Sector of Origin
Figure 90: Denmark Export and Import Value & Volume, 2023-2030 ($)
Figure 91: APAC Dimethyl Sulfate Market Value & Volume, 2023-2030 ($)
Figure 92: China Dimethyl Sulfate Market Value & Volume, 2023-2030
Figure 93: China GDP and Population, 2023-2030 ($)
Figure 94: China GDP – Composition of 2023, By Sector of Origin
Figure 95: China Export and Import Value & Volume, 2023-2030 ($) Dimethyl Sulfate Market China Export and Import Value & Volume, 2023-2030 ($)
Figure 96: Australia Dimethyl Sulfate Market Value & Volume, 2023-2030 ($)
Figure 97: Australia GDP and Population, 2023-2030 ($)
Figure 98: Australia GDP – Composition of 2023, By Sector of Origin
Figure 99: Australia Export and Import Value & Volume, 2023-2030 ($)
Figure 100: South Korea Dimethyl Sulfate Market Value & Volume, 2023-2030 ($)
Figure 101: South Korea GDP and Population, 2023-2030 ($)
Figure 102: South Korea GDP – Composition of 2023, By Sector of Origin
Figure 103: South Korea Export and Import Value & Volume, 2023-2030 ($)
Figure 104: India Dimethyl Sulfate Market Value & Volume, 2023-2030 ($)
Figure 105: India GDP and Population, 2023-2030 ($)
Figure 106: India GDP – Composition of 2023, By Sector of Origin
Figure 107: India Export and Import Value & Volume, 2023-2030 ($)
Figure 108: Taiwan Dimethyl Sulfate Market Value & Volume, 2023-2030 ($)
Figure 109: Taiwan GDP and Population, 2023-2030 ($)
Figure 110: Taiwan GDP – Composition of 2023, By Sector of Origin
Figure 111: Taiwan Export and Import Value & Volume, 2023-2030 ($)
Figure 112: Malaysia Dimethyl Sulfate Market Value & Volume, 2023-2030 ($)
Figure 113: Malaysia GDP and Population, 2023-2030 ($)
Figure 114: Malaysia GDP – Composition of 2023, By Sector of Origin
Figure 115: Malaysia Export and Import Value & Volume, 2023-2030 ($)
Figure 116: Hong Kong Dimethyl Sulfate Market Value & Volume, 2023-2030 ($)
Figure 117: Hong Kong GDP and Population, 2023-2030 ($)
Figure 118: Hong Kong GDP – Composition of 2023, By Sector of Origin
Figure 119: Hong Kong Export and Import Value & Volume, 2023-2030 ($)
Figure 120: Middle East & Africa Dimethyl Sulfate Market Middle East & Africa 3D Printing Market Value & Volume, 2023-2030 ($)
Figure 121: Russia Dimethyl Sulfate Market Value & Volume, 2023-2030 ($)
Figure 122: Russia GDP and Population, 2023-2030 ($)
Figure 123: Russia GDP – Composition of 2023, By Sector of Origin
Figure 124: Russia Export and Import Value & Volume, 2023-2030 ($)
Figure 125: Israel Dimethyl Sulfate Market Value & Volume, 2023-2030 ($)
Figure 126: Israel GDP and Population, 2023-2030 ($)
Figure 127: Israel GDP – Composition of 2023, By Sector of Origin
Figure 128: Israel Export and Import Value & Volume, 2023-2030 ($)
Figure 129: Entropy Share, By Strategies, 2023-2030* (%) Dimethyl Sulfate Market
Figure 130: Developments, 2023-2030* Dimethyl Sulfate Market
Figure 131: Company 1 Dimethyl Sulfate Market Net Revenue, By Years, 2023-2030* ($)
Figure 132: Company 1 Dimethyl Sulfate Market Net Revenue Share, By Business segments, 2023 (%)
Figure 133: Company 1 Dimethyl Sulfate Market Net Sales Share, By Geography, 2023 (%)
Figure 134: Company 2 Dimethyl Sulfate Market Net Revenue, By Years, 2023-2030* ($)
Figure 135: Company 2 Dimethyl Sulfate Market Net Revenue Share, By Business segments, 2023 (%)
Figure 136: Company 2 Dimethyl Sulfate Market Net Sales Share, By Geography, 2023 (%)
Figure 137: Company 3 Dimethyl Sulfate Market Net Revenue, By Years, 2023-2030* ($)
Figure 138: Company 3 Dimethyl Sulfate Market Net Revenue Share, By Business segments, 2023 (%)
Figure 139: Company 3 Dimethyl Sulfate Market Net Sales Share, By Geography, 2023 (%)
Figure 140: Company 4 Dimethyl Sulfate Market Net Revenue, By Years, 2023-2030* ($)
Figure 141: Company 4 Dimethyl Sulfate Market Net Revenue Share, By Business segments, 2023 (%)
Figure 142: Company 4 Dimethyl Sulfate Market Net Sales Share, By Geography, 2023 (%)
Figure 143: Company 5 Dimethyl Sulfate Market Net Revenue, By Years, 2023-2030* ($)
Figure 144: Company 5 Dimethyl Sulfate Market Net Revenue Share, By Business segments, 2023 (%)
Figure 145: Company 5 Dimethyl Sulfate Market Net Sales Share, By Geography, 2023 (%)
Figure 146: Company 6 Dimethyl Sulfate Market Net Revenue, By Years, 2023-2030* ($)
Figure 147: Company 6 Dimethyl Sulfate Market Net Revenue Share, By Business segments, 2023 (%)
Figure 148: Company 6 Dimethyl Sulfate Market Net Sales Share, By Geography, 2023 (%)
Figure 149: Company 7 Dimethyl Sulfate Market Net Revenue, By Years, 2023-2030* ($)
Figure 150: Company 7 Dimethyl Sulfate Market Net Revenue Share, By Business segments, 2023 (%)
Figure 151: Company 7 Dimethyl Sulfate Market Net Sales Share, By Geography, 2023 (%)
Figure 152: Company 8 Dimethyl Sulfate Market Net Revenue, By Years, 2023-2030* ($)
Figure 153: Company 8 Dimethyl Sulfate Market Net Revenue Share, By Business segments, 2023 (%)
Figure 154: Company 8 Dimethyl Sulfate Market Net Sales Share, By Geography, 2023 (%)
Figure 155: Company 9 Dimethyl Sulfate Market Net Revenue, By Years, 2023-2030* ($)
Figure 156: Company 9 Dimethyl Sulfate Market Net Revenue Share, By Business segments, 2023 (%)
Figure 157: Company 9 Dimethyl Sulfate Market Net Sales Share, By Geography, 2023 (%)
Figure 158: Company 10 Dimethyl Sulfate Market Net Revenue, By Years, 2023-2030* ($)
Figure 159: Company 10 Dimethyl Sulfate Market Net Revenue Share, By Business segments, 2023 (%)
Figure 160: Company 10 Dimethyl Sulfate Market Net Sales Share, By Geography, 2023 (%)
Figure 161: Company 11 Dimethyl Sulfate Market Net Revenue, By Years, 2023-2030* ($)
Figure 162: Company 11 Dimethyl Sulfate Market Net Revenue Share, By Business segments, 2023 (%)
Figure 163: Company 11 Dimethyl Sulfate Market Net Sales Share, By Geography, 2023 (%)
Figure 164: Company 12 Dimethyl Sulfate Market Net Revenue, By Years, 2023-2030* ($)
Figure 165: Company 12 Dimethyl Sulfate Market Net Revenue Share, By Business segments, 2023 (%)
Figure 166: Company 12 Dimethyl Sulfate Market Net Sales Share, By Geography, 2023 (%)
Figure 167: Company 13 Dimethyl Sulfate Market Net Revenue, By Years, 2023-2030* ($)
Figure 168: Company 13 Dimethyl Sulfate Market Net Revenue Share, By Business segments, 2023 (%)
Figure 169: Company 13 Dimethyl Sulfate Market Net Sales Share, By Geography, 2023 (%)
Figure 170: Company 14 Dimethyl Sulfate Market Net Revenue, By Years, 2023-2030* ($)
Figure 171: Company 14 Dimethyl Sulfate Market Net Revenue Share, By Business segments, 2023 (%)
Figure 172: Company 14 Dimethyl Sulfate Market Net Sales Share, By Geography, 2023 (%)
Figure 173: Company 15 Dimethyl Sulfate Market Net Revenue, By Years, 2023-2030* ($)
Figure 174: Company 15 Dimethyl Sulfate Market Net Revenue Share, By Business segments, 2023 (%)
Figure 175: Company 15 Dimethyl Sulfate Market Net Sales Share, By Geography, 2023 (%)