 Email
Email Print
Print


Duodenal Ulcer Treatment Market - Forecast(2024 - 2030)
Duodenal ulcer is a sore occurring in the upper area of the small intestine, the duodenum. Gram-negative micro aerophilic bacteria helicobacter pylori (H. pylori) are the causative agent. Common symptoms for duodenal ulcer include abdominal pain, pain or uneasiness in the upper abdomen, feeling of flabbiness, blood in vomiting and chest pain. Causative factors for duodenal ulcer are alcohol consumption, cigarettes smoking or chewing tobacco, improper eating habits, genetic factors and non-steroidal anti-inflammatory drugs. Duodenal ulcer diagnosis is done by esophagogastroduodenoscopy (EGD), X-ray of upper gastrointestinal and endoscopy of intestine.
Treatment for the cure of duodenal ulcer includes use of antibiotics (amoxicillin, tetracycline), proton pump inhibitors (lansoprazole or esomeprazole), potassium-competitive acid blockers (P-CAB), antacid and H2-antagonist and ulcer protective drugs such as sucralfate.
Factors driving the growth of duodenal ulcer market are H.pylori infection, change in lifestyle i.e. increase in the number of cigarette smokers, alcohol/tobacco consumers and significant increase food habits. Few medicines also cause this condition.
This report provides information on duodenal ulcer treatment market size for the year 2014-2016, and forecast of the same for year 2021. It also focuses on market drivers, challenges, restraints, market dynamics, growth indicators, competitive landscape, potential growth opportunities and other key aspects with respect to duodenal ulcer.
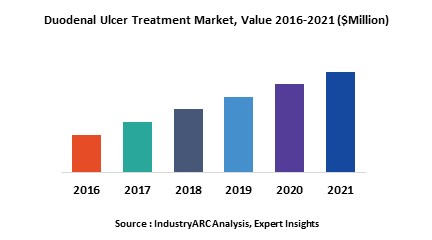
Globally demand for duodenal ulcer treatment is expected to witness growth due to increasing prevalence of the disease. North America and Europe combined and Asia Pacific alone accounted for 67% and 22% share respectively of overall market revenue in global peptic ulcer drugs market in 2014 and is predicted to add significant market share over the forecast period, due to increasing recurrence disease.
This report identifies global duodenal ulcer market on the basis of treatment type and regional market as follows:
- Duodenal ulcer treatment market is segmented based on different classes of drugs available for treatment: proton pump inhibitors (PPI), potassium-competitive acid blockers (P-CAB), antacids, ulcer protective drugs, H2-antagonists, antibiotics and surgery.
- This report has been further segmented into major regions, which include detailed analysis of each region such as: North America, Europe, Asia-Pacific (APAC), and Rest of the World (RoW) covering all the major country level markets in each of the region.
This report looks into all the major companies operating in the duodenal ulcer treatment. Some of the major companies’ profiles are as follows:
- GlaxoSmithKline
- Pfizer
- Abbott
- Merck and Co.
- Novartis AG
1. Duodenal Ulcer Treatment Market - Overview
1.1. Definitions and Scope
2. Duodenal Ulcer Treatment Market - Executive summary
2.1. Market Revenue, Market Size and Key Trends by Company
2.2. Key Trends by type of Application
2.3. Key Trends segmented by Geography
3. Duodenal Ulcer Treatment Market
3.1. Comparative analysis
3.1.1. Product Benchmarking - Top 10 companies
3.1.2. Top 5 Financials Analysis
3.1.3. Market Value split by Top 10 companies
3.1.4. Patent Analysis - Top 10 companies
3.1.5. Pricing Analysis
4. Duodenal Ulcer Treatment Market – Startup companies Scenario Premium
4.1. Top 10 startup company Analysis by
4.1.1. Investment
4.1.2. Revenue
4.1.3. Market Shares
4.1.4. Market Size and Application Analysis
4.1.5. Venture Capital and Funding Scenario
5. Duodenal Ulcer Treatment Market – Industry Market Entry Scenario Premium
5.1. Regulatory Framework Overview
5.2. New Business and Ease of Doing business index
5.3. Case studies of successful ventures
5.4. Customer Analysis – Top 10 companies
6. Duodenal Ulcer Treatment Market Forces
6.1. Drivers
6.2. Constraints
6.3. Challenges
6.4. Porters five force model
6.4.1. Bargaining power of suppliers
6.4.2. Bargaining powers of customers
6.4.3. Threat of new entrants
6.4.4. Rivalry among existing players
6.4.5. Threat of substitutes
7. Duodenal Ulcer Treatment Market - Strategic analysis
7.1. Value chain analysis
7.2. Opportunities analysis
7.3. Product life cycle
7.4. Suppliers and distributors Market Share
8. Duodenal Ulcer Treatment Market – By Treatment type (Market Size -$Million / $Billion)
8.1. Market Size and Market Share Analysis
8.2. Application Revenue and Trend Research
8.3. Product Segment Analysis
8.3.1. Antibiotics
8.3.2. Proton pump inhibitors
8.3.3. Antacids
8.3.4. Potassium-competitive acid blockers (P-CAB)
8.3.5. H2-antagonist
8.3.6. Ulcer protective drugs
8.3.7. Surgery
9. Duodenal Ulcer Treatment - By Geography (Market Size -$Million / $Billion)
9.1. Duodenal Ulcer Treatment Market - North America Segment Research
9.2. North America Market Research (Million / $Billion)
9.2.1. Segment type Size and Market Size Analysis
9.2.2. Revenue and Trends
9.2.3. Application Revenue and Trends by type of Application
9.2.4. Company Revenue and Product Analysis
9.2.5. North America Product type and Application Market Size
9.2.5.1. U.S.
9.2.5.2. Canada
9.2.5.3. Mexico
9.2.5.4. Rest of North America
9.3. Duodenal Ulcer Treatment - South America Segment Research
9.4. South America Market Research (Market Size -$Million / $Billion)
9.4.1. Segment type Size and Market Size Analysis
9.4.2. Revenue and Trends
9.4.3. Application Revenue and Trends by type of Application
9.4.4. Company Revenue and Product Analysis
9.4.5. South America Product type and Application Market Size
9.4.5.1. Brazil
9.4.5.2. Venezuela
9.4.5.3. Argentina
9.4.5.4. Ecuador
9.4.5.5. Peru
9.4.5.6. Colombia
9.4.5.7. Costa Rica
9.4.5.8. Rest of South America
9.5. Duodenal Ulcer Treatment - Europe Segment Research
9.6. Europe Market Research (Market Size -$Million / $Billion)
9.6.1. Segment type Size and Market Size Analysis
9.6.2. Revenue and Trends
9.6.3. Application Revenue and Trends by type of Application
9.6.4. Company Revenue and Product Analysis
9.6.5. Europe Segment Product type and Application Market Size
9.6.5.1. U.K
9.6.5.2. Germany
9.6.5.3. Italy
9.6.5.4. France
9.6.5.5. Netherlands
9.6.5.6. Belgium
9.6.5.7. Spain
9.6.5.8. Denmark
9.6.5.9. Rest of Europe
9.7. Duodenal Ulcer Treatment – APAC Segment Research
9.8. APAC Market Research (Market Size -$Million / $Billion)
9.8.1. Segment type Size and Market Size Analysis
9.8.2. Revenue and Trends
9.8.3. Application Revenue and Trends by type of Application
9.8.4. Company Revenue and Product Analysis
9.8.5. APAC Segment – Product type and Application Market Size
9.8.5.1. China
9.8.5.2. Australia
9.8.5.3. Japan
9.8.5.4. South Korea
9.8.5.5. India
9.8.5.6. Taiwan
9.8.5.7. Malaysia
10. Duodenal Ulcer Treatment Market - Entropy
10.1. New product launches
10.2. M&A's, collaborations, JVs and partnerships
11. Duodenal Ulcer Treatment Market – Industry / Segment Competition landscape Premium
11.1. Market Share Analysis
11.1.1. Market Share by Country- Top companies
11.1.2. Market Share by Region- Top 10 companies
11.1.3. Market Share by type of Application – Top 10 companies
11.1.4. Market Share by type of Product / Product category- Top 10 companies
11.1.5. Market Share at global level- Top 10 companies
11.1.6. Best Practises for companies
12. Duodenal Ulcer Treatment Market – Key Company List by Country Premium
13. Duodenal Ulcer Treatment Market Company Analysis
13.1. Market Share, Company Revenue, Products, M&A, Developments
13.2. GlaxoSmithKline
13.3. Pfizer Inc.
13.4. Abbott Laboratories
13.5. Merck and Co.
13.6. Nihon Pharmaceuticals Co., Ltd
13.7. Novartis AG
13.8. Bristol Meyer Squibb
13.9. AstraZeneca
13.10. Takeda
13.11. Ei sai Co., Ltd.
13.12. Company 11
13.13. Company 12
13.14. Company 13 and more
"*Financials would be provided on a best efforts basis for private companies"
14. Duodenal Ulcer Treatment Market - Appendix
14.1. Abbreviations
14.2. Sources
15. Duodenal Ulcer Treatment Market - Methodology
15.1. Research Methodology
15.1.1. Company Expert Interviews
15.1.2. Industry Databases
15.1.3. Associations
15.1.4. Company News
15.1.5. Company Annual Reports
15.1.6. Application Trends
15.1.7. New Products and Product database
15.1.8. Company Transcripts
15.1.9. R&D Trends
15.1.10. Key Opinion Leaders Interviews
15.1.11. Supply and Demand Trends
List of Tables:
Table 1 Duodenal Ulcer Treatment Market Overview 2023-2030
Table 2 Duodenal Ulcer Treatment Market Leader Analysis 2023-2030 (US$)
Table 3 Duodenal Ulcer Treatment MarketProduct Analysis 2023-2030 (US$)
Table 4 Duodenal Ulcer Treatment MarketEnd User Analysis 2023-2030 (US$)
Table 5 Duodenal Ulcer Treatment MarketPatent Analysis 2013-2023* (US$)
Table 6 Duodenal Ulcer Treatment MarketFinancial Analysis 2023-2030 (US$)
Table 7 Duodenal Ulcer Treatment Market Driver Analysis 2023-2030 (US$)
Table 8 Duodenal Ulcer Treatment MarketChallenges Analysis 2023-2030 (US$)
Table 9 Duodenal Ulcer Treatment MarketConstraint Analysis 2023-2030 (US$)
Table 10 Duodenal Ulcer Treatment Market Supplier Bargaining Power Analysis 2023-2030 (US$)
Table 11 Duodenal Ulcer Treatment Market Buyer Bargaining Power Analysis 2023-2030 (US$)
Table 12 Duodenal Ulcer Treatment Market Threat of Substitutes Analysis 2023-2030 (US$)
Table 13 Duodenal Ulcer Treatment Market Threat of New Entrants Analysis 2023-2030 (US$)
Table 14 Duodenal Ulcer Treatment Market Degree of Competition Analysis 2023-2030 (US$)
Table 15 Duodenal Ulcer Treatment MarketValue Chain Analysis 2023-2030 (US$)
Table 16 Duodenal Ulcer Treatment MarketPricing Analysis 2023-2030 (US$)
Table 17 Duodenal Ulcer Treatment MarketOpportunities Analysis 2023-2030 (US$)
Table 18 Duodenal Ulcer Treatment MarketProduct Life Cycle Analysis 2023-2030 (US$)
Table 19 Duodenal Ulcer Treatment MarketSupplier Analysis 2023-2030 (US$)
Table 20 Duodenal Ulcer Treatment MarketDistributor Analysis 2023-2030 (US$)
Table 21 Duodenal Ulcer Treatment Market Trend Analysis 2023-2030 (US$)
Table 22 Duodenal Ulcer Treatment Market Size 2023 (US$)
Table 23 Duodenal Ulcer Treatment Market Forecast Analysis 2023-2030 (US$)
Table 24 Duodenal Ulcer Treatment Market Sales Forecast Analysis 2023-2030 (Units)
Table 25 Duodenal Ulcer Treatment Market, Revenue & Volume,By Treatment type, 2023-2030 ($)
Table 26 Duodenal Ulcer Treatment MarketBy Treatment type, Revenue & Volume,By Antibiotics, 2023-2030 ($)
Table 27 Duodenal Ulcer Treatment MarketBy Treatment type, Revenue & Volume,By Proton pump inhibitors, 2023-2030 ($)
Table 28 Duodenal Ulcer Treatment MarketBy Treatment type, Revenue & Volume,By Antacids, 2023-2030 ($)
Table 29 Duodenal Ulcer Treatment MarketBy Treatment type, Revenue & Volume,By Potassium-competitive acid blockers (P-CAB), 2023-2030 ($)
Table 30 Duodenal Ulcer Treatment MarketBy Treatment type, Revenue & Volume,By H2-antagonist, 2023-2030 ($)
Table 31 North America Duodenal Ulcer Treatment Market, Revenue & Volume,By Treatment type, 2023-2030 ($)
Table 32 South america Duodenal Ulcer Treatment Market, Revenue & Volume,By Treatment type, 2023-2030 ($)
Table 33 Europe Duodenal Ulcer Treatment Market, Revenue & Volume,By Treatment type, 2023-2030 ($)
Table 34 APAC Duodenal Ulcer Treatment Market, Revenue & Volume,By Treatment type, 2023-2030 ($)
Table 35 Middle East & Africa Duodenal Ulcer Treatment Market, Revenue & Volume,By Treatment type, 2023-2030 ($)
Table 36 Russia Duodenal Ulcer Treatment Market, Revenue & Volume,By Treatment type, 2023-2030 ($)
Table 37 Israel Duodenal Ulcer Treatment Market, Revenue & Volume,By Treatment type, 2023-2030 ($)
Table 38 Top Companies 2023 (US$)Duodenal Ulcer Treatment Market, Revenue & Volume,,
Table 39 Product Launch 2023-2030Duodenal Ulcer Treatment Market, Revenue & Volume,,
Table 40 Mergers & Acquistions 2023-2030Duodenal Ulcer Treatment Market, Revenue & Volume,,
List of Figures:
Figure 1 Overview of Duodenal Ulcer Treatment Market 2023-2030
Figure 2 Market Share Analysis for Duodenal Ulcer Treatment Market 2023 (US$)
Figure 3 Product Comparison in Duodenal Ulcer Treatment Market 2023-2030 (US$)
Figure 4 End User Profile for Duodenal Ulcer Treatment Market 2023-2030 (US$)
Figure 5 Patent Application and Grant in Duodenal Ulcer Treatment Market 2013-2023* (US$)
Figure 6 Top 5 Companies Financial Analysis in Duodenal Ulcer Treatment Market 2023-2030 (US$)
Figure 7 Market Entry Strategy in Duodenal Ulcer Treatment Market 2023-2030
Figure 8 Ecosystem Analysis in Duodenal Ulcer Treatment Market2023
Figure 9 Average Selling Price in Duodenal Ulcer Treatment Market 2023-2030
Figure 10 Top Opportunites in Duodenal Ulcer Treatment Market 2023-2030
Figure 11 Market Life Cycle Analysis in Duodenal Ulcer Treatment Market
Figure 12 GlobalBy Treatment typeDuodenal Ulcer Treatment Market Revenue, 2023-2030 ($)
Figure 13 Global Duodenal Ulcer Treatment Market - By Geography
Figure 14 Global Duodenal Ulcer Treatment Market Value & Volume, By Geography, 2023-2030 ($)
Figure 15 Global Duodenal Ulcer Treatment Market CAGR, By Geography, 2023-2030 (%)
Figure 16 North America Duodenal Ulcer Treatment Market Value & Volume, 2023-2030 ($)
Figure 17 US Duodenal Ulcer Treatment Market Value & Volume, 2023-2030 ($)
Figure 18 US GDP and Population, 2023-2030 ($)
Figure 19 US GDP – Composition of 2023, By Sector of Origin
Figure 20 US Export and Import Value & Volume, 2023-2030 ($)
Figure 21 Canada Duodenal Ulcer Treatment Market Value & Volume, 2023-2030 ($)
Figure 22 Canada GDP and Population, 2023-2030 ($)
Figure 23 Canada GDP – Composition of 2023, By Sector of Origin
Figure 24 Canada Export and Import Value & Volume, 2023-2030 ($)
Figure 25 Mexico Duodenal Ulcer Treatment Market Value & Volume, 2023-2030 ($)
Figure 26 Mexico GDP and Population, 2023-2030 ($)
Figure 27 Mexico GDP – Composition of 2023, By Sector of Origin
Figure 28 Mexico Export and Import Value & Volume, 2023-2030 ($)
Figure 29 South America Duodenal Ulcer Treatment MarketSouth America 3D Printing Market Value & Volume, 2023-2030 ($)
Figure 30 Brazil Duodenal Ulcer Treatment Market Value & Volume, 2023-2030 ($)
Figure 31 Brazil GDP and Population, 2023-2030 ($)
Figure 32 Brazil GDP – Composition of 2023, By Sector of Origin
Figure 33 Brazil Export and Import Value & Volume, 2023-2030 ($)
Figure 34 Venezuela Duodenal Ulcer Treatment Market Value & Volume, 2023-2030 ($)
Figure 35 Venezuela GDP and Population, 2023-2030 ($)
Figure 36 Venezuela GDP – Composition of 2023, By Sector of Origin
Figure 37 Venezuela Export and Import Value & Volume, 2023-2030 ($)
Figure 38 Argentina Duodenal Ulcer Treatment Market Value & Volume, 2023-2030 ($)
Figure 39 Argentina GDP and Population, 2023-2030 ($)
Figure 40 Argentina GDP – Composition of 2023, By Sector of Origin
Figure 41 Argentina Export and Import Value & Volume, 2023-2030 ($)
Figure 42 Ecuador Duodenal Ulcer Treatment Market Value & Volume, 2023-2030 ($)
Figure 43 Ecuador GDP and Population, 2023-2030 ($)
Figure 44 Ecuador GDP – Composition of 2023, By Sector of Origin
Figure 45 Ecuador Export and Import Value & Volume, 2023-2030 ($)
Figure 46 Peru Duodenal Ulcer Treatment Market Value & Volume, 2023-2030 ($)
Figure 47 Peru GDP and Population, 2023-2030 ($)
Figure 48 Peru GDP – Composition of 2023, By Sector of Origin
Figure 49 Peru Export and Import Value & Volume, 2023-2030 ($)
Figure 50 Colombia Duodenal Ulcer Treatment Market Value & Volume, 2023-2030 ($)
Figure 51 Colombia GDP and Population, 2023-2030 ($)
Figure 52 Colombia GDP – Composition of 2023, By Sector of Origin
Figure 53 Colombia Export and Import Value & Volume, 2023-2030 ($)
Figure 54 Costa Rica Duodenal Ulcer Treatment MarketCosta Rica 3D Printing Market Value & Volume, 2023-2030 ($)
Figure 55 Costa Rica GDP and Population, 2023-2030 ($)
Figure 56 Costa Rica GDP – Composition of 2023, By Sector of Origin
Figure 57 Costa Rica Export and Import Value & Volume, 2023-2030 ($)
Figure 58 Europe Duodenal Ulcer Treatment Market Value & Volume, 2023-2030 ($)
Figure 59 U.K Duodenal Ulcer Treatment Market Value & Volume, 2023-2030 ($)
Figure 60 U.K GDP and Population, 2023-2030 ($)
Figure 61 U.K GDP – Composition of 2023, By Sector of Origin
Figure 62 U.K Export and Import Value & Volume, 2023-2030 ($)
Figure 63 Germany Duodenal Ulcer Treatment Market Value & Volume, 2023-2030 ($)
Figure 64 Germany GDP and Population, 2023-2030 ($)
Figure 65 Germany GDP – Composition of 2023, By Sector of Origin
Figure 66 Germany Export and Import Value & Volume, 2023-2030 ($)
Figure 67 Italy Duodenal Ulcer Treatment Market Value & Volume, 2023-2030 ($)
Figure 68 Italy GDP and Population, 2023-2030 ($)
Figure 69 Italy GDP – Composition of 2023, By Sector of Origin
Figure 70 Italy Export and Import Value & Volume, 2023-2030 ($)
Figure 71 France Duodenal Ulcer Treatment Market Value & Volume, 2023-2030 ($)
Figure 72 France GDP and Population, 2023-2030 ($)
Figure 73 France GDP – Composition of 2023, By Sector of Origin
Figure 74 France Export and Import Value & Volume, 2023-2030 ($)
Figure 75 Netherlands Duodenal Ulcer Treatment Market Value & Volume, 2023-2030 ($)
Figure 76 Netherlands GDP and Population, 2023-2030 ($)
Figure 77 Netherlands GDP – Composition of 2023, By Sector of Origin
Figure 78 Netherlands Export and Import Value & Volume, 2023-2030 ($)
Figure 79 Belgium Duodenal Ulcer Treatment Market Value & Volume, 2023-2030 ($)
Figure 80 Belgium GDP and Population, 2023-2030 ($)
Figure 81 Belgium GDP – Composition of 2023, By Sector of Origin
Figure 82 Belgium Export and Import Value & Volume, 2023-2030 ($)
Figure 83 Spain Duodenal Ulcer Treatment Market Value & Volume, 2023-2030 ($)
Figure 84 Spain GDP and Population, 2023-2030 ($)
Figure 85 Spain GDP – Composition of 2023, By Sector of Origin
Figure 86 Spain Export and Import Value & Volume, 2023-2030 ($)
Figure 87 Denmark Duodenal Ulcer Treatment Market Value & Volume, 2023-2030 ($)
Figure 88 Denmark GDP and Population, 2023-2030 ($)
Figure 89 Denmark GDP – Composition of 2023, By Sector of Origin
Figure 90 Denmark Export and Import Value & Volume, 2023-2030 ($)
Figure 91 APAC Duodenal Ulcer Treatment Market Value & Volume, 2023-2030 ($)
Figure 92 China Duodenal Ulcer Treatment MarketValue & Volume, 2023-2030
Figure 93 China GDP and Population, 2023-2030 ($)
Figure 94 China GDP – Composition of 2023, By Sector of Origin
Figure 95 China Export and Import Value & Volume, 2023-2030 ($)Duodenal Ulcer Treatment MarketChina Export and Import Value & Volume, 2023-2030 ($)
Figure 96 Australia Duodenal Ulcer Treatment Market Value & Volume, 2023-2030 ($)
Figure 97 Australia GDP and Population, 2023-2030 ($)
Figure 98 Australia GDP – Composition of 2023, By Sector of Origin
Figure 99 Australia Export and Import Value & Volume, 2023-2030 ($)
Figure 100 South Korea Duodenal Ulcer Treatment Market Value & Volume, 2023-2030 ($)
Figure 101 South Korea GDP and Population, 2023-2030 ($)
Figure 102 South Korea GDP – Composition of 2023, By Sector of Origin
Figure 103 South Korea Export and Import Value & Volume, 2023-2030 ($)
Figure 104 India Duodenal Ulcer Treatment Market Value & Volume, 2023-2030 ($)
Figure 105 India GDP and Population, 2023-2030 ($)
Figure 106 India GDP – Composition of 2023, By Sector of Origin
Figure 107 India Export and Import Value & Volume, 2023-2030 ($)
Figure 108 Taiwan Duodenal Ulcer Treatment MarketTaiwan 3D Printing Market Value & Volume, 2023-2030 ($)
Figure 109 Taiwan GDP and Population, 2023-2030 ($)
Figure 110 Taiwan GDP – Composition of 2023, By Sector of Origin
Figure 111 Taiwan Export and Import Value & Volume, 2023-2030 ($)
Figure 112 Malaysia Duodenal Ulcer Treatment MarketMalaysia 3D Printing Market Value & Volume, 2023-2030 ($)
Figure 113 Malaysia GDP and Population, 2023-2030 ($)
Figure 114 Malaysia GDP – Composition of 2023, By Sector of Origin
Figure 115 Malaysia Export and Import Value & Volume, 2023-2030 ($)
Figure 116 Hong Kong Duodenal Ulcer Treatment MarketHong Kong 3D Printing Market Value & Volume, 2023-2030 ($)
Figure 117 Hong Kong GDP and Population, 2023-2030 ($)
Figure 118 Hong Kong GDP – Composition of 2023, By Sector of Origin
Figure 119 Hong Kong Export and Import Value & Volume, 2023-2030 ($)
Figure 120 Middle East & Africa Duodenal Ulcer Treatment MarketMiddle East & Africa 3D Printing Market Value & Volume, 2023-2030 ($)
Figure 121 Russia Duodenal Ulcer Treatment MarketRussia 3D Printing Market Value & Volume, 2023-2030 ($)
Figure 122 Russia GDP and Population, 2023-2030 ($)
Figure 123 Russia GDP – Composition of 2023, By Sector of Origin
Figure 124 Russia Export and Import Value & Volume, 2023-2030 ($)
Figure 125 Israel Duodenal Ulcer Treatment Market Value & Volume, 2023-2030 ($)
Figure 126 Israel GDP and Population, 2023-2030 ($)
Figure 127 Israel GDP – Composition of 2023, By Sector of Origin
Figure 128 Israel Export and Import Value & Volume, 2023-2030 ($)
Figure 129 Entropy Share, By Strategies, 2023-2030* (%)Duodenal Ulcer Treatment Market
Figure 130 Developments, 2023-2030*Duodenal Ulcer Treatment Market
Figure 131 Company 1 Duodenal Ulcer Treatment Market Net Revenue, By Years, 2023-2030* ($)
Figure 132 Company 1 Duodenal Ulcer Treatment Market Net Revenue Share, By Business segments, 2023 (%)
Figure 133 Company 1 Duodenal Ulcer Treatment Market Net Sales Share, By Geography, 2023 (%)
Figure 134 Company 2 Duodenal Ulcer Treatment Market Net Revenue, By Years, 2023-2030* ($)
Figure 135 Company 2 Duodenal Ulcer Treatment Market Net Revenue Share, By Business segments, 2023 (%)
Figure 136 Company 2 Duodenal Ulcer Treatment Market Net Sales Share, By Geography, 2023 (%)
Figure 137 Company 3Duodenal Ulcer Treatment Market Net Revenue, By Years, 2023-2030* ($)
Figure 138 Company 3Duodenal Ulcer Treatment Market Net Revenue Share, By Business segments, 2023 (%)
Figure 139 Company 3Duodenal Ulcer Treatment Market Net Sales Share, By Geography, 2023 (%)
Figure 140 Company 4 Duodenal Ulcer Treatment Market Net Revenue, By Years, 2023-2030* ($)
Figure 141 Company 4 Duodenal Ulcer Treatment Market Net Revenue Share, By Business segments, 2023 (%)
Figure 142 Company 4 Duodenal Ulcer Treatment Market Net Sales Share, By Geography, 2023 (%)
Figure 143 Company 5 Duodenal Ulcer Treatment Market Net Revenue, By Years, 2023-2030* ($)
Figure 144 Company 5 Duodenal Ulcer Treatment Market Net Revenue Share, By Business segments, 2023 (%)
Figure 145 Company 5 Duodenal Ulcer Treatment Market Net Sales Share, By Geography, 2023 (%)
Figure 146 Company 6 Duodenal Ulcer Treatment Market Net Revenue, By Years, 2023-2030* ($)
Figure 147 Company 6 Duodenal Ulcer Treatment Market Net Revenue Share, By Business segments, 2023 (%)
Figure 148 Company 6 Duodenal Ulcer Treatment Market Net Sales Share, By Geography, 2023 (%)
Figure 149 Company 7 Duodenal Ulcer Treatment Market Net Revenue, By Years, 2023-2030* ($)
Figure 150 Company 7 Duodenal Ulcer Treatment Market Net Revenue Share, By Business segments, 2023 (%)
Figure 151 Company 7 Duodenal Ulcer Treatment Market Net Sales Share, By Geography, 2023 (%)
Figure 152 Company 8 Duodenal Ulcer Treatment Market Net Revenue, By Years, 2023-2030* ($)
Figure 153 Company 8 Duodenal Ulcer Treatment Market Net Revenue Share, By Business segments, 2023 (%)
Figure 154 Company 8 Duodenal Ulcer Treatment Market Net Sales Share, By Geography, 2023 (%)
Figure 155 Company 9 Duodenal Ulcer Treatment Market Net Revenue, By Years, 2023-2030* ($)
Figure 156 Company 9 Duodenal Ulcer Treatment Market Net Revenue Share, By Business segments, 2023 (%)
Figure 157 Company 9 Duodenal Ulcer Treatment Market Net Sales Share, By Geography, 2023 (%)
Figure 158 Company 10 Duodenal Ulcer Treatment Market Net Revenue, By Years, 2023-2030* ($)
Figure 159 Company 10 Duodenal Ulcer Treatment Market Net Revenue Share, By Business segments, 2023 (%)
Figure 160 Company 10 Duodenal Ulcer Treatment Market Net Sales Share, By Geography, 2023 (%)
Figure 161 Company 11 Duodenal Ulcer Treatment Market Net Revenue, By Years, 2023-2030* ($)
Figure 162 Company 11 Duodenal Ulcer Treatment Market Net Revenue Share, By Business segments, 2023 (%)
Figure 163 Company 11 Duodenal Ulcer Treatment Market Net Sales Share, By Geography, 2023 (%)
Figure 164 Company 12 Duodenal Ulcer Treatment Market Net Revenue, By Years, 2023-2030* ($)
Figure 165 Company 12 Duodenal Ulcer Treatment Market Net Revenue Share, By Business segments, 2023 (%)
Figure 166 Company 12 Duodenal Ulcer Treatment Market Net Sales Share, By Geography, 2023 (%)
Figure 167 Company 13Duodenal Ulcer Treatment Market Net Revenue, By Years, 2023-2030* ($)
Figure 168 Company 13Duodenal Ulcer Treatment Market Net Revenue Share, By Business segments, 2023 (%)
Figure 169 Company 13Duodenal Ulcer Treatment Market Net Sales Share, By Geography, 2023 (%)
Figure 170 Company 14 Duodenal Ulcer Treatment Market Net Revenue, By Years, 2023-2030* ($)
Figure 171 Company 14 Duodenal Ulcer Treatment Market Net Revenue Share, By Business segments, 2023 (%)
Figure 172 Company 14 Duodenal Ulcer Treatment Market Net Sales Share, By Geography, 2023 (%)
Figure 173 Company 15 Duodenal Ulcer Treatment Market Net Revenue, By Years, 2023-2030* ($)
Figure 174 Company 15 Duodenal Ulcer Treatment Market Net Revenue Share, By Business segments, 2023 (%)
Figure 175 Company 15 Duodenal Ulcer Treatment Market Net Sales Share, By Geography, 2023 (%)