 Email
Email Print
Print


Electromechanical relay Market - Forecast(2024 - 2030)
Electromechanical relay is typically a switch, necessary to control high power devices. The switch is actuated by electric current flow, causing opening or closing of the circuit. The sensing unit in the relay is connected to AC or DC current, the power supplied generates a magnetic force which controls the switch mechanism in the circuit.
Electromechanical relay market can be categorized based on type. Reed relays, heavy duty and high voltage relays and aerospace relays are few types.
Electromechanical relay is used in various appliances. The functions of the relay are as follows:
- On/Off control: In limiting and controlling high power load, such as in air conditioners, compressor in this device works as a relay
- Limit control: As an optimum motor speed controller
- Logic operation: Performs some logical operations
Electromechanical relay have an advantage of being low cost, non-heat sink, multiple poled and can be switched between AC and DC current with equal ease.
In general electrical devices requires electromechanical relay for their functioning. Hence, relays have numerous applications. Their use has seen importance mainly in aerospace, wireless technology, railways routing and signaling, automation and controls, etc.
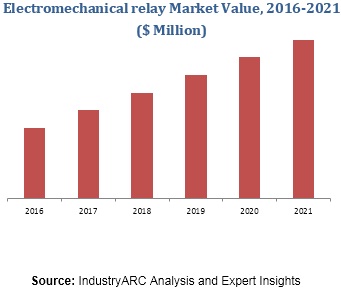
This report provides information on electromechanical relay market size for the year 2014-2016, and forecast of the same for year 2021. It also focuses on market drivers, challenges, restraints, market dynamics, growth indicators, competitive landscape, potential growth opportunities and other key aspects with respect to electromechanical relay market.
A growing population and emerging economy are contributing to the increased consumption of various utensils made of electromechanical relay. Market of electromechanical relay is on rise in APAC region, as the demand for electricity is increasing. Largely, this demand is emerging from China, Japan and India.
The acceptance of solar projects is growing globally, which indeed is increasing the demand for electromechanical relay.
This report identifies electromechanical relay market on the basis of type, application and regional market:
- Based on type of electromechanical relay
- Based on its application in various industries
- This report is further segmented based on potential markets for electromechanical relay. A detailed analysis by region – North America, Europe, Asia Pacific (APAC) and Rest of the World (RoW), has been provided in this report.
This report looks into all the major companies operating in the electromechanical relay market. Some of the major companies’ profiles are as follows:
- Struthers-Dunn
- Omron corp.
- Siemens
- Schneider Electric
- Fujitsu Ltd
1. Electromechanical relay - Market Overview
2. Executive Summary
3. Electromechanical relay - Market landscape
3.1. Market Share Analysis
3.2. Comparative Analysis
3.2.1. Product Benchmarking
3.2.2. End User Profiling
3.2.3. Top 5 Financial analysis
4. Electromechanical relay - Market Forces
4.1. Market Drivers
4.1.1. Growing demand in the Asia-Pacific region
4.2. Market Constraints
4.3. Market Opportunities
4.4. Market Challenges
4.5. Porter’s Five Force Analysis
4.5.1. Bargaining Power of Suppliers
4.5.2. Bargaining Power of Customers
4.5.3. Threat of New Entrants
4.5.4. Threat of substitution
4.5.5. Degree of Competition
5. Electromechanical relay Market – Strategic Analysis
5.1. Value Chain Analysis
5.2. Pricing Analysis
5.3. Opportunities Analysis
5.4. Product/Market Life Cycle Analysis
5.5. Suppliers and Distributors
6. Electromechanical relay Market - By Type
6.1. Reed relays
6.2. Heavy duty and high voltage relays
6.3. Aerospace relays
6.4. Others
7. Electromechanical relay Market – By Application
7.1. Aerospace
7.2. Automation and controls
7.3. Wireless technology
7.4. Railways routing and signaling
7.5. Others
8. Electromechanical relay Market – By Geography
8.1. Introduction
8.2. North America
8.2.1. US
8.2.2. Canada
8.2.3. Mexico
8.3. Europe
8.3.1. France
8.3.2. Germany
8.3.3. U.K.
8.3.4. Others
8.4. APAC
8.4.1. China
8.4.2. India
8.4.3. Japan
8.4.4. South Korea
8.4.5. Others
8.5. ROW
9. Market Entropy
9.1. Expansion
9.2. Technological Developments
9.3. Merger & Acquisitions, and Joint Ventures
9.4. Supply - Contract
10. Company Profiles (Introduction, Financials, Key Insights, Key Strategy, Product Portfolio, SWOT Analysis)
10.1. Company 1
10.2. Company 2
10.3. Company 3
10.4. Company 4
10.5. Company 5
10.6. Company 6
10.7. Company 7
10.8. Company 8
10.9. Company 9
10.10. Company 10
10.2. Company 2
10.3. Company 3
10.4. Company 4
10.5. Company 5
10.6. Company 6
10.7. Company 7
10.8. Company 8
10.9. Company 9
10.10. Company 10
*More than 10 Companies are profiled in this Research Report*
"*Financials would be provided on a best efforts basis for private companies"
11. Appendix
11.1. Abbreviations
11.2. Sources
11.3. Research Methodology
11.4. Expert Insights
List of Tables:
Table 1: Electromechanical relay Market Overview 2023-2030
Table 2: Electromechanical relay Market Leader Analysis 2023-2030 (US$)
Table 3: Electromechanical relay Market Product Analysis 2023-2030 (US$)
Table 4: Electromechanical relay Market End User Analysis 2023-2030 (US$)
Table 5: Electromechanical relay Market Patent Analysis 2013-2023* (US$)
Table 6: Electromechanical relay Market Financial Analysis 2023-2030 (US$)
Table 7: Electromechanical relay Market Driver Analysis 2023-2030 (US$)
Table 8: Electromechanical relay Market Challenges Analysis 2023-2030 (US$)
Table 9: Electromechanical relay Market Constraint Analysis 2023-2030 (US$)
Table 10: Electromechanical relay Market Supplier Bargaining Power Analysis 2023-2030 (US$)
Table 11: Electromechanical relay Market Buyer Bargaining Power Analysis 2023-2030 (US$)
Table 12: Electromechanical relay Market Threat of Substitutes Analysis 2023-2030 (US$)
Table 13: Electromechanical relay Market Threat of New Entrants Analysis 2023-2030 (US$)
Table 14: Electromechanical relay Market Degree of Competition Analysis 2023-2030 (US$)
Table 15: Electromechanical relay Market Value Chain Analysis 2023-2030 (US$)
Table 16: Electromechanical relay Market Pricing Analysis 2023-2030 (US$)
Table 17: Electromechanical relay Market Opportunities Analysis 2023-2030 (US$)
Table 18: Electromechanical relay Market Product Life Cycle Analysis 2023-2030 (US$)
Table 19: Electromechanical relay Market Supplier Analysis 2023-2030 (US$)
Table 20: Electromechanical relay Market Distributor Analysis 2023-2030 (US$)
Table 21: Electromechanical relay Market Trend Analysis 2023-2030 (US$)
Table 22: Electromechanical relay Market Size 2023 (US$)
Table 23: Electromechanical relay Market Forecast Analysis 2023-2030 (US$)
Table 24: Electromechanical relay Market Sales Forecast Analysis 2023-2030 (Units)
Table 25: Electromechanical relay Market, Revenue & Volume, By Type, 2023-2030 ($)
Table 26: Electromechanical relay Market By Type, Revenue & Volume, By Reed relays, 2023-2030 ($)
Table 27: Electromechanical relay Market By Type, Revenue & Volume, By Heavy duty and high voltage relays, 2023-2030 ($)
Table 28: Electromechanical relay Market By Type, Revenue & Volume, By Aerospace relays, 2023-2030 ($)
Table 29: Electromechanical relay Market, Revenue & Volume, By Application, 2023-2030 ($)
Table 30: Electromechanical relay Market By Application, Revenue & Volume, By Aerospace relays, 2023-2030 ($)
Table 31: Electromechanical relay Market By Application, Revenue & Volume, By Automation and controls, 2023-2030 ($)
Table 32: Electromechanical relay Market By Application, Revenue & Volume, By Wireless technology, 2023-2030 ($)
Table 33: Electromechanical relay Market By Application, Revenue & Volume, By Railways routing and signaling, 2023-2030 ($)
Table 34: North America Electromechanical relay Market, Revenue & Volume, By Type, 2023-2030 ($)
Table 35: North America Electromechanical relay Market, Revenue & Volume, By Application, 2023-2030 ($)
Table 36: South america Electromechanical relay Market, Revenue & Volume, By Type, 2023-2030 ($)
Table 37: South america Electromechanical relay Market, Revenue & Volume, By Application, 2023-2030 ($)
Table 38: Europe Electromechanical relay Market, Revenue & Volume, By Type, 2023-2030 ($)
Table 39: Europe Electromechanical relay Market, Revenue & Volume, By Application, 2023-2030 ($)
Table 40: APAC Electromechanical relay Market, Revenue & Volume, By Type, 2023-2030 ($)
Table 41: APAC Electromechanical relay Market, Revenue & Volume, By Application, 2023-2030 ($)
Table 42: Middle East & Africa Electromechanical relay Market, Revenue & Volume, By Type, 2023-2030 ($)
Table 43: Middle East & Africa Electromechanical relay Market, Revenue & Volume, By Application, 2023-2030 ($)
Table 44: Russia Electromechanical relay Market, Revenue & Volume, By Type, 2023-2030 ($)
Table 45: Russia Electromechanical relay Market, Revenue & Volume, By Application, 2023-2030 ($)
Table 46: Israel Electromechanical relay Market, Revenue & Volume, By Type, 2023-2030 ($)
Table 47: Israel Electromechanical relay Market, Revenue & Volume, By Application, 2023-2030 ($)
Table 48: Top Companies 2023 (US$)Electromechanical relay Market, Revenue & Volume
Table 49: Product Launch 2023-2030Electromechanical relay Market, Revenue & Volume
Table 50: Mergers & Acquistions 2023-2030Electromechanical relay Market, Revenue & Volume
List of Figures:
Figure 1: Overview of Electromechanical relay Market 2023-2030
Figure 2: Market Share Analysis for Electromechanical relay Market 2023 (US$)
Figure 3: Product Comparison in Electromechanical relay Market 2023-2030 (US$)
Figure 4: End User Profile for Electromechanical relay Market 2023-2030 (US$)
Figure 5: Patent Application and Grant in Electromechanical relay Market 2013-2023* (US$)
Figure 6: Top 5 Companies Financial Analysis in Electromechanical relay Market 2023-2030 (US$)
Figure 7: Market Entry Strategy in Electromechanical relay Market 2023-2030
Figure 8: Ecosystem Analysis in Electromechanical relay Market 2023
Figure 9: Average Selling Price in Electromechanical relay Market 2023-2030
Figure 10: Top Opportunites in Electromechanical relay Market 2023-2030
Figure 11: Market Life Cycle Analysis in Electromechanical relay Market
Figure 12: GlobalBy TypeElectromechanical relay Market Revenue, 2023-2030 ($)
Figure 13: GlobalBy ApplicationElectromechanical relay Market Revenue, 2023-2030 ($)
Figure 14: Global Electromechanical relay Market - By Geography
Figure 15: Global Electromechanical relay Market Value & Volume, By Geography, 2023-2030 ($)
Figure 16: Global Electromechanical relay Market CAGR, By Geography, 2023-2030 (%)
Figure 17: North America Electromechanical relay Market Value & Volume, 2023-2030 ($)
Figure 18: US Electromechanical relay Market Value & Volume, 2023-2030 ($)
Figure 19: US GDP and Population, 2023-2030 ($)
Figure 20: US GDP – Composition of 2023, By Sector of Origin
Figure 21: US Export and Import Value & Volume, 2023-2030 ($)
Figure 22: Canada Electromechanical relay Market Value & Volume, 2023-2030 ($)
Figure 23: Canada GDP and Population, 2023-2030 ($)
Figure 24: Canada GDP – Composition of 2023, By Sector of Origin
Figure 25: Canada Export and Import Value & Volume, 2023-2030 ($)
Figure 26: Mexico Electromechanical relay Market Value & Volume, 2023-2030 ($)
Figure 27: Mexico GDP and Population, 2023-2030 ($)
Figure 28: Mexico GDP – Composition of 2023, By Sector of Origin
Figure 29: Mexico Export and Import Value & Volume, 2023-2030 ($)
Figure 30: South America Electromechanical relay Market Value & Volume, 2023-2030 ($)
Figure 31: Brazil Electromechanical relay Market Value & Volume, 2023-2030 ($)
Figure 32: Brazil GDP and Population, 2023-2030 ($)
Figure 33: Brazil GDP – Composition of 2023, By Sector of Origin
Figure 34: Brazil Export and Import Value & Volume, 2023-2030 ($)
Figure 35: Venezuela Electromechanical relay Market Value & Volume, 2023-2030 ($)
Figure 36: Venezuela GDP and Population, 2023-2030 ($)
Figure 37: Venezuela GDP – Composition of 2023, By Sector of Origin
Figure 38: Venezuela Export and Import Value & Volume, 2023-2030 ($)
Figure 39: Argentina Electromechanical relay Market Value & Volume, 2023-2030 ($)
Figure 40: Argentina GDP and Population, 2023-2030 ($)
Figure 41: Argentina GDP – Composition of 2023, By Sector of Origin
Figure 42: Argentina Export and Import Value & Volume, 2023-2030 ($)
Figure 43: Ecuador Electromechanical relay Market Value & Volume, 2023-2030 ($)
Figure 44: Ecuador GDP and Population, 2023-2030 ($)
Figure 45: Ecuador GDP – Composition of 2023, By Sector of Origin
Figure 46: Ecuador Export and Import Value & Volume, 2023-2030 ($)
Figure 47: Peru Electromechanical relay Market Value & Volume, 2023-2030 ($)
Figure 48: Peru GDP and Population, 2023-2030 ($)
Figure 49: Peru GDP – Composition of 2023, By Sector of Origin
Figure 50: Peru Export and Import Value & Volume, 2023-2030 ($)
Figure 51: Colombia Electromechanical relay Market Value & Volume, 2023-2030 ($)
Figure 52: Colombia GDP and Population, 2023-2030 ($)
Figure 53: Colombia GDP – Composition of 2023, By Sector of Origin
Figure 54: Colombia Export and Import Value & Volume, 2023-2030 ($)
Figure 55: Costa Rica Electromechanical relay Market Value & Volume, 2023-2030 ($)
Figure 56: Costa Rica GDP and Population, 2023-2030 ($)
Figure 57: Costa Rica GDP – Composition of 2023, By Sector of Origin
Figure 58: Costa Rica Export and Import Value & Volume, 2023-2030 ($)
Figure 59: Europe Electromechanical relay Market Value & Volume, 2023-2030 ($)
Figure 60: U.K Electromechanical relay Market Value & Volume, 2023-2030 ($)
Figure 61: U.K GDP and Population, 2023-2030 ($)
Figure 62: U.K GDP – Composition of 2023, By Sector of Origin
Figure 63: U.K Export and Import Value & Volume, 2023-2030 ($)
Figure 64: Germany Electromechanical relay Market Value & Volume, 2023-2030 ($)
Figure 65: Germany GDP and Population, 2023-2030 ($)
Figure 66: Germany GDP – Composition of 2023, By Sector of Origin
Figure 67: Germany Export and Import Value & Volume, 2023-2030 ($)
Figure 68: Italy Electromechanical relay Market Value & Volume, 2023-2030 ($)
Figure 69: Italy GDP and Population, 2023-2030 ($)
Figure 70: Italy GDP – Composition of 2023, By Sector of Origin
Figure 71: Italy Export and Import Value & Volume, 2023-2030 ($)
Figure 72: France Electromechanical relay Market Value & Volume, 2023-2030 ($)
Figure 73: France GDP and Population, 2023-2030 ($)
Figure 74: France GDP – Composition of 2023, By Sector of Origin
Figure 75: France Export and Import Value & Volume, 2023-2030 ($)
Figure 76: Netherlands Electromechanical relay Market Value & Volume, 2023-2030 ($)
Figure 77: Netherlands GDP and Population, 2023-2030 ($)
Figure 78: Netherlands GDP – Composition of 2023, By Sector of Origin
Figure 79: Netherlands Export and Import Value & Volume, 2023-2030 ($)
Figure 80: Belgium Electromechanical relay Market Value & Volume, 2023-2030 ($)
Figure 81: Belgium GDP and Population, 2023-2030 ($)
Figure 82: Belgium GDP – Composition of 2023, By Sector of Origin
Figure 83: Belgium Export and Import Value & Volume, 2023-2030 ($)
Figure 84: Spain Electromechanical relay Market Value & Volume, 2023-2030 ($)
Figure 85: Spain GDP and Population, 2023-2030 ($)
Figure 86: Spain GDP – Composition of 2023, By Sector of Origin
Figure 87: Spain Export and Import Value & Volume, 2023-2030 ($)
Figure 88: Denmark Electromechanical relay Market Value & Volume, 2023-2030 ($)
Figure 89: Denmark GDP and Population, 2023-2030 ($)
Figure 90: Denmark GDP – Composition of 2023, By Sector of Origin
Figure 91: Denmark Export and Import Value & Volume, 2023-2030 ($)
Figure 92: APAC Electromechanical relay Market Value & Volume, 2023-2030 ($)
Figure 93: China Electromechanical relay Market Value & Volume, 2023-2030
Figure 94: China GDP and Population, 2023-2030 ($)
Figure 95: China GDP – Composition of 2023, By Sector of Origin
Figure 96: China Export and Import Value & Volume, 2023-2030 ($)Electromechanical relay Market China Export and Import Value & Volume, 2023-2030 ($)
Figure 97: Australia Electromechanical relay Market Value & Volume, 2023-2030 ($)
Figure 98: Australia GDP and Population, 2023-2030 ($)
Figure 99: Australia GDP – Composition of 2023, By Sector of Origin
Figure 100: Australia Export and Import Value & Volume, 2023-2030 ($)
Figure 101: South Korea Electromechanical relay Market Value & Volume, 2023-2030 ($)
Figure 102: South Korea GDP and Population, 2023-2030 ($)
Figure 103: South Korea GDP – Composition of 2023, By Sector of Origin
Figure 104: South Korea Export and Import Value & Volume, 2023-2030 ($)
Figure 105: India Electromechanical relay Market Value & Volume, 2023-2030 ($)
Figure 106: India GDP and Population, 2023-2030 ($)
Figure 107: India GDP – Composition of 2023, By Sector of Origin
Figure 108: India Export and Import Value & Volume, 2023-2030 ($)
Figure 109: Taiwan Electromechanical relay Market Value & Volume, 2023-2030 ($)
Figure 110: Taiwan GDP and Population, 2023-2030 ($)
Figure 111: Taiwan GDP – Composition of 2023, By Sector of Origin
Figure 112: Taiwan Export and Import Value & Volume, 2023-2030 ($)
Figure 113: Malaysia Electromechanical relay Market Value & Volume, 2023-2030 ($)
Figure 114: Malaysia GDP and Population, 2023-2030 ($)
Figure 115: Malaysia GDP – Composition of 2023, By Sector of Origin
Figure 116: Malaysia Export and Import Value & Volume, 2023-2030 ($)
Figure 117: Hong Kong Electromechanical relay Market Value & Volume, 2023-2030 ($)
Figure 118: Hong Kong GDP and Population, 2023-2030 ($)
Figure 119: Hong Kong GDP – Composition of 2023, By Sector of Origin
Figure 120: Hong Kong Export and Import Value & Volume, 2023-2030 ($)
Figure 121: Middle East & Africa Electromechanical relay Market Middle East & Africa 3D Printing Market Value & Volume, 2023-2030 ($)
Figure 122: Russia Electromechanical relay Market Value & Volume, 2023-2030 ($)
Figure 123: Russia GDP and Population, 2023-2030 ($)
Figure 124: Russia GDP – Composition of 2023, By Sector of Origin
Figure 125: Russia Export and Import Value & Volume, 2023-2030 ($)
Figure 126: Israel Electromechanical relay Market Value & Volume, 2023-2030 ($)
Figure 127: Israel GDP and Population, 2023-2030 ($)
Figure 128: Israel GDP – Composition of 2023, By Sector of Origin
Figure 129: Israel Export and Import Value & Volume, 2023-2030 ($)
Figure 130: Entropy Share, By Strategies, 2023-2030* (%)Electromechanical relay Market
Figure 131: Developments, 2023-2030*Electromechanical relay Market
Figure 132: Company 1 Electromechanical relay Market Net Revenue, By Years, 2023-2030* ($)
Figure 133: Company 1 Electromechanical relay Market Net Revenue Share, By Business segments, 2023 (%)
Figure 134: Company 1 Electromechanical relay Market Net Sales Share, By Geography, 2023 (%)
Figure 135: Company 2 Electromechanical relay Market Net Revenue, By Years, 2023-2030* ($)
Figure 136: Company 2 Electromechanical relay Market Net Revenue Share, By Business segments, 2023 (%)
Figure 137: Company 2 Electromechanical relay Market Net Sales Share, By Geography, 2023 (%)
Figure 138: Company 3 Electromechanical relay Market Net Revenue, By Years, 2023-2030* ($)
Figure 139: Company 3 Electromechanical relay Market Net Revenue Share, By Business segments, 2023 (%)
Figure 140: Company 3 Electromechanical relay Market Net Sales Share, By Geography, 2023 (%)
Figure 141: Company 4 Electromechanical relay Market Net Revenue, By Years, 2023-2030* ($)
Figure 142: Company 4 Electromechanical relay Market Net Revenue Share, By Business segments, 2023 (%)
Figure 143: Company 4 Electromechanical relay Market Net Sales Share, By Geography, 2023 (%)
Figure 144: Company 5 Electromechanical relay Market Net Revenue, By Years, 2023-2030* ($)
Figure 145: Company 5 Electromechanical relay Market Net Revenue Share, By Business segments, 2023 (%)
Figure 146: Company 5 Electromechanical relay Market Net Sales Share, By Geography, 2023 (%)
Figure 147: Company 6 Electromechanical relay Market Net Revenue, By Years, 2023-2030* ($)
Figure 148: Company 6 Electromechanical relay Market Net Revenue Share, By Business segments, 2023 (%)
Figure 149: Company 6 Electromechanical relay Market Net Sales Share, By Geography, 2023 (%)
Figure 150: Company 7 Electromechanical relay Market Net Revenue, By Years, 2023-2030* ($)
Figure 151: Company 7 Electromechanical relay Market Net Revenue Share, By Business segments, 2023 (%)
Figure 152: Company 7 Electromechanical relay Market Net Sales Share, By Geography, 2023 (%)
Figure 153: Company 8 Electromechanical relay Market Net Revenue, By Years, 2023-2030* ($)
Figure 154: Company 8 Electromechanical relay Market Net Revenue Share, By Business segments, 2023 (%)
Figure 155: Company 8 Electromechanical relay Market Net Sales Share, By Geography, 2023 (%)
Figure 156: Company 9 Electromechanical relay Market Net Revenue, By Years, 2023-2030* ($)
Figure 157: Company 9 Electromechanical relay Market Net Revenue Share, By Business segments, 2023 (%)
Figure 158: Company 9 Electromechanical relay Market Net Sales Share, By Geography, 2023 (%)
Figure 159: Company 10 Electromechanical relay Market Net Revenue, By Years, 2023-2030* ($)
Figure 160: Company 10 Electromechanical relay Market Net Revenue Share, By Business segments, 2023 (%)
Figure 161: Company 10 Electromechanical relay Market Net Sales Share, By Geography, 2023 (%)
Figure 162: Company 11 Electromechanical relay Market Net Revenue, By Years, 2023-2030* ($)
Figure 163: Company 11 Electromechanical relay Market Net Revenue Share, By Business segments, 2023 (%)
Figure 164: Company 11 Electromechanical relay Market Net Sales Share, By Geography, 2023 (%)
Figure 165: Company 12 Electromechanical relay Market Net Revenue, By Years, 2023-2030* ($)
Figure 166: Company 12 Electromechanical relay Market Net Revenue Share, By Business segments, 2023 (%)
Figure 167: Company 12 Electromechanical relay Market Net Sales Share, By Geography, 2023 (%)
Figure 168: Company 13 Electromechanical relay Market Net Revenue, By Years, 2023-2030* ($)
Figure 169: Company 13 Electromechanical relay Market Net Revenue Share, By Business segments, 2023 (%)
Figure 170: Company 13 Electromechanical relay Market Net Sales Share, By Geography, 2023 (%)
Figure 171: Company 14 Electromechanical relay Market Net Revenue, By Years, 2023-2030* ($)
Figure 172: Company 14 Electromechanical relay Market Net Revenue Share, By Business segments, 2023 (%)
Figure 173: Company 14 Electromechanical relay Market Net Sales Share, By Geography, 2023 (%)
Figure 174: Company 15 Electromechanical relay Market Net Revenue, By Years, 2023-2030* ($)
Figure 175: Company 15 Electromechanical relay Market Net Revenue Share, By Business segments, 2023 (%)
Figure 176: Company 15 Electromechanical relay Market Net Sales Share, By Geography, 2023 (%)