 Email
Email Print
Print


Lip cancers are development of abnormal cells that grow out of control and form lesions or tumors on the lips. They are the most common type of oral cancers. These cancers develop in thin, flat cells — called squamous cells — that line the lips, mouth, tongue, cheeks, sinuses, throat, and hard and soft palates. Symptoms of lip cancer include soreness, lumps or pale colored ulcers in the mouth that are usually painless at first but may become painful with disease progression. According to the National Institute of Dental and Craniofacial Research, most cases of oral cancer are linked to tobacco use and heavy alcohol use apart from that sun exposure is also a major risk factor, especially for people who work outdoors since they are more likely to have prolonged sun exposure. Globally increasing awareness is expected to drive the demand for lip cancer treatment during the period of study.
Geographically North America dominated global lip cancer market, due to higher awareness amongst its citizens advanced health care infrastructure, and technological advancement. North America was followed by Europe and Asia-Pacific as second and third largest market respectively. Asia Pacific is projected to have fastest growth, owing to rapidly increasing awareness, developing healthcare infrastructure and increasing spending on healthcare in developing nations such as China, and India in this region.
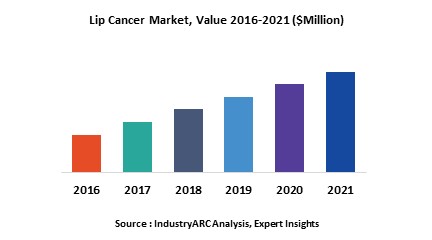
This report identifies the global lip cancer market size in for the year 2014-2016, and forecast of the same for year 2021. It also highlights the market drivers, restraints, growth indicators, challenges, and other key aspects with respect to global lip cancer market.
This report segments global lip cancer market on the basis of diagnosis test, causes and regional market as follows:
This report identifies all the major companies operating in the lip cancer market. Some of the major companies’ profiles in detail are as follows:
Geographically North America dominated global lip cancer market, due to higher awareness amongst its citizens advanced health care infrastructure, and technological advancement. North America was followed by Europe and Asia-Pacific as second and third largest market respectively. Asia Pacific is projected to have fastest growth, owing to rapidly increasing awareness, developing healthcare infrastructure and increasing spending on healthcare in developing nations such as China, and India in this region.
This report identifies the global lip cancer market size in for the year 2014-2016, and forecast of the same for year 2021. It also highlights the market drivers, restraints, growth indicators, challenges, and other key aspects with respect to global lip cancer market.
This report segments global lip cancer market on the basis of diagnosis test, causes and regional market as follows:
- Lip Cancer Market, By Diagnosis tests: computed tomography (CT) scan, MRI scan, positron emission tomography (PET) scan, chest X-ray, complete blood count (CBC))
- The report has focused study on lip cancer market by basis of major causes such as: Smoking, Alcohol, human papillomavirus (HPV), Others
- This report has been further segmented into major regions, which includes detailed analysis of each region such as: North America, Europe, Asia-Pacific (APAC), and Rest of the World (RoW) covering all the major country level markets in each of the region
This report identifies all the major companies operating in the lip cancer market. Some of the major companies’ profiles in detail are as follows:
- Astra Zeneca plc
- Bristol Myers Squibb
- Celgene
- Eli Lilly & Co.
- Hofmann La Roche
1. Lip Cancer Market - Overview
1.1. Definitions and Scope
2. Lip Cancer Market - Executive summary
2.1. Market Revenue, Market Size and Key Trends by Company
2.2. Key Trends by type of Application
2.3. Key Trends segmented by Geography
3. Lip Cancer Market
3.1. Comparative analysis
3.1.1. Product Benchmarking - Top 10 companies
3.1.2. Top 5 Financials Analysis
3.1.3. Market Value split by Top 10 companies
3.1.4. Patent Analysis - Top 10 companies
3.1.5. Pricing Analysis
4. Lip Cancer Market – Startup companies Scenario Premium
4.1. Top 10 startup company Analysis by
4.1.1. Investment
4.1.2. Revenue
4.1.3. Market Shares
4.1.4. Market Size and Application Analysis
4.1.5. Venture Capital and Funding Scenario
5. Lip Cancer Market – Industry Market Entry Scenario Premium
5.1. Regulatory Framework Overview
5.2. New Business and Ease of Doing business index
5.3. Case studies of successful ventures
5.4. Customer Analysis – Top 10 companies
6. Lip Cancer Market Forces
6.1. Drivers
6.2. Constraints
6.3. Challenges
6.4. Porters five force model
6.4.1. Bargaining power of suppliers
6.4.2. Bargaining powers of customers
6.4.3. Threat of new entrants
6.4.4. Rivalry among existing players
6.4.5. Threat of substitutes
7. Lip Cancer Market -Strategic analysis
7.1. Value chain analysis
7.2. Opportunities analysis
7.3. Product life cycle
7.4. Suppliers and distributors Market Share
8. Lip Cancer Market – By Diagnosis Test (Market Size -$Million / $Billion)
8.1. Market Size and Market Share Analysis
8.2. Application Revenue and Trend Research
8.3. Product Segment Analysis
8.3.1. computed tomography (CT) scan
8.3.2. MRI scan
8.3.3. positron emission tomography (PET) scan
8.3.4. chest X-ray
8.3.5. complete blood count (CBC)
8.3.6. Others
9. Lip Cancer Market – By Causes (Market Size -$Million / $Billion)
9.1. Smoking
9.2. Alcohol
9.3. human papillomavirus (HPV)
9.4. Others
10. Lip Cancer - By Geography (Market Size -$Million / $Billion)
10.1. Lip Cancer Market - North America Segment Research
10.2. North America Market Research (Million / $Billion)
10.2.1. Segment type Size and Market Size Analysis
10.2.2. Revenue and Trends
10.2.3. Application Revenue and Trends by type of Application
10.2.4. Company Revenue and Product Analysis
10.2.5. North America Product type and Application Market Size
10.2.5.1. U.S.
10.2.5.2. Canada
10.2.5.3. Mexico
10.2.5.4. Rest of North America
10.3. Lip Cancer - South America Segment Research
10.4. South America Market Research (Market Size -$Million / $Billion)
10.4.1. Segment type Size and Market Size Analysis
10.4.2. Revenue and Trends
10.4.3. Application Revenue and Trends by type of Application
10.4.4. Company Revenue and Product Analysis
10.4.5. South America Product type and Application Market Size
10.4.5.1. Brazil
10.4.5.2. Venezuela
10.4.5.3. Argentina
10.4.5.4. Ecuador
10.4.5.5. Peru
10.4.5.6. Colombia
10.4.5.7. Costa Rica
10.4.5.8. Rest of South America
10.5. Lip Cancer - Europe Segment Research
10.6. Europe Market Research (Market Size -$Million / $Billion)
10.6.1. Segment type Size and Market Size Analysis
10.6.2. Revenue and Trends
10.6.3. Application Revenue and Trends by type of Application
10.6.4. Company Revenue and Product Analysis
10.6.5. Europe Segment Product type and Application Market Size
10.6.5.1. U.K
10.6.5.2. Germany
10.6.5.3. Italy
10.6.5.4. France
10.6.5.5. Netherlands
10.6.5.6. Belgium
10.6.5.7. Spain
10.6.5.8. Denmark
10.6.5.9. Rest of Europe
10.7. Lip Cancer – APAC Segment Research
10.8. APAC Market Research (Market Size -$Million / $Billion)
10.8.1. Segment type Size and Market Size Analysis
10.8.2. Revenue and Trends
10.8.3. Application Revenue and Trends by type of Application
10.8.4. Company Revenue and Product Analysis
10.8.5. APAC Segment – Product type and Application Market Size
10.8.5.1. China
10.8.5.2. Australia
10.8.5.3. Japan
10.8.5.4. South Korea
10.8.5.5. India
10.8.5.6. Taiwan
10.8.5.7. Malaysia
11. Lip Cancer Market - Entropy
11.1. New product launches
11.2. M&A's, collaborations, JVs and partnerships
12. Lip Cancer Market – Industry / Segment Competition landscape Premium
12.1. Market Share Analysis
12.1.1. Market Share by Country- Top companies
12.1.2. Market Share by Region- Top 10 companies
12.1.3. Market Share by type of Application – Top 10 companies
12.1.4. Market Share by type of Product / Product category- Top 10 companies
12.1.5. Market Share at global level- Top 10 companies
12.1.6. Best Practises for companies
13. Lip Cancer Market – Key Company List by Country Premium
14. Lip Cancer Market Company Analysis
14.1. Market Share, Company Revenue, Products, M&A, Developments
14.2. Astra Zeneca plc
14.3. Bristol Myers Squibb
14.4. Celgene
14.5. Eli Lilly & Co
14.6. Hofmann La Roche
14.7. Pfizer
14.8. Sanofi Aventis
14.9. Teva Pharmaceuticals
14.10. Novartis AG
14.11. Cipla
14.12. Company 11
14.13. Company 12
14.14. Company 13
14.14. Company 14
"*Financials would be provided on a best efforts basis for private companies"
15. Lip Cancer Market -Appendix
15.1. Abbreviations
15.2. Sources
16. Lip Cancer Market -Methodology Premium
16.1. Research Methodology
16.1.1. Company Expert Interviews
16.1.2. Industry Databases
16.1.3. Associations
16.1.4. Company News
16.1.5. Company Annual Reports
16.1.6. Application Trends
16.1.7. New Products and Product database
16.1.8. Company Transcripts
16.1.9. R&D Trends
16.1.10. Key Opinion Leaders Interviews
16.1.11. Supply and Demand Trends
List of Tables:
Table1: Lip Cancer Market Overview 2023-2030
Table2: Lip Cancer Market Leader Analysis 2023-2030 (US$)
Table3: Lip Cancer Market Product Analysis 2023-2030 (US$)
Table4: Lip Cancer Market End User Analysis 2023-2030 (US$)
Table5: Lip Cancer Market Patent Analysis 2013-2023* (US$)
Table6: Lip Cancer Market Financial Analysis 2023-2030 (US$)
Table7: Lip Cancer Market Driver Analysis 2023-2030 (US$)
Table8: Lip Cancer Market Challenges Analysis 2023-2030 (US$)
Table9: Lip Cancer Market Constraint Analysis 2023-2030 (US$)
Table10: Lip Cancer Market Supplier Bargaining Power Analysis 2023-2030 (US$)
Table11: Lip Cancer Market Buyer Bargaining Power Analysis 2023-2030 (US$)
Table12: Lip Cancer Market Threat of Substitutes Analysis 2023-2030 (US$)
Table13: Lip Cancer Market Threat of New Entrants Analysis 2023-2030 (US$)
Table14: Lip Cancer Market Degree of Competition Analysis 2023-2030 (US$)
Table15: Lip Cancer Market Value Chain Analysis 2023-2030 (US$)
Table16: Lip Cancer Market Pricing Analysis 2023-2030 (US$)
Table17: Lip Cancer Market Opportunities Analysis 2023-2030 (US$)
Table18: Lip Cancer Market Product Life Cycle Analysis 2023-2030 (US$)
Table19: Lip Cancer Market Supplier Analysis 2023-2030 (US$)
Table20: Lip Cancer Market Distributor Analysis 2023-2030 (US$)
Table21: Lip Cancer Market Trend Analysis 2023-2030 (US$)
Table22: Lip Cancer Market Size 2023 (US$)
Table23: Lip Cancer Market Forecast Analysis 2023-2030 (US$)
Table24: Lip Cancer Market Sales Forecast Analysis 2023-2030 (Units)
Table25: Lip Cancer Market, Revenue & Volume, By Diagnosis Test, 2023-2030 ($)
Table26: Lip Cancer Market By Diagnosis Test, Revenue & Volume, By computed tomography (CT) scan, 2023-2030 ($)
Table27: Lip Cancer Market By Diagnosis Test, Revenue & Volume, By MRI scan, 2023-2030 ($)
Table28: Lip Cancer Market By Diagnosis Test, Revenue & Volume, By positron emission tomography (PET) scan, 2023-2030 ($)
Table29: Lip Cancer Market By Diagnosis Test, Revenue & Volume, By chest X-ray, 2023-2030 ($)
Table30: Lip Cancer Market By Diagnosis Test, Revenue & Volume, By complete blood count (CBC), 2023-2030 ($)
Table31: Lip Cancer Market, Revenue & Volume, By Causes, 2023-2030 ($)
Table32: Lip Cancer Market By Causes, Revenue & Volume, By Smoking, 2023-2030 ($)
Table33: Lip Cancer Market By Causes, Revenue & Volume, By Alcohol, 2023-2030 ($)
Table34: Lip Cancer Market By Causes, Revenue & Volume, By human papillomavirus (HPV), 2023-2030 ($)
Table35: North America Lip Cancer Market, Revenue & Volume, By Diagnosis Test, 2023-2030 ($)
Table36: North America Lip Cancer Market, Revenue & Volume, By Causes, 2023-2030 ($)
Table37: South america Lip Cancer Market, Revenue & Volume, By Diagnosis Test, 2023-2030 ($)
Table38: South america Lip Cancer Market, Revenue & Volume, By Causes, 2023-2030 ($)
Table39: Europe Lip Cancer Market, Revenue & Volume, By Diagnosis Test, 2023-2030 ($)
Table40: Europe Lip Cancer Market, Revenue & Volume, By Causes, 2023-2030 ($)
Table41: APAC Lip Cancer Market, Revenue & Volume, By Diagnosis Test, 2023-2030 ($)
Table42: APAC Lip Cancer Market, Revenue & Volume, By Causes, 2023-2030 ($)
Table43: Middle East & Africa Lip Cancer Market, Revenue & Volume, By Diagnosis Test, 2023-2030 ($)
Table44: Middle East & Africa Lip Cancer Market, Revenue & Volume, By Causes, 2023-2030 ($)
Table45: Russia Lip Cancer Market, Revenue & Volume, By Diagnosis Test, 2023-2030 ($)
Table46: Russia Lip Cancer Market, Revenue & Volume, By Causes, 2023-2030 ($)
Table47: Israel Lip Cancer Market, Revenue & Volume, By Diagnosis Test, 2023-2030 ($)
Table48: Israel Lip Cancer Market, Revenue & Volume, By Causes, 2023-2030 ($)
Table49: Top Companies 2023 (US$) Lip Cancer Market, Revenue & Volume
Table50: Product Launch 2023-2030 Lip Cancer Market, Revenue & Volume
Table51: Mergers & Acquistions 2023-2030 Lip Cancer Market, Revenue & Volume
List of Figures:
Figure 1: Overview of Lip Cancer Market 2023-2030
Figure 2: Market Share Analysis for Lip Cancer Market 2023 (US$)
Figure 3: Product Comparison in Lip Cancer Market 2023-2030 (US$)
Figure 4: End User Profile for Lip Cancer Market 2023-2030 (US$)
Figure 5: Patent Application and Grant in Lip Cancer Market 2013-2023* (US$)
Figure 6: Top 5 Companies Financial Analysis in Lip Cancer Market 2023-2030 (US$)
Figure 7: Market Entry Strategy in Lip Cancer Market 2023-2030
Figure 8: Ecosystem Analysis in Lip Cancer Market 2023
Figure 9: Average Selling Price in Lip Cancer Market 2023-2030
Figure 10: Top Opportunites in Lip Cancer Market 2023-2030
Figure 11: Market Life Cycle Analysis in Lip Cancer Market
Figure 12: GlobalBy Diagnosis TestLip Cancer Market Revenue, 2023-2030 ($)
Figure 13: GlobalBy CausesLip Cancer Market Revenue, 2023-2030 ($)
Figure 14: Global Lip Cancer Market - By Geography
Figure 15: Global Lip Cancer Market Value & Volume, By Geography, 2023-2030 ($)
Figure 16: Global Lip Cancer Market CAGR, By Geography, 2023-2030 (%)
Figure 17: North America Lip Cancer Market Value & Volume, 2023-2030 ($)
Figure 18: US Lip Cancer Market Value & Volume, 2023-2030 ($)
Figure 19: US GDP and Population, 2023-2030 ($)
Figure 20: US GDP – Composition of 2023, By Sector of Origin
Figure 21: US Export and Import Value & Volume, 2023-2030 ($)
Figure 22: Canada Lip Cancer Market Value & Volume, 2023-2030 ($)
Figure 23: Canada GDP and Population, 2023-2030 ($)
Figure 24: Canada GDP – Composition of 2023, By Sector of Origin
Figure 25: Canada Export and Import Value & Volume, 2023-2030 ($)
Figure 26: Mexico Lip Cancer Market Value & Volume, 2023-2030 ($)
Figure 27: Mexico GDP and Population, 2023-2030 ($)
Figure 28: Mexico GDP – Composition of 2023, By Sector of Origin
Figure 29: Mexico Export and Import Value & Volume, 2023-2030 ($)
Figure 30: South America Lip Cancer Market Value & Volume, 2023-2030 ($)
Figure 31: Brazil Lip Cancer Market Value & Volume, 2023-2030 ($)
Figure 32: Brazil GDP and Population, 2023-2030 ($)
Figure 33: Brazil GDP – Composition of 2023, By Sector of Origin
Figure 34: Brazil Export and Import Value & Volume, 2023-2030 ($)
Figure 35: Venezuela Lip Cancer Market Value & Volume, 2023-2030 ($)
Figure 36: Venezuela GDP and Population, 2023-2030 ($)
Figure 37: Venezuela GDP – Composition of 2023, By Sector of Origin
Figure 38: Venezuela Export and Import Value & Volume, 2023-2030 ($)
Figure 39: Argentina Lip Cancer Market Value & Volume, 2023-2030 ($)
Figure 40: Argentina GDP and Population, 2023-2030 ($)
Figure 41: Argentina GDP – Composition of 2023, By Sector of Origin
Figure 42: Argentina Export and Import Value & Volume, 2023-2030 ($)
Figure 43: Ecuador Lip Cancer Market Value & Volume, 2023-2030 ($)
Figure 44: Ecuador GDP and Population, 2023-2030 ($)
Figure 45: Ecuador GDP – Composition of 2023, By Sector of Origin
Figure 46: Ecuador Export and Import Value & Volume, 2023-2030 ($)
Figure 47: Peru Lip Cancer Market Value & Volume, 2023-2030 ($)
Figure 48: Peru GDP and Population, 2023-2030 ($)
Figure 49: Peru GDP – Composition of 2023, By Sector of Origin
Figure 50: Peru Export and Import Value & Volume, 2023-2030 ($)
Figure 51: Colombia Lip Cancer Market Value & Volume, 2023-2030 ($)
Figure 52: Colombia GDP and Population, 2023-2030 ($)
Figure 53: Colombia GDP – Composition of 2023, By Sector of Origin
Figure 54: Colombia Export and Import Value & Volume, 2023-2030 ($)
Figure 55: Costa Rica Lip Cancer Market Value & Volume, 2023-2030 ($)
Figure 56: Costa Rica GDP and Population, 2023-2030 ($)
Figure 57: Costa Rica GDP – Composition of 2023, By Sector of Origin
Figure 58: Costa Rica Export and Import Value & Volume, 2023-2030 ($)
Figure 59: Europe Lip Cancer Market Value & Volume, 2023-2030 ($)
Figure 60: U.K Lip Cancer Market Value & Volume, 2023-2030 ($)
Figure 61: U.K GDP and Population, 2023-2030 ($)
Figure 62: U.K GDP – Composition of 2023, By Sector of Origin
Figure 63: U.K Export and Import Value & Volume, 2023-2030 ($)
Figure 64: Germany Lip Cancer Market Value & Volume, 2023-2030 ($)
Figure 65: Germany GDP and Population, 2023-2030 ($)
Figure 66: Germany GDP – Composition of 2023, By Sector of Origin
Figure 67: Germany Export and Import Value & Volume, 2023-2030 ($)
Figure 68: Italy Lip Cancer Market Value & Volume, 2023-2030 ($)
Figure 69: Italy GDP and Population, 2023-2030 ($)
Figure 70: Italy GDP – Composition of 2023, By Sector of Origin
Figure 71: Italy Export and Import Value & Volume, 2023-2030 ($)
Figure 72: France Lip Cancer Market Value & Volume, 2023-2030 ($)
Figure 73: France GDP and Population, 2023-2030 ($)
Figure 74: France GDP – Composition of 2023, By Sector of Origin
Figure 75: France Export and Import Value & Volume, 2023-2030 ($)
Figure 76: Netherlands Lip Cancer Market Value & Volume, 2023-2030 ($)
Figure 77: Netherlands GDP and Population, 2023-2030 ($)
Figure 78: Netherlands GDP – Composition of 2023, By Sector of Origin
Figure 79: Netherlands Export and Import Value & Volume, 2023-2030 ($)
Figure 80: Belgium Lip Cancer Market Value & Volume, 2023-2030 ($)
Figure 81: Belgium GDP and Population, 2023-2030 ($)
Figure 82: Belgium GDP – Composition of 2023, By Sector of Origin
Figure 83: Belgium Export and Import Value & Volume, 2023-2030 ($)
Figure 84: Spain Lip Cancer Market Value & Volume, 2023-2030 ($)
Figure 85: Spain GDP and Population, 2023-2030 ($)
Figure 86: Spain GDP – Composition of 2023, By Sector of Origin
Figure 87: Spain Export and Import Value & Volume, 2023-2030 ($)
Figure 88: Denmark Lip Cancer Market Value & Volume, 2023-2030 ($)
Figure 89: Denmark GDP and Population, 2023-2030 ($)
Figure 90: Denmark GDP – Composition of 2023, By Sector of Origin
Figure 91: Denmark Export and Import Value & Volume, 2023-2030 ($)
Figure 92: APAC Lip Cancer Market Value & Volume, 2023-2030 ($)
Figure 93: China Lip Cancer Market Value & Volume, 2023-2030
Figure 94: China GDP and Population, 2023-2030 ($)
Figure 95: China GDP – Composition of 2023, By Sector of Origin
Figure 96: China Export and Import Value & Volume, 2023-2030 ($)Lip Cancer Market China Export and Import Value & Volume, 2023-2030 ($)
Figure 97: Australia Lip Cancer Market Value & Volume, 2023-2030 ($)
Figure 98: Australia GDP and Population, 2023-2030 ($)
Figure 99: Australia GDP – Composition of 2023, By Sector of Origin
Figure 100: Australia Export and Import Value & Volume, 2023-2030 ($)
Figure 101: South Korea Lip Cancer Market Value & Volume, 2023-2030 ($)
Figure 102: South Korea GDP and Population, 2023-2030 ($)
Figure 103: South Korea GDP – Composition of 2023, By Sector of Origin
Figure 104: South Korea Export and Import Value & Volume, 2023-2030 ($)
Figure 105: India Lip Cancer Market Value & Volume, 2023-2030 ($)
Figure 106: India GDP and Population, 2023-2030 ($)
Figure 107: India GDP – Composition of 2023, By Sector of Origin
Figure 108: India Export and Import Value & Volume, 2023-2030 ($)
Figure 109: Taiwan Lip Cancer Market Value & Volume, 2023-2030 ($)
Figure 110: Taiwan GDP and Population, 2023-2030 ($)
Figure 111: Taiwan GDP – Composition of 2023, By Sector of Origin
Figure 112: Taiwan Export and Import Value & Volume, 2023-2030 ($)
Figure 113: Malaysia Lip Cancer Market Value & Volume, 2023-2030 ($)
Figure 114: Malaysia GDP and Population, 2023-2030 ($)
Figure 115: Malaysia GDP – Composition of 2023, By Sector of Origin
Figure 116: Malaysia Export and Import Value & Volume, 2023-2030 ($)
Figure 117: Hong Kong Lip Cancer Market Value & Volume, 2023-2030 ($)
Figure 118: Hong Kong GDP and Population, 2023-2030 ($)
Figure 119: Hong Kong GDP – Composition of 2023, By Sector of Origin
Figure 120: Hong Kong Export and Import Value & Volume, 2023-2030 ($)
Figure 121: Middle East & Africa Lip Cancer Market Middle East & Africa 3D Printing Market Value & Volume, 2023-2030 ($)
Figure 122: Russia Lip Cancer Market Value & Volume, 2023-2030 ($)
Figure 123: Russia GDP and Population, 2023-2030 ($)
Figure 124: Russia GDP – Composition of 2023, By Sector of Origin
Figure 125: Russia Export and Import Value & Volume, 2023-2030 ($)
Figure 126: Israel Lip Cancer Market Value & Volume, 2023-2030 ($)
Figure 127: Israel GDP and Population, 2023-2030 ($)
Figure 128: Israel GDP – Composition of 2023, By Sector of Origin
Figure 129: Israel Export and Import Value & Volume, 2023-2030 ($)
Figure 130: Entropy Share, By Strategies, 2023-2030* (%)Lip Cancer Market
Figure 131: Developments, 2023-2030*Lip Cancer Market
Figure 132: Company 1 Lip Cancer Market Net Revenue, By Years, 2023-2030* ($)
Figure 133: Company 1 Lip Cancer Market Net Revenue Share, By Business segments, 2023 (%)
Figure 134: Company 1 Lip Cancer Market Net Sales Share, By Geography, 2023 (%)
Figure 135: Company 2 Lip Cancer Market Net Revenue, By Years, 2023-2030* ($)
Figure 136: Company 2 Lip Cancer Market Net Revenue Share, By Business segments, 2023 (%)
Figure 137: Company 2 Lip Cancer Market Net Sales Share, By Geography, 2023 (%)
Figure 138: Company 3 Lip Cancer Market Net Revenue, By Years, 2023-2030* ($)
Figure 139: Company 3 Lip Cancer Market Net Revenue Share, By Business segments, 2023 (%)
Figure 140: Company 3 Lip Cancer Market Net Sales Share, By Geography, 2023 (%)
Figure 141: Company 4 Lip Cancer Market Net Revenue, By Years, 2023-2030* ($)
Figure 142: Company 4 Lip Cancer Market Net Revenue Share, By Business segments, 2023 (%)
Figure 143: Company 4 Lip Cancer Market Net Sales Share, By Geography, 2023 (%)
Figure 144: Company 5 Lip Cancer Market Net Revenue, By Years, 2023-2030* ($)
Figure 145: Company 5 Lip Cancer Market Net Revenue Share, By Business segments, 2023 (%)
Figure 146: Company 5 Lip Cancer Market Net Sales Share, By Geography, 2023 (%)
Figure 147: Company 6 Lip Cancer Market Net Revenue, By Years, 2023-2030* ($)
Figure 148: Company 6 Lip Cancer Market Net Revenue Share, By Business segments, 2023 (%)
Figure 149: Company 6 Lip Cancer Market Net Sales Share, By Geography, 2023 (%)
Figure 150: Company 7 Lip Cancer Market Net Revenue, By Years, 2023-2030* ($)
Figure 151: Company 7 Lip Cancer Market Net Revenue Share, By Business segments, 2023 (%)
Figure 152: Company 7 Lip Cancer Market Net Sales Share, By Geography, 2023 (%)
Figure 153: Company 8 Lip Cancer Market Net Revenue, By Years, 2023-2030* ($)
Figure 154: Company 8 Lip Cancer Market Net Revenue Share, By Business segments, 2023 (%)
Figure 155: Company 8 Lip Cancer Market Net Sales Share, By Geography, 2023 (%)
Figure 156: Company 9 Lip Cancer Market Net Revenue, By Years, 2023-2030* ($)
Figure 157: Company 9 Lip Cancer Market Net Revenue Share, By Business segments, 2023 (%)
Figure 158: Company 9 Lip Cancer Market Net Sales Share, By Geography, 2023 (%)
Figure 159: Company 10 Lip Cancer Market Net Revenue, By Years, 2023-2030* ($)
Figure 160: Company 10 Lip Cancer Market Net Revenue Share, By Business segments, 2023 (%)
Figure 161: Company 10 Lip Cancer Market Net Sales Share, By Geography, 2023 (%)
Figure 162: Company 11 Lip Cancer Market Net Revenue, By Years, 2023-2030* ($)
Figure 163: Company 11 Lip Cancer Market Net Revenue Share, By Business segments, 2023 (%)
Figure 164: Company 11 Lip Cancer Market Net Sales Share, By Geography, 2023 (%)
Figure 165: Company 12 Lip Cancer Market Net Revenue, By Years, 2023-2030* ($)
Figure 166: Company 12 Lip Cancer Market Net Revenue Share, By Business segments, 2023 (%)
Figure 167: Company 12 Lip Cancer Market Net Sales Share, By Geography, 2023 (%)
Figure 168: Company 13 Lip Cancer Market Net Revenue, By Years, 2023-2030* ($)
Figure 169: Company 13 Lip Cancer Market Net Revenue Share, By Business segments, 2023 (%)
Figure 170: Company 13 Lip Cancer Market Net Sales Share, By Geography, 2023 (%)
Figure 171: Company 14 Lip Cancer Market Net Revenue, By Years, 2023-2030* ($)
Figure 172: Company 14 Lip Cancer Market Net Revenue Share, By Business segments, 2023 (%)
Figure 173: Company 14 Lip Cancer Market Net Sales Share, By Geography, 2023 (%)
Figure 174: Company 15 Lip Cancer Market Net Revenue, By Years, 2023-2030* ($)
Figure 175: Company 15 Lip Cancer Market Net Revenue Share, By Business segments, 2023 (%)
Figure 176: Company 15 Lip Cancer Market Net Sales Share, By Geography, 2023 (%)