 Email
Email Print
Print


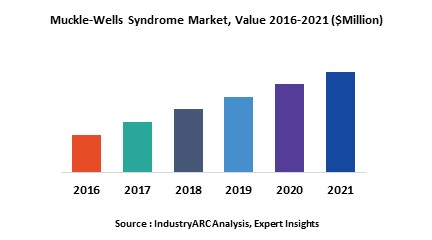
Muckle-Wells Syndrome Market - Forecast(2024 - 2030)
Muckle-Wells Syndrome (MWS) is a rare, genetic autosomal disease which leads to urticaria, sensorineural deafness, and also leads to amyloidosis. The disease is mainly caused due to mutation of CIAS1 gene, that leads to increased production of interleukin 1B. Globally, Extensive R&D activities, Technological advancement in research and genetic sciences and Growing concern about various genetic disorders are the prime growth drivers of global Muckle-Wells Syndrome market. In addition, increase in adoption of Muckle-Wells Syndrome for newer applications, will create new opportunities for global Muckle-Wells Syndrome market. However, higher cost of the research and development, lack of awareness and Low epidemiology are the key restraints for global Muckle-Wells Syndrome market.
Geographically North America dominated global Muckle-Wells Syndrome market, and Asia Pacific is projected to have fastest growth, owing to extensive R&D activities, technological advancement in research and genetic sciences and growing concern about various genetic disorders. Extensive R&D is one of the major factor, propelling the market growth. Among all the family of cryopyrin, associated periodic syndromes (CAPS) have the highest market share in global Muckle-Wells Syndrome market.
This report identifies the global Muckle-Wells Syndrome market size in for the year 2014-2016, and forecast of the same for year 2021. It also highlights the potential growth opportunities in the coming years, while also reviewing the market drivers, restraints, growth indicators, challenges, market dynamics, competitive landscape, and other key aspects with respect to global Muckle-Wells Syndrome market.
This report segments global Muckle-Wells Syndrome market on the basis of family of Cryopyrin, and regional market as follows:
This report identifies all the major companies operating in the Muckle-Wells Syndrome market. Some of the major companies’ profiles in detail are as follows:
Geographically North America dominated global Muckle-Wells Syndrome market, and Asia Pacific is projected to have fastest growth, owing to extensive R&D activities, technological advancement in research and genetic sciences and growing concern about various genetic disorders. Extensive R&D is one of the major factor, propelling the market growth. Among all the family of cryopyrin, associated periodic syndromes (CAPS) have the highest market share in global Muckle-Wells Syndrome market.
This report identifies the global Muckle-Wells Syndrome market size in for the year 2014-2016, and forecast of the same for year 2021. It also highlights the potential growth opportunities in the coming years, while also reviewing the market drivers, restraints, growth indicators, challenges, market dynamics, competitive landscape, and other key aspects with respect to global Muckle-Wells Syndrome market.
This report segments global Muckle-Wells Syndrome market on the basis of family of Cryopyrin, and regional market as follows:
- Muckle-Wells Syndrome Market, By family of Cryopyrin: Associated periodic syndromes (CAPS), mutation of CIAS1 gene and Others
- This report has been further segmented into major regions, which includes detailed analysis of each region such as: North America, Europe, Asia-Pacific (APAC), and Rest of the World (RoW) covering all the major country level markets in each of the region. The major countries considered under the Asia-Pacific region are India, China, South Korea and Japan. The major countries considered under the European region are Germany, U.K., France, Italy, Spain and Russia. The major countries considered under the North American region are United States, Canada and Mexico
This report identifies all the major companies operating in the Muckle-Wells Syndrome market. Some of the major companies’ profiles in detail are as follows:
- Novartis AG
- Istituto Giannina Gaslini
- Regeneron Pharmaceuticals, Inc.
- Charite-Universitatsmedizin Berlin
- Fresenius Medical Care.
1. Muckle-Wells Syndrome Market - Overview
1.1. Definitions and Scope
2. Muckle-Wells Syndrome Market - Executive summary
2.1. Market Revenue, Market Size and Key Trends by Company
2.2. Key Trends by type of Application
2.3. Key Trends segmented by Geography
3. Muckle-Wells Syndrome Market
3.1. Comparative analysis
3.1.1. Product Benchmarking - Top 10 companies
3.1.2. Top 5 Financials Analysis
3.1.3. Market Value split by Top 10 companies
3.1.4. Patent Analysis - Top 10 companies
3.1.5. Pricing Analysis
4. Muckle-Wells Syndrome Market – Startup companies Scenario Premium
4.1. Top 10 startup company Analysis by
4.1.1. Investment
4.1.2. Revenue
4.1.3. Market Shares
4.1.4. Market Size and Application Analysis
4.1.5. Venture Capital and Funding Scenario
5. Muckle-Wells Syndrome Market – Industry Market Entry Scenario Premium
5.1. Regulatory Framework Overview
5.2. New Business and Ease of Doing business index
5.3. Case studies of successful ventures
5.4. Customer Analysis – Top 10 companies
6. Muckle-Wells Syndrome Market Forces
6.1. Drivers
6.2. Constraints
6.3. Challenges
6.4. Porters five force model
6.4.1. Bargaining power of suppliers
6.4.2. Bargaining powers of customers
6.4.3. Threat of new entrants
6.4.4. Rivalry among existing players
6.4.5. Threat of substitutes
7. Muckle-Wells Syndrome Market -Strategic analysis
7.1. Value chain analysis
7.2. Opportunities analysis
7.3. Product life cycle
7.4. Suppliers and distributors Market Share
8. Muckle-Wells Syndrome Market – By family of Cryopyrin (Market Size -$Million / $Billion)
8.1. Market Size and Market Share Analysis
8.2. Application Revenue and Trend Research
8.3. Product Segment Analysis
8.3.1. Associated periodic syndromes (CAPS)
8.3.2. Mutation of CIAS1 gene Polyamide
8.3.3. Others
9. Muckle-Wells Syndrome - By Geography (Market Size -$Million / $Billion)
9.1. Muckle-Wells Syndrome Market - North America Segment Research
9.2. North America Market Research (Million / $Billion)
9.2.1. Segment type Size and Market Size Analysis
9.2.2. Revenue and Trends
9.2.3. Application Revenue and Trends by type of Application
9.2.4. Company Revenue and Product Analysis
9.2.5. North America Product type and Application Market Size
9.2.5.1. U.S.
9.2.5.2. Canada
9.2.5.3. Mexico
9.2.5.4. Rest of North America
9.3. Muckle-Wells Syndrome - South America Segment Research
9.4. South America Market Research (Market Size -$Million / $Billion)
9.4.1. Segment type Size and Market Size Analysis
9.4.2. Revenue and Trends
9.4.3. Application Revenue and Trends by type of Application
9.4.4. Company Revenue and Product Analysis
9.4.5. South America Product type and Application Market Size
9.4.5.1. Brazil
9.4.5.2. Venezuela
9.4.5.3. Argentina
9.4.5.4. Ecuador
9.4.5.5. Peru
9.4.5.6. Colombia
9.4.5.7. Costa Rica
9.4.5.8. Rest of South America
9.5. Muckle-Wells Syndrome - Europe Segment Research
9.6. Europe Market Research (Market Size -$Million / $Billion)
9.6.1. Segment type Size and Market Size Analysis
9.6.2. Revenue and Trends
9.6.3. Application Revenue and Trends by type of Application
9.6.4. Company Revenue and Product Analysis
9.6.5. Europe Segment Product type and Application Market Size
9.6.5.1. U.K
9.6.5.2. Germany
9.6.5.3. Italy
9.6.5.4. France
9.6.5.5. Netherlands
9.6.5.6. Belgium
9.6.5.7. Spain
9.6.5.8. Denmark
9.6.5.9. Rest of Europe
9.7. Muckle-Wells Syndrome – APAC Segment Research
9.8. APAC Market Research (Market Size -$Million / $Billion)
9.8.1. Segment type Size and Market Size Analysis
9.8.2. Revenue and Trends
9.8.3. Application Revenue and Trends by type of Application
9.8.4. Company Revenue and Product Analysis
9.8.5. APAC Segment – Product type and Application Market Size
9.8.5.1. China
9.8.5.2. Australia
9.8.5.3. Japan
9.8.5.4. South Korea
9.8.5.5. India
9.8.5.6. Taiwan
9.8.5.7. Malaysia
10. Muckle-Wells Syndrome Market - Entropy
10.1. New product launches
10.2. M&A's, collaborations, JVs and partnerships
11. Muckle-Wells Syndrome Market – Industry / Segment Competition landscape Premium
11.1. Market Share Analysis
11.1.1. Market Share by Country- Top companies
11.1.2. Market Share by Region- Top 10 companies
11.1.3. Market Share by type of Application – Top 10 companies
11.1.4. Market Share by type of Product / Product category- Top 10 companies
11.1.5. Market Share at global level- Top 10 companies
11.1.6. Best Practises for companies
12. Muckle-Wells Syndrome Market – Key Company List by Country Premium
13. Muckle-Wells Syndrome Market Company Analysis
13.1. Market Share, Company Revenue, Products, M&A, Developments
13.2. Novartis AG
13.3. Istituto Giannina Gaslini
13.4. Regeneron Pharmaceuticals, Inc.
13.5. Charite-Universitatsmedizin Berlin
13.6. Fresenius Medical Care
13.7. Huaren Pharmaceutical
13.8. NephroPlus
13.9. Nipro
13.10. Company 9
13.11. Company 10 and More
"*Financials would be provided on a best efforts basis for private companies"
14. Muckle-Wells Syndrome Market -Appendix
14.1. Abbreviations
14.2. Sources
15. Muckle-Wells Syndrome Market -Methodology Premium
15.1. Research Methodology
15.1.1. Company Expert Interviews
15.1.2. Industry Databases
15.1.3. Associations
15.1.4. Company News
15.1.5. Company Annual Reports
15.1.6. Application Trends
15.1.7. New Products and Product database
15.1.8. Company Transcripts
15.1.9. R&D Trends
15.1.10. Key Opinion Leaders Interviews
15.1.11. Supply and Demand Trends
List of Tables:
Table 1: Muckle-Wells Syndrome Market Overview 2023-2030
Table 2: Muckle-Wells Syndrome Market Leader Analysis 2023-2030 (US$)
Table 3: Muckle-Wells Syndrome Market Product Analysis 2023-2030 (US$)
Table 4: Muckle-Wells Syndrome Market End User Analysis 2023-2030 (US$)
Table 5: Muckle-Wells Syndrome Market Patent Analysis 2013-2023* (US$)
Table 6: Muckle-Wells Syndrome Market Financial Analysis 2023-2030 (US$)
Table 7: Muckle-Wells Syndrome Market Driver Analysis 2023-2030 (US$)
Table 8: Muckle-Wells Syndrome Market Challenges Analysis 2023-2030 (US$)
Table 9: Muckle-Wells Syndrome Market Constraint Analysis 2023-2030 (US$)
Table 10: Muckle-Wells Syndrome Market Supplier Bargaining Power Analysis 2023-2030 (US$)
Table 11: Muckle-Wells Syndrome Market Buyer Bargaining Power Analysis 2023-2030 (US$)
Table 12: Muckle-Wells Syndrome Market Threat of Substitutes Analysis 2023-2030 (US$)
Table 13: Muckle-Wells Syndrome Market Threat of New Entrants Analysis 2023-2030 (US$)
Table 14: Muckle-Wells Syndrome Market Degree of Competition Analysis 2023-2030 (US$)
Table 15: Muckle-Wells Syndrome Market Value Chain Analysis 2023-2030 (US$)
Table 16: Muckle-Wells Syndrome Market Pricing Analysis 2023-2030 (US$)
Table 17: Muckle-Wells Syndrome Market Opportunities Analysis 2023-2030 (US$)
Table 18: Muckle-Wells Syndrome Market Product Life Cycle Analysis 2023-2030 (US$)
Table 19: Muckle-Wells Syndrome Market Supplier Analysis 2023-2030 (US$)
Table 20: Muckle-Wells Syndrome Market Distributor Analysis 2023-2030 (US$)
Table 21: Muckle-Wells Syndrome Market Trend Analysis 2023-2030 (US$)
Table 22: Muckle-Wells Syndrome Market Size 2023 (US$)
Table 23: Muckle-Wells Syndrome Market Forecast Analysis 2023-2030 (US$)
Table 24: Muckle-Wells Syndrome Market Sales Forecast Analysis 2023-2030 (Units)
Table 25: Muckle-Wells Syndrome Market, Revenue & Volume, By family of Cryopyrin, 2023-2030 ($)
Table 26: Muckle-Wells Syndrome Market By family of Cryopyrin, Revenue & Volume, By Associated periodic syndromes (CAPS), 2023-2030 ($)
Table 27: Muckle-Wells Syndrome Market By family of Cryopyrin, Revenue & Volume, By Mutation of CIAS1 gene Polyamide, 2023-2030 ($)
Table 28: North America Muckle-Wells Syndrome Market, Revenue & Volume, By family of Cryopyrin, 2023-2030 ($)
Table 29: South america Muckle-Wells Syndrome Market, Revenue & Volume, By family of Cryopyrin, 2023-2030 ($)
Table 30: Europe Muckle-Wells Syndrome Market, Revenue & Volume, By family of Cryopyrin, 2023-2030 ($)
Table 31: APAC Muckle-Wells Syndrome Market, Revenue & Volume, By family of Cryopyrin, 2023-2030 ($)
Table 32: Middle East & Africa Muckle-Wells Syndrome Market, Revenue & Volume, By family of Cryopyrin, 2023-2030 ($)
Table 33: Russia Muckle-Wells Syndrome Market, Revenue & Volume, By family of Cryopyrin, 2023-2030 ($)
Table 34: Israel Muckle-Wells Syndrome Market, Revenue & Volume, By family of Cryopyrin, 2023-2030 ($)
Table 35: Top Companies 2023 (US$) Muckle-Wells Syndrome Market, Revenue & Volume
Table 36: Product Launch 2023-2030 Muckle-Wells Syndrome Market, Revenue & Volume
Table 37: Mergers & Acquistions 2023-2030 Muckle-Wells Syndrome Market, Revenue & Volume
List of Figures:
Figure 1: Overview of Muckle-Wells Syndrome Market 2023-2030
Figure 2: Market Share Analysis for Muckle-Wells Syndrome Market 2023 (US$)
Figure 3: Product Comparison in Muckle-Wells Syndrome Market 2023-2030 (US$)
Figure 4: End User Profile for Muckle-Wells Syndrome Market 2023-2030 (US$)
Figure 5: Patent Application and Grant in Muckle-Wells Syndrome Market 2013-2023* (US$)
Figure 6: Top 5 Companies Financial Analysis in Muckle-Wells Syndrome Market 2023-2030 (US$)
Figure 7: Market Entry Strategy in Muckle-Wells Syndrome Market 2023-2030
Figure 8: Ecosystem Analysis in Muckle-Wells Syndrome Market 2023
Figure 9: Average Selling Price in Muckle-Wells Syndrome Market 2023-2030
Figure 10: Top Opportunites in Muckle-Wells Syndrome Market 2023-2030
Figure 11: Market Life Cycle Analysis in Muckle-Wells Syndrome Market
Figure 12: GlobalBy family of Cryopyrin Muckle-Wells Syndrome Market Revenue, 2023-2030 ($)
Figure 13: Global Muckle-Wells Syndrome Market - By Geography
Figure 14: Global Muckle-Wells Syndrome Market Value & Volume, By Geography, 2023-2030 ($)
Figure 15: Global Muckle-Wells Syndrome Market CAGR, By Geography, 2023-2030 (%)
Figure 16: North America Muckle-Wells Syndrome Market Value & Volume, 2023-2030 ($)
Figure 17: US Muckle-Wells Syndrome Market Value & Volume, 2023-2030 ($)
Figure 18: US GDP and Population, 2023-2030 ($)
Figure 19: US GDP – Composition of 2023, By Sector of Origin
Figure 20: US Export and Import Value & Volume, 2023-2030 ($)
Figure 21: Canada Muckle-Wells Syndrome Market Value & Volume, 2023-2030 ($)
Figure 22: Canada GDP and Population, 2023-2030 ($)
Figure 23: Canada GDP – Composition of 2023, By Sector of Origin
Figure 24: Canada Export and Import Value & Volume, 2023-2030 ($)
Figure 25: Mexico Muckle-Wells Syndrome Market Value & Volume, 2023-2030 ($)
Figure 26: Mexico GDP and Population, 2023-2030 ($)
Figure 27: Mexico GDP – Composition of 2023, By Sector of Origin
Figure 28: Mexico Export and Import Value & Volume, 2023-2030 ($)
Figure 29: South America Muckle-Wells Syndrome Market Value & Volume, 2023-2030 ($)
Figure 30: Brazil Muckle-Wells Syndrome Market Value & Volume, 2023-2030 ($)
Figure 31: Brazil GDP and Population, 2023-2030 ($)
Figure 32: Brazil GDP – Composition of 2023, By Sector of Origin
Figure 33: Brazil Export and Import Value & Volume, 2023-2030 ($)
Figure 34: Venezuela Muckle-Wells Syndrome Market Value & Volume, 2023-2030 ($)
Figure 35: Venezuela GDP and Population, 2023-2030 ($)
Figure 36: Venezuela GDP – Composition of 2023, By Sector of Origin
Figure 37: Venezuela Export and Import Value & Volume, 2023-2030 ($)
Figure 38: Argentina Muckle-Wells Syndrome Market Value & Volume, 2023-2030 ($)
Figure 39: Argentina GDP and Population, 2023-2030 ($)
Figure 40: Argentina GDP – Composition of 2023, By Sector of Origin
Figure 41: Argentina Export and Import Value & Volume, 2023-2030 ($)
Figure 42: Ecuador Muckle-Wells Syndrome Market Value & Volume, 2023-2030 ($)
Figure 43: Ecuador GDP and Population, 2023-2030 ($)
Figure 44: Ecuador GDP – Composition of 2023, By Sector of Origin
Figure 45: Ecuador Export and Import Value & Volume, 2023-2030 ($)
Figure 46: Peru Muckle-Wells Syndrome Market Value & Volume, 2023-2030 ($)
Figure 47: Peru GDP and Population, 2023-2030 ($)
Figure 48: Peru GDP – Composition of 2023, By Sector of Origin
Figure 49: Peru Export and Import Value & Volume, 2023-2030 ($)
Figure 50: Colombia Muckle-Wells Syndrome Market Value & Volume, 2023-2030 ($)
Figure 51: Colombia GDP and Population, 2023-2030 ($)
Figure 52: Colombia GDP – Composition of 2023, By Sector of Origin
Figure 53: Colombia Export and Import Value & Volume, 2023-2030 ($)
Figure 54: Costa Rica Muckle-Wells Syndrome Market Value & Volume, 2023-2030 ($)
Figure 55: Costa Rica GDP and Population, 2023-2030 ($)
Figure 56: Costa Rica GDP – Composition of 2023, By Sector of Origin
Figure 57: Costa Rica Export and Import Value & Volume, 2023-2030 ($)
Figure 58: Europe Muckle-Wells Syndrome Market Value & Volume, 2023-2030 ($)
Figure 59: U.K Muckle-Wells Syndrome Market Value & Volume, 2023-2030 ($)
Figure 60: U.K GDP and Population, 2023-2030 ($)
Figure 61: U.K GDP – Composition of 2023, By Sector of Origin
Figure 62: U.K Export and Import Value & Volume, 2023-2030 ($)
Figure 63: Germany Muckle-Wells Syndrome Market Value & Volume, 2023-2030 ($)
Figure 64: Germany GDP and Population, 2023-2030 ($)
Figure 65: Germany GDP – Composition of 2023, By Sector of Origin
Figure 66: Germany Export and Import Value & Volume, 2023-2030 ($)
Figure 67: Italy Muckle-Wells Syndrome Market Value & Volume, 2023-2030 ($)
Figure 68: Italy GDP and Population, 2023-2030 ($)
Figure 69: Italy GDP – Composition of 2023, By Sector of Origin
Figure 70: Italy Export and Import Value & Volume, 2023-2030 ($)
Figure 71: France Muckle-Wells Syndrome Market Value & Volume, 2023-2030 ($)
Figure 72: France GDP and Population, 2023-2030 ($)
Figure 73: France GDP – Composition of 2023, By Sector of Origin
Figure 74: France Export and Import Value & Volume, 2023-2030 ($)
Figure 75: Netherlands Muckle-Wells Syndrome Market Value & Volume, 2023-2030 ($)
Figure 76: Netherlands GDP and Population, 2023-2030 ($)
Figure 77: Netherlands GDP – Composition of 2023, By Sector of Origin
Figure 78: Netherlands Export and Import Value & Volume, 2023-2030 ($)
Figure 79: Belgium Muckle-Wells Syndrome Market Value & Volume, 2023-2030 ($)
Figure 80: Belgium GDP and Population, 2023-2030 ($)
Figure 81: Belgium GDP – Composition of 2023, By Sector of Origin
Figure 82: Belgium Export and Import Value & Volume, 2023-2030 ($)
Figure 83: Spain Muckle-Wells Syndrome Market Value & Volume, 2023-2030 ($)
Figure 84: Spain GDP and Population, 2023-2030 ($)
Figure 85: Spain GDP – Composition of 2023, By Sector of Origin
Figure 86: Spain Export and Import Value & Volume, 2023-2030 ($)
Figure 87: Denmark Muckle-Wells Syndrome Market Value & Volume, 2023-2030 ($)
Figure 88: Denmark GDP and Population, 2023-2030 ($)
Figure 89: Denmark GDP – Composition of 2023, By Sector of Origin
Figure 90: Denmark Export and Import Value & Volume, 2023-2030 ($)
Figure 91: APAC Muckle-Wells Syndrome Market Value & Volume, 2023-2030 ($)
Figure 92: China Muckle-Wells Syndrome Market Value & Volume, 2023-2030
Figure 93: China GDP and Population, 2023-2030 ($)
Figure 94: China GDP – Composition of 2023, By Sector of Origin
Figure 95: China Export and Import Value & Volume, 2023-2030 ($) Muckle-Wells Syndrome Market China Export and Import Value & Volume, 2023-2030 ($)
Figure 96: Australia Muckle-Wells Syndrome Market Value & Volume, 2023-2030 ($)
Figure 97: Australia GDP and Population, 2023-2030 ($)
Figure 98: Australia GDP – Composition of 2023, By Sector of Origin
Figure 99: Australia Export and Import Value & Volume, 2023-2030 ($)
Figure 100: South Korea Muckle-Wells Syndrome Market Value & Volume, 2023-2030 ($)
Figure 101: South Korea GDP and Population, 2023-2030 ($)
Figure 102: South Korea GDP – Composition of 2023, By Sector of Origin
Figure 103: South Korea Export and Import Value & Volume, 2023-2030 ($)
Figure 104: India Muckle-Wells Syndrome Market Value & Volume, 2023-2030 ($)
Figure 105: India GDP and Population, 2023-2030 ($)
Figure 106: India GDP – Composition of 2023, By Sector of Origin
Figure 107: India Export and Import Value & Volume, 2023-2030 ($)
Figure 108: Taiwan Muckle-Wells Syndrome Market Value & Volume, 2023-2030 ($)
Figure 109: Taiwan GDP and Population, 2023-2030 ($)
Figure 110: Taiwan GDP – Composition of 2023, By Sector of Origin
Figure 111: Taiwan Export and Import Value & Volume, 2023-2030 ($)
Figure 112: Malaysia Muckle-Wells Syndrome Market Value & Volume, 2023-2030 ($)
Figure 113: Malaysia GDP and Population, 2023-2030 ($)
Figure 114: Malaysia GDP – Composition of 2023, By Sector of Origin
Figure 115: Malaysia Export and Import Value & Volume, 2023-2030 ($)
Figure 116: Hong Kong Muckle-Wells Syndrome Market Value & Volume, 2023-2030 ($)
Figure 117: Hong Kong GDP and Population, 2023-2030 ($)
Figure 118: Hong Kong GDP – Composition of 2023, By Sector of Origin
Figure 119: Hong Kong Export and Import Value & Volume, 2023-2030 ($)
Figure 120: Middle East & Africa Muckle-Wells Syndrome Market Middle East & Africa 3D Printing Market Value & Volume, 2023-2030 ($)
Figure 121: Russia Muckle-Wells Syndrome Market Value & Volume, 2023-2030 ($)
Figure 122: Russia GDP and Population, 2023-2030 ($)
Figure 123: Russia GDP – Composition of 2023, By Sector of Origin
Figure 124: Russia Export and Import Value & Volume, 2023-2030 ($)
Figure 125: Israel Muckle-Wells Syndrome Market Value & Volume, 2023-2030 ($)
Figure 126: Israel GDP and Population, 2023-2030 ($)
Figure 127: Israel GDP – Composition of 2023, By Sector of Origin
Figure 128: Israel Export and Import Value & Volume, 2023-2030 ($)
Figure 129: Entropy Share, By Strategies, 2023-2030* (%) Muckle-Wells Syndrome Market
Figure 130: Developments, 2023-2030* Muckle-Wells Syndrome Market
Figure 131: Company 1 Muckle-Wells Syndrome Market Net Revenue, By Years, 2023-2030* ($)
Figure 132: Company 1 Muckle-Wells Syndrome Market Net Revenue Share, By Business segments, 2023 (%)
Figure 133: Company 1 Muckle-Wells Syndrome Market Net Sales Share, By Geography, 2023 (%)
Figure 134: Company 2 Muckle-Wells Syndrome Market Net Revenue, By Years, 2023-2030* ($)
Figure 135: Company 2 Muckle-Wells Syndrome Market Net Revenue Share, By Business segments, 2023 (%)
Figure 136: Company 2 Muckle-Wells Syndrome Market Net Sales Share, By Geography, 2023 (%)
Figure 137: Company 3 Muckle-Wells Syndrome Market Net Revenue, By Years, 2023-2030* ($)
Figure 138: Company 3 Muckle-Wells Syndrome Market Net Revenue Share, By Business segments, 2023 (%)
Figure 139: Company 3 Muckle-Wells Syndrome Market Net Sales Share, By Geography, 2023 (%)
Figure 140: Company 4 Muckle-Wells Syndrome Market Net Revenue, By Years, 2023-2030* ($)
Figure 141: Company 4 Muckle-Wells Syndrome Market Net Revenue Share, By Business segments, 2023 (%)
Figure 142: Company 4 Muckle-Wells Syndrome Market Net Sales Share, By Geography, 2023 (%)
Figure 143: Company 5 Muckle-Wells Syndrome Market Net Revenue, By Years, 2023-2030* ($)
Figure 144: Company 5 Muckle-Wells Syndrome Market Net Revenue Share, By Business segments, 2023 (%)
Figure 145: Company 5 Muckle-Wells Syndrome Market Net Sales Share, By Geography, 2023 (%)
Figure 146: Company 6 Muckle-Wells Syndrome Market Net Revenue, By Years, 2023-2030* ($)
Figure 147: Company 6 Muckle-Wells Syndrome Market Net Revenue Share, By Business segments, 2023 (%)
Figure 148: Company 6 Muckle-Wells Syndrome Market Net Sales Share, By Geography, 2023 (%)
Figure 149: Company 7 Muckle-Wells Syndrome Market Net Revenue, By Years, 2023-2030* ($)
Figure 150: Company 7 Muckle-Wells Syndrome Market Net Revenue Share, By Business segments, 2023 (%)
Figure 151: Company 7 Muckle-Wells Syndrome Market Net Sales Share, By Geography, 2023 (%)
Figure 152: Company 8 Muckle-Wells Syndrome Market Net Revenue, By Years, 2023-2030* ($)
Figure 153: Company 8 Muckle-Wells Syndrome Market Net Revenue Share, By Business segments, 2023 (%)
Figure 154: Company 8 Muckle-Wells Syndrome Market Net Sales Share, By Geography, 2023 (%)
Figure 155: Company 9 Muckle-Wells Syndrome Market Net Revenue, By Years, 2023-2030* ($)
Figure 156: Company 9 Muckle-Wells Syndrome Market Net Revenue Share, By Business segments, 2023 (%)
Figure 157: Company 9 Muckle-Wells Syndrome Market Net Sales Share, By Geography, 2023 (%)
Figure 158: Company 10 Muckle-Wells Syndrome Market Net Revenue, By Years, 2023-2030* ($)
Figure 159: Company 10 Muckle-Wells Syndrome Market Net Revenue Share, By Business segments, 2023 (%)
Figure 160: Company 10 Muckle-Wells Syndrome Market Net Sales Share, By Geography, 2023 (%)
Figure 161: Company 11 Muckle-Wells Syndrome Market Net Revenue, By Years, 2023-2030* ($)
Figure 162: Company 11 Muckle-Wells Syndrome Market Net Revenue Share, By Business segments, 2023 (%)
Figure 163: Company 11 Muckle-Wells Syndrome Market Net Sales Share, By Geography, 2023 (%)
Figure 164: Company 12 Muckle-Wells Syndrome Market Net Revenue, By Years, 2023-2030* ($)
Figure 165: Company 12 Muckle-Wells Syndrome Market Net Revenue Share, By Business segments, 2023 (%)
Figure 166: Company 12 Muckle-Wells Syndrome Market Net Sales Share, By Geography, 2023 (%)
Figure 167: Company 13 Muckle-Wells Syndrome Market Net Revenue, By Years, 2023-2030* ($)
Figure 168: Company 13 Muckle-Wells Syndrome Market Net Revenue Share, By Business segments, 2023 (%)
Figure 169: Company 13 Muckle-Wells Syndrome Market Net Sales Share, By Geography, 2023 (%)
Figure 170: Company 14 Muckle-Wells Syndrome Market Net Revenue, By Years, 2023-2030* ($)
Figure 171: Company 14 Muckle-Wells Syndrome Market Net Revenue Share, By Business segments, 2023 (%)
Figure 172: Company 14 Muckle-Wells Syndrome Market Net Sales Share, By Geography, 2023 (%)
Figure 173: Company 15 Muckle-Wells Syndrome Market Net Revenue, By Years, 2023-2030* ($)
Figure 174: Company 15 Muckle-Wells Syndrome Market Net Revenue Share, By Business segments, 2023 (%)
Figure 175: Company 15 Muckle-Wells Syndrome Market Net Sales Share, By Geography, 2023 (%)