 Email
Email Print
Print


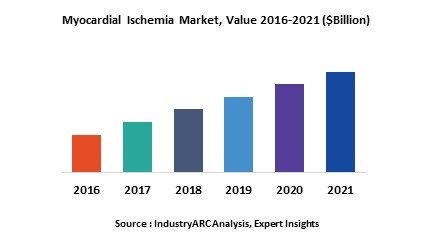
Myocardial Ischemia happens where there is an insufficient flow of blood in heart muscles. Some symptoms are, the heart is not able to pump oxygenated blood and other vital nutrients to the body efficiently and finally leads to destruction of the heart muscles. Blockage of an artery etc. Globally, prevalence of various heart-related diseases, and growing awareness of the population are the prime growth drivers of global Myocardial Ischemia market. In addition, increase in adoption of Myocardial Ischemia treatments in emerging economies such as China, India and others, will create new opportunities for global Myocardial Ischemia market. However, higher cost of the research and development, and limited healthcare infrastructure are the key restraints for global Myocardial Ischemia market.
Geographically North America dominated global Myocardial Ischemia market, followed by Europe. Europe is projected to have fastest growth, owing to increase in the prevalence of various heart-related diseases, and growing awareness of the population about cardiovascular diseases. Asia Pacific is developing rapidly and is considered to be as one of the most promising markets for the augmentation of myocardial ischemia market. The factors which will contribute towards the growth of this market in Asia Pacific are presence of emerging economies, constantly changing lifestyles of people which have accelerated the prevalence of serious heart ailments, and better healthcare infrastructures.
This report identifies the global Myocardial Ischemia market size in for the year 2014-2016, and forecast of the same for year 2021. It also highlights the market drivers, restraints, growth indicators, challenges, and other key aspects with respect to global Myocardial Ischemia market.
This report segments global Myocardial Ischemia market on the basis of diagnosis, treatment, and regional market as follows:
This report identifies all the major companies operating in the Myocardial Ischemia market. Some of the major companies’ profiles in detail are as follows:
Geographically North America dominated global Myocardial Ischemia market, followed by Europe. Europe is projected to have fastest growth, owing to increase in the prevalence of various heart-related diseases, and growing awareness of the population about cardiovascular diseases. Asia Pacific is developing rapidly and is considered to be as one of the most promising markets for the augmentation of myocardial ischemia market. The factors which will contribute towards the growth of this market in Asia Pacific are presence of emerging economies, constantly changing lifestyles of people which have accelerated the prevalence of serious heart ailments, and better healthcare infrastructures.
This report identifies the global Myocardial Ischemia market size in for the year 2014-2016, and forecast of the same for year 2021. It also highlights the market drivers, restraints, growth indicators, challenges, and other key aspects with respect to global Myocardial Ischemia market.
This report segments global Myocardial Ischemia market on the basis of diagnosis, treatment, and regional market as follows:
- Myocardial Ischemia Market, By Diagnosis: Cardiac CT Scan. ECG, Nuclear Scan, and Others
- The report has focused study on Myocardial Ischemia market on the basis of treatment such as: Medications, Surgery Methods, and Others
- This report has been further segmented into major regions, which includes detailed analysis of each region such as: North America, Europe, Asia-Pacific (APAC), and Rest of the World (RoW) covering all the major country level markets in each of the region
This report identifies all the major companies operating in the Myocardial Ischemia market. Some of the major companies’ profiles in detail are as follows:
- Baxter International, Inc
- Boston Scientific Corporation
- Cardium Therapeutics, Inc
- ViroMed Co. Ltd
- Atrium Medical Corporation
1. Myocardial Ischemia Market – Market Overview
2. Executive Summary
3. Market Landscape
3.1. Market Share Analysis
3.2. Comparative Analysis
3.3. Product Benchmarking
3.4. End User Profiling
3.5. Top 5 Financials Analysis
4. Myocardial Ischemia Market– Market Forces
4.1. Drivers
4.1.1. Prevalence of various heart-related diseases
4.1.2. Growing awareness of the population
4.2. Restraints
4.2.1. Limited health Infrastructure
4.3. Opportunities
4.3.1. Emerging economies
4.4. Challenges
4.5. Porter’s Five Forces Analysis
4.5.1. Bargaining Power of Suppliers
4.5.2. Bargaining Power of Buyers
4.5.3. Threat of New Entrants
4.5.4. Threat of Substitutes
4.5.5. Degree of Competition
5. Myocardial Ischemia Market– Strategic Analysis
5.1. Value Chain Analysis
5.2. Pricing Analysis
5.3. Opportunities Analysis
5.4. Product/Market Life Cycle Analysis
5.5. Suppliers and Distributors
6. Myocardial Ischemia Market, By Diagnosis
6.1. Cardiac CT Scan
6.2. Electrocardiogram
6.3. Nuclear Scan
6.4. Coronary Angiography
6.5. Holter Monitoring
7. Myocardial Ischemia Market, By Treatment
7.1. Medications
7.2. Surgery Methods
8. Myocardial Ischemia Market, By Geography
8.1. Europe
8.1.1. Germany
8.1.2. France
8.1.3. Italy
8.1.4. Spain
8.1.5. Russia
8.1.6. U.K.
8.1.7. Rest of Europe
8.2. Asia Pacific
8.2.1. China
8.2.2. India
8.2.3. Japan
8.2.4. South Korea
8.2.5. Rest of Asia-Pacific
8.3. North America
8.3.1. U.S.
8.3.2. Canada
8.3.3. Mexico
8.4. Rest of the World (RoW)
8.4.1. Brazil
8.4.2. Rest of RoW
9. Myocardial Ischemia – Market Entropy
9.1. Expansion
9.2. Technological Developments
9.3. Merger & Acquisitions, and Joint Ventures
9.4. Supply- Contract
10. Company Profiles (Overview, Financials, SWOT Analysis, Developments, Product Portfolio)
10.1. Baxter International, Inc
10.2. Boston Scientific Corporation
10.3. Cardium Therapeutics, Inc
10.4. ViroMed Co. Ltd
10.5. Atrium Medical Corporation
10.6. Vasade Biosciences, Inc.
10.7. Sanofi
10.8. Pfizer Inc
10.9. Medicure Inc
10.10. Terumo Interventional Systems Inc.
*More than 40 Companies are profiled in this Research Report, Complete List available on Request*
"*Financials would be provided on a best efforts basis for private companies"
11. Appendix
11.1. Abbreviations
11.2. Sources
11.3. Research Methodology
11.4. Bibliography
11.5. Compilation of Expert Insights
11.6. Disclaimer
List of Tables:
Table 1: Myocardial Ischemia Market Overview 2023-2030
Table 2: Myocardial Ischemia Market Leader Analysis 2023-2030 (US$)
Table 3: Myocardial Ischemia Market Product Analysis 2023-2030 (US$)
Table 4: Myocardial Ischemia Market End User Analysis 2023-2030 (US$)
Table 5: Myocardial Ischemia Market Patent Analysis 2013-2023* (US$)
Table 6: Myocardial Ischemia Market Financial Analysis 2023-2030 (US$)
Table 7: Myocardial Ischemia Market Driver Analysis 2023-2030 (US$)
Table 8: Myocardial Ischemia Market Challenges Analysis 2023-2030 (US$)
Table 9: Myocardial Ischemia Market Constraint Analysis 2023-2030 (US$)
Table 10: Myocardial Ischemia Market Supplier Bargaining Power Analysis 2023-2030 (US$)
Table 11: Myocardial Ischemia Market Buyer Bargaining Power Analysis 2023-2030 (US$)
Table 12: Myocardial Ischemia Market Threat of Substitutes Analysis 2023-2030 (US$)
Table 13: Myocardial Ischemia Market Threat of New Entrants Analysis 2023-2030 (US$)
Table 14: Myocardial Ischemia Market Degree of Competition Analysis 2023-2030 (US$)
Table 15: Myocardial Ischemia Market Value Chain Analysis 2023-2030 (US$)
Table 16: Myocardial Ischemia Market Pricing Analysis 2023-2030 (US$)
Table 17: Myocardial Ischemia Market Opportunities Analysis 2023-2030 (US$)
Table 18: Myocardial Ischemia Market Product Life Cycle Analysis 2023-2030 (US$)
Table 19: Myocardial Ischemia Market Supplier Analysis 2023-2030 (US$)
Table 20: Myocardial Ischemia Market Distributor Analysis 2023-2030 (US$)
Table 21: Myocardial Ischemia Market Trend Analysis 2023-2030 (US$)
Table 22: Myocardial Ischemia Market Size 2023 (US$)
Table 23: Myocardial Ischemia Market Forecast Analysis 2023-2030 (US$)
Table 24: Myocardial Ischemia Market Sales Forecast Analysis 2023-2030 (Units)
Table 25: Top Companies 2023 (US$)Myocardial Ischemia Market , Revenue & Volume
Table 26: Product Launch 2023-2030Myocardial Ischemia Market , Revenue & Volume
Table 27: Mergers & Acquistions 2023-2030Myocardial Ischemia Market , Revenue & Volume
List of Figures:
Figure 1: Overview of Myocardial Ischemia Market 2023-2030
Figure 2: Market Share Analysis for Myocardial Ischemia Market 2023 (US$)
Figure 3: Product Comparison in Myocardial Ischemia Market 2023-2030 (US$)
Figure 4: End User Profile for Myocardial Ischemia Market 2023-2030 (US$)
Figure 5: Patent Application and Grant in Myocardial Ischemia Market 2013-2023* (US$)
Figure 6: Top 5 Companies Financial Analysis in Myocardial Ischemia Market 2023-2030 (US$)
Figure 7: Market Entry Strategy in Myocardial Ischemia Market 2023-2030
Figure 8: Ecosystem Analysis in Myocardial Ischemia Market 2023
Figure 9: Average Selling Price in Myocardial Ischemia Market 2023-2030
Figure 10: Top Opportunites in Myocardial Ischemia Market 2023-2030
Figure 11: Market Life Cycle Analysis in Myocardial Ischemia Market
Figure 12: Global Myocardial Ischemia Market - By Geography
Figure 13: Global Myocardial Ischemia Market Value & Volume, By Geography, 2023-2030 ($)
Figure 14: Global Myocardial Ischemia Market CAGR, By Geography, 2023-2030 (%)
Figure 15: North America Myocardial Ischemia Market Value & Volume, 2023-2030 ($)
Figure 16: US Myocardial Ischemia Market Value & Volume, 2023-2030 ($)
Figure 17: US GDP and Population, 2023-2030 ($)
Figure 18: US GDP – Composition of 2023, By Sector of Origin
Figure 19: US Export and Import Value & Volume, 2023-2030 ($)
Figure 20: Canada Myocardial Ischemia Market Value & Volume, 2023-2030 ($)
Figure 21: Canada GDP and Population, 2023-2030 ($)
Figure 22: Canada GDP – Composition of 2023, By Sector of Origin
Figure 23: Canada Export and Import Value & Volume, 2023-2030 ($)
Figure 24: Mexico Myocardial Ischemia Market Value & Volume, 2023-2030 ($)
Figure 25: Mexico GDP and Population, 2023-2030 ($)
Figure 26: Mexico GDP – Composition of 2023, By Sector of Origin
Figure 27: Mexico Export and Import Value & Volume, 2023-2030 ($)
Figure 28: South America Myocardial Ischemia Market Value & Volume, 2023-2030 ($)
Figure 29: Brazil Myocardial Ischemia Market Value & Volume, 2023-2030 ($)
Figure 30: Brazil GDP and Population, 2023-2030 ($)
Figure 31: Brazil GDP – Composition of 2023, By Sector of Origin
Figure 32: Brazil Export and Import Value & Volume, 2023-2030 ($)
Figure 33: Venezuela Myocardial Ischemia Market Value & Volume, 2023-2030 ($)
Figure 34: Venezuela GDP and Population, 2023-2030 ($)
Figure 35: Venezuela GDP – Composition of 2023, By Sector of Origin
Figure 36: Venezuela Export and Import Value & Volume, 2023-2030 ($)
Figure 37: Argentina Myocardial Ischemia Market Value & Volume, 2023-2030 ($)
Figure 38: Argentina GDP and Population, 2023-2030 ($)
Figure 39: Argentina GDP – Composition of 2023, By Sector of Origin
Figure 40: Argentina Export and Import Value & Volume, 2023-2030 ($)
Figure 41: Ecuador Myocardial Ischemia Market Value & Volume, 2023-2030 ($)
Figure 42: Ecuador GDP and Population, 2023-2030 ($)
Figure 43: Ecuador GDP – Composition of 2023, By Sector of Origin
Figure 44: Ecuador Export and Import Value & Volume, 2023-2030 ($)
Figure 45: Peru Myocardial Ischemia Market Value & Volume, 2023-2030 ($)
Figure 46: Peru GDP and Population, 2023-2030 ($)
Figure 47: Peru GDP – Composition of 2023, By Sector of Origin
Figure 48: Peru Export and Import Value & Volume, 2023-2030 ($)
Figure 49: Colombia Myocardial Ischemia Market Value & Volume, 2023-2030 ($)
Figure 50: Colombia GDP and Population, 2023-2030 ($)
Figure 51: Colombia GDP – Composition of 2023, By Sector of Origin
Figure 52: Colombia Export and Import Value & Volume, 2023-2030 ($)
Figure 53: Costa Rica Myocardial Ischemia Market Value & Volume, 2023-2030 ($)
Figure 54: Costa Rica GDP and Population, 2023-2030 ($)
Figure 55: Costa Rica GDP – Composition of 2023, By Sector of Origin
Figure 56: Costa Rica Export and Import Value & Volume, 2023-2030 ($)
Figure 57: Europe Myocardial Ischemia Market Value & Volume, 2023-2030 ($)
Figure 58: U.K Myocardial Ischemia Market Value & Volume, 2023-2030 ($)
Figure 59: U.K GDP and Population, 2023-2030 ($)
Figure 60: U.K GDP – Composition of 2023, By Sector of Origin
Figure 61: U.K Export and Import Value & Volume, 2023-2030 ($)
Figure 62: Germany Myocardial Ischemia Market Value & Volume, 2023-2030 ($)
Figure 63: Germany GDP and Population, 2023-2030 ($)
Figure 64: Germany GDP – Composition of 2023, By Sector of Origin
Figure 65: Germany Export and Import Value & Volume, 2023-2030 ($)
Figure 66: Italy Myocardial Ischemia Market Value & Volume, 2023-2030 ($)
Figure 67: Italy GDP and Population, 2023-2030 ($)
Figure 68: Italy GDP – Composition of 2023, By Sector of Origin
Figure 69: Italy Export and Import Value & Volume, 2023-2030 ($)
Figure 70: France Myocardial Ischemia Market Value & Volume, 2023-2030 ($)
Figure 71: France GDP and Population, 2023-2030 ($)
Figure 72: France GDP – Composition of 2023, By Sector of Origin
Figure 73: France Export and Import Value & Volume, 2023-2030 ($)
Figure 74: Netherlands Myocardial Ischemia Market Value & Volume, 2023-2030 ($)
Figure 75: Netherlands GDP and Population, 2023-2030 ($)
Figure 76: Netherlands GDP – Composition of 2023, By Sector of Origin
Figure 77: Netherlands Export and Import Value & Volume, 2023-2030 ($)
Figure 78: Belgium Myocardial Ischemia Market Value & Volume, 2023-2030 ($)
Figure 79: Belgium GDP and Population, 2023-2030 ($)
Figure 80: Belgium GDP – Composition of 2023, By Sector of Origin
Figure 81: Belgium Export and Import Value & Volume, 2023-2030 ($)
Figure 82: Spain Myocardial Ischemia Market Value & Volume, 2023-2030 ($)
Figure 83: Spain GDP and Population, 2023-2030 ($)
Figure 84: Spain GDP – Composition of 2023, By Sector of Origin
Figure 85: Spain Export and Import Value & Volume, 2023-2030 ($)
Figure 86: Denmark Myocardial Ischemia Market Value & Volume, 2023-2030 ($)
Figure 87: Denmark GDP and Population, 2023-2030 ($)
Figure 88: Denmark GDP – Composition of 2023, By Sector of Origin
Figure 89: Denmark Export and Import Value & Volume, 2023-2030 ($)
Figure 90: APAC Myocardial Ischemia Market Value & Volume, 2023-2030 ($)
Figure 91: China Myocardial Ischemia Market Value & Volume, 2023-2030
Figure 92: China GDP and Population, 2023-2030 ($)
Figure 93: China GDP – Composition of 2023, By Sector of Origin
Figure 94: China Export and Import Value & Volume, 2023-2030 ($)Myocardial Ischemia Market China Export and Import Value & Volume, 2023-2030 ($)
Figure 95: Australia Myocardial Ischemia Market Value & Volume, 2023-2030 ($)
Figure 96: Australia GDP and Population, 2023-2030 ($)
Figure 97: Australia GDP – Composition of 2023, By Sector of Origin
Figure 98: Australia Export and Import Value & Volume, 2023-2030 ($)
Figure 99: South Korea Myocardial Ischemia Market Value & Volume, 2023-2030 ($)
Figure 100: South Korea GDP and Population, 2023-2030 ($)
Figure 101: South Korea GDP – Composition of 2023, By Sector of Origin
Figure 102: South Korea Export and Import Value & Volume, 2023-2030 ($)
Figure 103: India Myocardial Ischemia Market Value & Volume, 2023-2030 ($)
Figure 104: India GDP and Population, 2023-2030 ($)
Figure 105: India GDP – Composition of 2023, By Sector of Origin
Figure 106: India Export and Import Value & Volume, 2023-2030 ($)
Figure 107: Taiwan Myocardial Ischemia Market Value & Volume, 2023-2030 ($)
Figure 108: Taiwan GDP and Population, 2023-2030 ($)
Figure 109: Taiwan GDP – Composition of 2023, By Sector of Origin
Figure 110: Taiwan Export and Import Value & Volume, 2023-2030 ($)
Figure 111: Malaysia Myocardial Ischemia Market Value & Volume, 2023-2030 ($)
Figure 112: Malaysia GDP and Population, 2023-2030 ($)
Figure 113: Malaysia GDP – Composition of 2023, By Sector of Origin
Figure 114: Malaysia Export and Import Value & Volume, 2023-2030 ($)
Figure 115: Hong Kong Myocardial Ischemia Market Value & Volume, 2023-2030 ($)
Figure 116: Hong Kong GDP and Population, 2023-2030 ($)
Figure 117: Hong Kong GDP – Composition of 2023, By Sector of Origin
Figure 118: Hong Kong Export and Import Value & Volume, 2023-2030 ($)
Figure 119: Middle East & Africa Myocardial Ischemia Market Middle East & Africa 3D Printing Market Value & Volume, 2023-2030 ($)
Figure 120: Russia Myocardial Ischemia Market Value & Volume, 2023-2030 ($)
Figure 121: Russia GDP and Population, 2023-2030 ($)
Figure 122: Russia GDP – Composition of 2023, By Sector of Origin
Figure 123: Russia Export and Import Value & Volume, 2023-2030 ($)
Figure 124: Israel Myocardial Ischemia Market Value & Volume, 2023-2030 ($)
Figure 125: Israel GDP and Population, 2023-2030 ($)
Figure 126: Israel GDP – Composition of 2023, By Sector of Origin
Figure 127: Israel Export and Import Value & Volume, 2023-2030 ($)
Figure 128: Entropy Share, By Strategies, 2023-2030* (%)Myocardial Ischemia Market
Figure 129: Developments, 2023-2030*Myocardial Ischemia Market
Figure 130: Company 1 Myocardial Ischemia Market Net Revenue, By Years, 2023-2030* ($)
Figure 131: Company 1 Myocardial Ischemia Market Net Revenue Share, By Business segments, 2023 (%)
Figure 132: Company 1 Myocardial Ischemia Market Net Sales Share, By Geography, 2023 (%)
Figure 133: Company 2 Myocardial Ischemia Market Net Revenue, By Years, 2023-2030* ($)
Figure 134: Company 2 Myocardial Ischemia Market Net Revenue Share, By Business segments, 2023 (%)
Figure 135: Company 2 Myocardial Ischemia Market Net Sales Share, By Geography, 2023 (%)
Figure 136: Company 3 Myocardial Ischemia Market Net Revenue, By Years, 2023-2030* ($)
Figure 137: Company 3 Myocardial Ischemia Market Net Revenue Share, By Business segments, 2023 (%)
Figure 138: Company 3 Myocardial Ischemia Market Net Sales Share, By Geography, 2023 (%)
Figure 139: Company 4 Myocardial Ischemia Market Net Revenue, By Years, 2023-2030* ($)
Figure 140: Company 4 Myocardial Ischemia Market Net Revenue Share, By Business segments, 2023 (%)
Figure 141: Company 4 Myocardial Ischemia Market Net Sales Share, By Geography, 2023 (%)
Figure 142: Company 5 Myocardial Ischemia Market Net Revenue, By Years, 2023-2030* ($)
Figure 143: Company 5 Myocardial Ischemia Market Net Revenue Share, By Business segments, 2023 (%)
Figure 144: Company 5 Myocardial Ischemia Market Net Sales Share, By Geography, 2023 (%)
Figure 145: Company 6 Myocardial Ischemia Market Net Revenue, By Years, 2023-2030* ($)
Figure 146: Company 6 Myocardial Ischemia Market Net Revenue Share, By Business segments, 2023 (%)
Figure 147: Company 6 Myocardial Ischemia Market Net Sales Share, By Geography, 2023 (%)
Figure 148: Company 7 Myocardial Ischemia Market Net Revenue, By Years, 2023-2030* ($)
Figure 149: Company 7 Myocardial Ischemia Market Net Revenue Share, By Business segments, 2023 (%)
Figure 150: Company 7 Myocardial Ischemia Market Net Sales Share, By Geography, 2023 (%)
Figure 151: Company 8 Myocardial Ischemia Market Net Revenue, By Years, 2023-2030* ($)
Figure 152: Company 8 Myocardial Ischemia Market Net Revenue Share, By Business segments, 2023 (%)
Figure 153: Company 8 Myocardial Ischemia Market Net Sales Share, By Geography, 2023 (%)
Figure 154: Company 9 Myocardial Ischemia Market Net Revenue, By Years, 2023-2030* ($)
Figure 155: Company 9 Myocardial Ischemia Market Net Revenue Share, By Business segments, 2023 (%)
Figure 156: Company 9 Myocardial Ischemia Market Net Sales Share, By Geography, 2023 (%)
Figure 157: Company 10 Myocardial Ischemia Market Net Revenue, By Years, 2023-2030* ($)
Figure 158: Company 10 Myocardial Ischemia Market Net Revenue Share, By Business segments, 2023 (%)
Figure 159: Company 10 Myocardial Ischemia Market Net Sales Share, By Geography, 2023 (%)
Figure 160: Company 11 Myocardial Ischemia Market Net Revenue, By Years, 2023-2030* ($)
Figure 161: Company 11 Myocardial Ischemia Market Net Revenue Share, By Business segments, 2023 (%)
Figure 162: Company 11 Myocardial Ischemia Market Net Sales Share, By Geography, 2023 (%)
Figure 163: Company 12 Myocardial Ischemia Market Net Revenue, By Years, 2023-2030* ($)
Figure 164: Company 12 Myocardial Ischemia Market Net Revenue Share, By Business segments, 2023 (%)
Figure 165: Company 12 Myocardial Ischemia Market Net Sales Share, By Geography, 2023 (%)
Figure 166: Company 13 Myocardial Ischemia Market Net Revenue, By Years, 2023-2030* ($)
Figure 167: Company 13 Myocardial Ischemia Market Net Revenue Share, By Business segments, 2023 (%)
Figure 168: Company 13 Myocardial Ischemia Market Net Sales Share, By Geography, 2023 (%)
Figure 169: Company 14 Myocardial Ischemia Market Net Revenue, By Years, 2023-2030* ($)
Figure 170: Company 14 Myocardial Ischemia Market Net Revenue Share, By Business segments, 2023 (%)
Figure 171: Company 14 Myocardial Ischemia Market Net Sales Share, By Geography, 2023 (%)
Figure 172: Company 15 Myocardial Ischemia Market Net Revenue, By Years, 2023-2030* ($)
Figure 173: Company 15 Myocardial Ischemia Market Net Revenue Share, By Business segments, 2023 (%)
Figure 174: Company 15 Myocardial Ischemia Market Net Sales Share, By Geography, 2023 (%)